Macroeconomic Stability
and Ex port Growth
ACROECONOMIC STABILlTY AND RAPID EX- port growth キイ@ エキッォケ@ ャュョエウ@ in starting
エィ@ virtuous 」ゥイ」ャウ@ of high rates of accumula-
tLon, ヲヲゥ」ゥ・ョエ@ allocation, and strong ーイッ、オャvᆳ
ity growth that ヲッイュ、@ the basis for East Asii’s success. gッカ・イョュョエウ@ 。」ィゥカ・、@ ュ。」イッ」ッᆳ
nomic stability by adhering to orthodox policy ーイウ」イゥーエゥッョウMゥョ@ partic-
c&Fh ular, by holding budget defìcits to levels that could be prudently
’
li
fìnanced. They 。」ィゥカ、@ rapid export growth through an export pushrtLf a combination of orthodox, ュ。イォエMッイゥ・ョエ、ュ」ィ。ョゥウュウ @ many ャゥョォ 、@
to macroeconomic stability, and 」ッューャュョエ。イケ@ proexport incentives. 1
‘rr!ru Policy initiatives in エィ・ウ@ two 。イ。ウ@ shared two features that further
ゥャャオウエイ。エ@ the framework ッオエャゥョ、@ in chapter 2: イ・ウー」エ@ for 」イエ。ゥョ@
1
ヲオョ、 ョョエ。ャウMヲッイ@ ク。ューャ @ fìscal ーイオ、ョ」@ and 。カッゥ、。ョ」@ ofク」ィ。ョァ@
rate overvaluation; and quick and ヲャクゥ「ャ・@ responses to changing eco- nomic 」ゥイ」オュウエ。ョ」 ウN@ Policies to 。」ィゥカ@ macroeconomic stability and rapid クーッイエ@ growth differed ッカイ@ エゥュ@ and across economies, partly 「 @
」。オウ@ ァッカイョュョエウ@ キ イ・@ イウーッョ、ゥョァ@ to a changing economic ョvャイッョᆳ
ment and partly because エィケ@ were seeking ヲヲゥ」ゥョエ@ policy ー。」ォ。ァウ@
through trial and error.
w・、ヲ↓ョ@ ュ。」イッ」ッョッュゥ」@ stability to mean that inflation was kept
under control, ゥョエイョ。ャ@ and クエイョ。ャ@ debt イ・ュ。ゥョ、@ ュ。ョ。ァ。「ャ @ and
ュ。」イッ」ッョッュ ャc@ 」ョウウ@ that ュ・イァ・、@ キイ@ イウッャカ、@ quickly, usually
within a ケ。イ@ or two. Short recessions and policy 。、ェオウエュョエウ@ to macro- economic ウエイウウ@ ウッュエゥュウ@ ウアオコ、@ エィ@ private ウ」エッイN@ But エィウ@ キイ@
transitional ーイゥッ、ウ@ to ョキ・ーゥウッ、ウ@ of rapid growth, アオゥエ@ オョャゥォ @ エィ@
years of recession and uncertainty that ィ。カ@ plagued many other devel-
Op1l1g 」ッョッヲヲゥャウ @ particularly in SubSaharan Mrica and Latin aュ ョ」。N@
105
IRACLE
f
106
Export push is a more 」ッューャクーィョッュQQPョ@ than macroeconomic sta- bility and the variety of policies used is greater. m」ィ。ョゥウュウ@ イ。ョァG@ from broad, exportfrìendly ュ。ウオイ・ウ@ such as avoiding an appreciated ク」ィ。ョァ・@
rate, whìch are employed in all the HPAEs, to ァッカ・イョュョエMイオ ャQ@ expOrt con- tests
,
which have been オウ primarìly in Japan,
the Republìc ofKorea,
and t キ。ョ @ China. uョ↓カイウ。ャ@ export ゥョ」・ョエゥカウ @ such as tax breaks and credit guarantees for all クーッイエ・イウ @ have 「・ョ@ the main Înstruments in Hong Kong,
lndonesìa,
Malaysia,
Singapore,
and Thailand. Despite this diver- sity of approach, as a group the HPAEs are unique among 、カャッーゥョァ@ coun-エイゥウ@ in the attention エィZケ@ have 、カッエ・、@ to export promotion and the
success they have achieved. The ウ」ッョ、@ half of this chapter イ・カ■キウ@ the evolution of exportpush policies in 。」ィ@ of エィ@ HPAEs.
Pragmatic Ol1hodoxy in Macroeconomic
Management
T H E HP ES WER MORE
カャッーゥョァ@
economîes in keepîng publîc dencits within the lìmítssccH
THANmostot
the economy could absorb; as a result,
エィケ@ were better able to restraìn Înflatìon and manage both ìnternal and ・クエュ。ャ、「エN@ Low in- flation and managC'dble debt ìn turn facilitated realìstÎc ク」ィ。ョァ・@ ratesand エィ@ 。カッゥ、。ョ」@ ッヲエィ@ appreciatìon that ・ャウ・キィイ・@ undermined クーッイエ@
performance. Gィ ・ョ@ the macroeconomy did go awry, usually due to ex- ternal shocks, ァッカ・イョュョエウ@ quickly implemented orthodox solutions,
イ、オ」ゥョァエィ@ nscal dencìt and, when necessary, 、・ オ。エゥョァ@ the currency.
1n contrast
,
ュ。ョ ッエィイ@ 、・カャッー↓ョァ@ 」ッョッュゥウ@ ィ。カ@ been Qウウ@ ウオ」ウウヲオャ@in keeping 、ョ」ゥエウ@ within bounds and have therefore had more エイッオ「ャ@
managing inflatìon
,
debt,
and ・ク」ィ。ョァ@ rates‘ As a イウオャエ @ policymakersin エィウ・@ 」ッョッュ↓・ウ@ ィ。カ@ often had less room to maneuver when con-
fronted with a macroeconomic shock; perhaps partly because of this, theìr response has ッヲエョ@ been hesitant and ìneffectÎve. The HPAEs
ュ。Zイッ・」ッョッュ ャc@ ュ。ョ。ァュ・ョエ@ superior Îs reflected in less ウ・vゥイ・@ imbal-
。ョ」ウ@ and generally ャッキイ@ カ。ョ。ョ」@ in key ìndicators, indudìng real ex-
change rates
,
real interest イ。エウ @ and inflarÎon.To be sure, macroeconomic condítions vary キゥ、ャケ@ among the HPAEs. Malaysia and Singapore have longrun ÎnflarÎon rates comparable to
sキᅩエコイャ。ョ、Gウ @ at 「ャッキTーイ」・ョエ @ while inflation in 1ndonesia and kッイ。@
ta ・クc、ウエィ@ South Asian 。カイ。ァ@ of around 8 ー・イ・ョエN@ Singapore has con- 1m sistently avoided fìscal defìcits
,
while Malaysía’s fìscal defìcit peaked at 1ge @ 18 percent of GDP in 1982. Hong Kong, Singapore, and Q ゥキ。ョ @ China,'nj@ do not borrow abroad
,
キィゥj@ Korea was the world’'s fourth biggest debtor in 1980 and lndonesiàs foreign debt tripled duríng the 1980s.ュ@ eクィ。ョァ@ イ。エ@ regimes have カ。イゥ、@ from rìgìd!y ヲ↓ク、@ to managed f1 oats.
m1 Amid the diversity, ィッキカ・イ @ are some ュュッョ@ themes. wィ ■ャ@ ウッュ@
wC
governments ィ。カ@ run substantìal deficits, none has ヲ↓ョ。ョ」、。、ヲ↓」↓エ@ ín
”r
。ュ。ョョイ@ that 、ウエ。「 ↓Qゥ コ・、@ エィ@ 」ッョッュケN@ The Qカ・ャ@ of エィ@ defici t that is
Q@ affordable, and hence not 、ウエ。「ゥャゥコゥョァ @ is specific to each 」ッョッョイ ケN@ It ìs
ャ@ general1y larger the faster エィ@ rate of growth and the ャ。イァイ@ エィ@ pool of private savìngs (both at home and abroad) relative to private ゥョカウエュョエN@ 1n both these dìmensìons, エィ@ HPAEs have ー・イヲッイュ、@ better than many
ッヲエィゥイ@ developìngeconomy 」ッオョエイー。イエウ@ during the past thirty years.
Because of this, while ウッュ@ 」ッョッュゥウ@ have had higher inf1 ation than others, ョッョ@ has had to ・ョ、オイ@ the very high, debilitating inf1ation that has troubled other 、カャッーゥョァ@ economies.
The HPAEs 」ィッD@ a variety of macroeconomic policy paths because of
’ 4 、ゥ イョエ@ economic conditìons and preferences. All lay within the :s bounds of prudent stability, and キィ・ョカ・イ@ the macroeconomy appeared o to be in danger of movíng out of control, swifi: actÍon was エ。ォョ@ to イ @ store stability. This was エイオ@ ・カョ@ when me source of macroeconomic
S instability was policìes ゥョエ・ョ、、@ to promote growth in the real economy.
For ・ク。ューャ @ エィ@ heavyand 」ィュゥ」。ャ@ industrÍes drive in Korea, to which
キ@ shall return 「ャッキ @ was modifìed キィョ@ its 。、カイウ・@ impact on エィ@ key indicators of macroeconomic stability, inf1 ation, and エィ@ real クィ。ョァ・@
イ。エ@ 「」。ュ・@ ・クッssャvN@
1n the following ウ」エゥッョ@ we discuss how low defìcits ・ョ。「ャ、@ エィ@
ウオ」」ウウヲオャ@ Asian economies to keep key ュ。」イッ」ッョッュ ᅩ」@ indicators rela-
tively stable, and we contrast their performance with the macro-
」ッョッュゥ」@ instability that plagues many ッエィイ@ developing ・」ッョッュゥウN@
We エィョ@ turn brief1y to four HPAE 」。ウ@ ウエオ、 that il1ustrate the variery of rapid and ・ヲヲ」」エᅪカ・@ イ・ウーッョウウ@ to macroeconomic shocks.
Adhering to Macroeconomic Fundamentals
ln contrast wÎth many omer 、カ・ャッーゥョァ@ economies, キィ・イ@ boom- andbust cycles have 」。オウ、@ wild swings in macroeconomic indicators
,
the HPAEs have been remarkably successful in creating and sustaining
10
7
IRACLE
ュ。」イッ」ッョッュ■」@ stabí\íty. This has 「・ョ@ a poten t ・ョ」ッオイ。ァュ・ョエ@ for
vate savíngs, ゥョカウエュ・ョエ @ exports, and growth, since the private sector could count on relatively constant prices and ゥョエイウイ@ イ。エウ @ hイ・@ We consider the HPAE's successful ュ。ョ。ァュ・ョエ@ of four macroeconomic fun- damentals: budget 、 」ᅫエウ @ inflation, external debt, and exchange rates. Keepìng Budget Deficits Manageab
’
e. tィ@ HPAEs’ blldget defìcits 。イA@ not、イ。ュ。エゥ」。ャャ@ better as a grollp than other developing economies’. But
there are rwo distinctive things about the HPAEs‘ First, they almost
al-
ways kept the 、ヲゥ」ゥエ@ within the limits that could 「@ヲゥョ。ョ」、@ without macroeconomÎc destabilizatÎon‘ s」ッョ、 @ エィ・ウ@ \ímits キ・イ@ ィゥァィイ@ than in other developing economies becallse of the 「ョ・ヲゥ」ゥ。ャ@ ヲ・・、「」ォヲイッュ@
other good policies.
Internationa1 ・クー・イゥ・ョ」@ suggests that the ュ。」イッ」ッョッュャ」@ conse- quences of public sector 、ヲゥ」ゥエウ@ depend on how they are financed.2 Ex-
」ウウゥカ・@ monetary financing of deficits Q。、ウ@ to inflationj heavy
government domestÌc borrowing drives up ゥョエイ・ウエ@ rates and crowds our
ーイゥカ。エ@ borrowing; large externa1 financing of エィ@ 、ヲ↓」ゥエ@ Q。、ウ@ to debt
crises. The HPAEs ォーエ@ each エケー@ of financing within bounds, avoiding the corresponding macroeconomic disease‘
tィ・ュ。ョウ@ for restraining 、ヲ↓」ゥエ@ financing ィ。カ@ varied キゥ、ャケN@ Some
ァッカ・イョュョエウ@ ウエ。「ャゥウィ・、@ institutiona1 watchdogs, such as the cllrrency
board in Singapore. Others took rule-based approaches, sllch as ln- donesia’'s 「 。Q 。ョ」、@ blldget law and Thailand’s ・ク」ィ。ョァ@ rate manage- ment framework, which llntil the early 1980s イ・ウュ「ャ・、@ a gold standard‘ Still others イャゥ・、@ on the discretion of economic policymakers
,
as ・カゥ、・ョ」、@ by the ュ。」イッ」ッョッュゥ」@ adjustment ーイッ」ウウ@ in Korea and
Ma1aysia.
Table 3.1 shows consolidated public sector 、ヲゥ」ゥエウ@ for the 1980s for three HPAEs for which there are good data compared with a sample of OECD and 、vャッーゥョァ@ ・」ッョッュゥウN@ As a ー・・ョエ。ァ@ of gdp ⦅ ¢ウ@ bud-
get Q ・イ・ ・ャッキ@ even the P ,:"era.g e‘ Thîs helps ・クーャ。■ @
Korea was able to ォ・・ーᅪョヲャ。 ᅪZ ■ッョ イョ 。i@ borrowíng, and ínterest rates within bounds‘ Malaysîa and Thai!and 。イ@ more 」ッューャゥ」。エ、N@ Thai- land’'s budget 、ヲゥ」■エウ@ were about average for 、・カャッーゥョァ@ 」ッョッュャ・ウ@ m the 1980s, キィゥャ@ Malaysia’'$ were substanrially bigger than average. Both ran bigger budget deftcíts than such troubled economÎes as i\rgentina
,
Brazìl,
Mexico,
and the pィゥャゥーーゥョウN@ Unlik108
Table 3.1 Consolidated Public Sector Deficits
,
Selected East Asianrl and Other Economies
or a ・イ。ァ・@ publír: r。 ョォ。セ ッョァTP
カ@ エォヲゥ」ゥゥ @ percentage developíng countríes
e 」ッ ッュケャイ o@ ofGDP, 1980-88
'"
highest ヲZ ■エIn
S. HPAEs
%
:>t Korea, Rep. of 1.89 6
Malaysia 10.80
lt Thailand 5.80
Average, 40 、・カ・ャッーゥN ァ@ @
lt ・」ッョッセ j・ s@ 6.39
n
Average, OECD economies 2.82 n
Other economies
*
-
Argentina 9‘ 62Brazil 4.02
mクゥ」ッ@ 6‘ 73
Phílippines 4.30
A」イーエヲイイォce・ヲfイイイイェォfpfオイイエゥョ・M
E • First
,
rhere was fledback from high ァイッ エィN@ sゥョ」@ growth was higher in Malaysia and Thailand than in QUU@ succウUヲオャ@ economies, a Vhigher 「オ、ァエ、ヲゥ」ゥエ@ could be financed. Because high growth in-
ゥ[イ creases the demand for financial assets
,
Malaysia and Thailandャイ_イイヲ@
1‘-
M@@
y
tt Source: Easterly, r イゥァオ・コ @and SchmidtHebbel (forthcoming)‘ .t
g
were able to absorb higher levels of ュッョエ。イケ@ ヲゥョ。ョゥョァ@ without a rapid イゥウ@ in inflation. mッイッカ・イ @ their rapid GDP growth raised the level of sustaÍnable 、ッュウエゥ@ and ・クエイョ。ャ@ borrowing (an 」ッョッュケ@
can borrow more for a given debt to GDP ratÌo when GDP is rising rapidly)‘ 1n contrast, many Latin American 」ッョッュゥ・ウ@ fell into a viciollS 」ケ」ャ@ of low growth and llnsustainable deficits ‘
• Second, there was fledback from hígh ヲゥ 」ゥ。ャ@ savings. Savings
イ。エウ@ were high in Malaysia and Thailand
,
and much of this sav-mgs キ\ ョエ@ into the domestic financial Uケsエュ@ (as opposed to real as-
sets or capital flight as in LatÌn America) 、オ@ to the prosavings financial ーッ↓ゥ」ゥウ、ウ」イゥ「、@ in chapter
5
‘ This further increased the demand for money and other 、ッュウエゥ」@ financial 。ウウエウ @ making increased domestic financing of the 、ヲゥ」ゥエ@ possible without イᆳ sorting to inflationary financing‘ 1n Malaysia,
エィ@ government’sProvident Fund ュッ「ゥャゥコ、、ッュウエゥ」@ savings for エィ@ government’s use in ョッョゥョヲャ。 エᅩ ッョ。イ@ financing of エィ@ 、ヲゥ」ゥエ @
10
9
MIRACLE
Table 3.2 Inf
’
ation Rates AverageCPI, ECQnomylregion 1961-91
HPAli 7.5
Hong Kongb 8.8 lndonesiac 12.4
Korea, Rep. of 12.2
Malaysia 3.4
Sîngapore 3‘ G Taîwan, China 6.2
Thailand 5.6
All Q M。 、ュ■ @ Gャ・M
ュ」ッ コ・@ economles 61.8
sッ エィ@ aウ ゥ。@ 8.0
s「Ms。ィ。イ。ョa W」。@ 20.0
Latin America and
Caribbean 192.1
a. Averages are unweìghted.
b, 1972-91 only.‘
@ 1969-91 only.
UP イ」・ウZ@ World Bank data; World
Bank (1 992d); Taiwan, China (1992).
• Third
,
エィ・イ@ キイ@ low initial debt ratios.‘ In Thailand,
エィ@ initìa1ャカャッヲクエイョ。ャ@ 、「エ@ (0 GDP was very low. whích meant that exter-
nal fìnancing was 。カ。ゥャ。「ャ@ キィョ@ needed.
b」。オウ・@ of this, the HPAEs have 。カッゥ、、@ the iní1ationinducing bursts
of money 」イ。 エᅫ ッョ@ that affiict ッエィイ@ deveIopíng economies‘ Figure 3‘ l shows money creation as a ratio to GDP ín kッイ。 @ Malaysia
,
and Thaíland and in エィイN・@ unstable compara(OrsArgentina, mクゥ」ッ @ and z。ゥイ N@@ The contrast is striking: whìle money creation has 「・ョ@ イ ャ。エゥカ・ャケ@ constant among エィ@ HPAEs, each of エィ@ comparators クーョョ」、@ two ーゥウッ、・ウ@ of rapid money 」イ。エゥッョ@ when nscal balances 、・エイゥッイ。エ・、@ or クエ・イョ。ャ@ 6- nancing dried up. The impact on inflation has 「ョ@ equally dramatic.Maintaining Moderate to Low iョヲャ。 ッョN@ Unlîke many Latin Arnerican economies, エィ@ HPAEs ォーエ@ inflation from spinnÎng out of control. Table 3.2 shows エィ@ low inf1atìon in Malaysia, Singapore, Thailand, and Tai- wan, China. Indonesia and Korea ィ。カゥ@ ィゥァィイ@ inHatíon but still far
「ャッキ@ Latin aュ イゥ」。N@ International クー・ョョ」@ ウオァァウエウ@ inflatÍon below
20 pイ」ョエ @ a leve\ not 「イ・。」ィ、@ by any of エィ@ HPAEs during their rapid
growth ーイゥッ、ウ @ can be maintaíned for long periods without ァNョ・イ。エゥョァ@
macroeconomic ゥョウエ。「ゥャゥ@ (Dornbusch and fゥウ」ィイ@ 1993). Low infla- tion Ís a corollary of fìscal ーイオ、・ョ」Z@ East Asian governments never had to イャケ@ heavily on エィ@ ínflation tax 「・」。オウ@ their defìcits were within fì-
ョ。ョ」・。「ャ@ lìmits.
Several East Asian governments have made formal commÎtments to low inf1 ation that constrained エィゥイ@ oprions for acrivism. Historically,
エィ@ most ímportant of エィ・ウ@ was エィ@ 」ッュュゥエュョエ@ to a ヲ ャx 、@ exchange
イ。エ[@ ィッキカ・イ @ all but Hong Kong have ウ■ョ」@ 。「。ョ、ッョ、@ this mecha-
nÎsm. Other selfimposed constraints on fìscal policies and borrowing, induding 「。ャ。ョ」、「オ、ァエ@ laws and various institutional checks. remain in place and ィ。カ@ generally contributed to fìscal discípline and low Ín- flation ‘ HG|サ@ discuss エィ・ウ@ in chapter 4.) 1n general, HPAE ァッカ・イョイョョエウ
have been strong enough to alter public spending and foreîgn borrow- ing as needed, although in Thailand this has 「・ョ@ a continuous struggle (Warr and Nadhiprabha 1993).
Reasons for エィ@ commitment to low inf1atÍon vary キゥ、ャケ@ but are rooted in the recent economic history of each of the HPAEs. ln lndonesia and Taiwan
,
Chìna (and to a lesser extent Korea),
aversion to inf1atÎon grew out of traumatic ゥョヲャ。エ↓ッョ。イ@ ウーャイ ウ@ that accompanied economic and political crises. In Malaysia and Singapore, the success of colonialera fìscal 」ッョウョ ᅫウュ@ seems to@
Figure 3.1 Revenues from Money Creation as a Percentage of GDP: Ú'ampfes from Ea
st
Asia and Other Selected EconomiesHー・ ・ョエI@
rS 14
12
’
ayslaIl
‘
MaTha’
landRep. 01 Korea
10
8
FLl 6
4
2
o
2
1970 1972 1974 1976 1978 1980 1982 1984 1986 1988
14
Zalre
12 Argentina Mex
‘
co10
g
6
4
2
o
-2
1970 .1972 1974 1976 1978 1980 1982 1984 1986
Note: Revenues from money crearion as a percenrage of GDP Ís defìned as ratÍo of nominal change irr ィゥァャーッキ・イ・、@ money to nominal GDP
Soz‘’‘ce: \X1orld Bank 、。エG@
Thailand, エィ@ traditioll of responsible fisca1 policies dates fìorn エィ@ mne-‘
エ・ョエィ」ョエ uQ ケ @ キィョ@ a strong 」オイイョ」ケ@ helped エィ@ kingdorn イエ。ゥョ@ its in•
、ー・ョ、ョ」・N@ 1n Hong Kong, colonìaJ イオャ@ has insulated エィ@ ァッカ・イョイョョエ@
frorn 、ュ。ョ、ウ@ for ゥョイ・。ウ、@ government spending‘
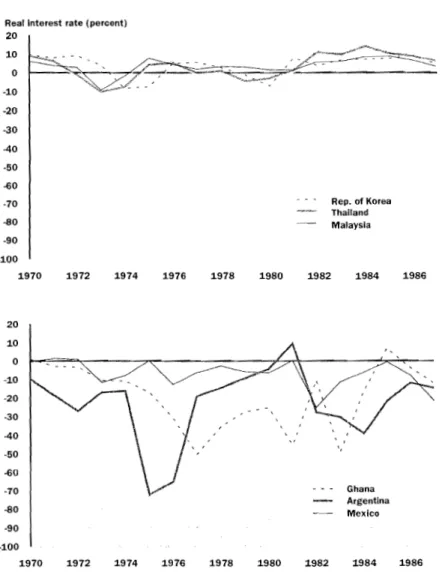
One result of low to moderate inflation rates particularly welcome to busìness ìs stable rea1 interest イ。エウN@ fゥァオイ@ 3.2 shows rea1 interest rates in
III
AN M rR ACLE
Korea, Malaysia, and Thailand, compared with aイ ァョエゥョ。 @ Ghana, and
mクゥ」ッN@ As wÎth money creation, the contrast ís イ・ュ。イォ。「ャN@ 1n the East
Asian 」。ウウ @ low inf1 afÎon and fJ exible ヲゥョ。ョゥ。ャ@ polícies kept real ゥョエイウエ@ rates within a narrow range. For エィ@ comparators, the cornbination of nominal Înterest rate conrrols with hìgh and unstable inflation was 、。、ャケZ@ wild gyrations in real interest rates created severe uncertaìnty for ᅫョカウエッイウ @
Figure 3.2 Reallnterest Rates: Examples from East Asia and Other Selected Economies
Rea
’
Interest rate (peroent)0 -10 -20
40 -50
VP@
Rep. of Korea Thailand
P@ Malaysla
-70
-90 20 10
30
-100
@J@
1970 1972 1974 1976 1978 1980 1982 1984 1986
2 o
i o o o
j‘
o
3 o
4 o
3 o o
7,o Ghana
o Argentina
Mexico -90
-100
1970 1972 1974 1976 1978 1980 1982 1984 1986
Note‘ Real imerest イ。エウ@ 。イ@ 、ヲ↓ョ、@ as the deposit rate def!ated by the consumer prìce ᅪョ、ク@
UPQQG イ \XTorld Bank data
II2
@
Keeping Extemal Debt under Control. Of the seven developing HPAEs
,
only Indonesia, Korea, Malaysia, and Thai1and have public or ーオ「ャゥャケ@ guar- anteed foreign debt. The governments of the othersHong Kong, Sin- gapore, and Taîwan, Chînahave not borrowed abroad‘ None of the four wìth foreign debt has faced a crÌsîs, in the sense of having to reschedule debt; but sharp increases in debt have led to rapid adjust- ment. In some economìes during some periodsfor example,
Korea in 198085, Malaysìa in 198288, and lndonesia since QYXWセ M、 ・「エMgnp@ratios have been quite high compared with other ゥョ、・「エ、@ 」ッョッュゥ・ウ@
Hウ・@ table 3.3). As with fìscal defìcits, however, favorable ヲ・・、「。ォ@ from other policies enabled the HPAE debtors to sustaîn hîgher external debt to GDP than other economies‘ High levels ッヲクーッイエウ@ meant that foreign exchange was readily 。カ。↓ャ。「ャ@ to service the foreign debt. Similarly, high growth implied that returns on borrowed capital were sufficient to pay the interest.
Korea’
s
successfUl handling of a very hìgh foreign debt ゥャャオウエイ。エウ@these trends‘ Beginning in the ear1y 1970s, Korea 「ッイイッキ、@ heavily to fì- nance private sector investment and buí1d up foreign ク」ィ。ョァ・@ イ・ウ・イカウ @
By 1984 kッイ。 Gウ@ ヲッイ○ァョ@ 、「エ@ was fourth largest in the world; by 1985 it
・アオ。ャ、@ more than half its GNP. Yet because of its high exportGNP ratio
and rapid overall growth, Korea never lost 」イ、ゥエキッイエィゥョ・ウウN@ From 1986
the ァッカ・イョュョエ@ ーオイウオ、@ an 。」エゥカ@ 、・「エMイ、オ」エゥッョ@ policy, drawîng on
Table 3.3 Intemationallndebtedness
Ratío 01 total Ratio oj‘ total debt to exported debtto GNP and services
//
·m
% ? r”
Peak year" 1991 Peakyeal'4 1991
‘ “
@
mM` 。`@
M@
i}
2
‘
Mᄋ VYN @ 66.4 263.5 225.6
K
@
142 4
52.5 15.0 45 2
, fゥ@ ‘ ‘
@
‘‘ 86.5 47.6 138.4 54
‘ 2 U m
,
47.8 39‘ 0 171.7 94‘ 8
m ュE
a. 1987 for lndonesìa, a.nd 1985 or 1986 for the ûmer mree countrÌes. Source: World Ba.nk data‘
@
% Nュᄋ %
m
38.4 176.2
29.6 293.3
@
106.1 340‘ 8
y 37‘ 4 268‘ 0
II3
…:…
EAST AsrAN MIRACLE@t @ (or ↓ョ。、ᆳ
@
Înternationa1 ァGョ・イ。エ、
burgeoning reserves by exports to make pay-
ウィ・、オャ・[
ahead of by 1990 the debr-GNP ratío was down 14
ments to
ー・イ」ョエN@ (In contrast, when Mexicofaced severe problems with its cred-
Îtors in 1982 ìt had a much , コ G・イ@ debt toGNP ratio than Korea in 1984
ィゥァィ・イ、 「エ
but much a to exportratio.)
Exchange Rate in Une. The HPAEs avoided the severe appreci-
・・ーゥョァ ャ・@
.4 Am
ation that 「ウ・エ@ Sub-Saharan Mrica and Latìn erica {see エ。「ャ@ 3 ).1n As such economies Bolivia and Ghana エィ East ian
contrast to as
,
c1 ァゥカAョ
economies did not ing to a nominal exchange イ。エ @ f1 of nominal in the face of continuing in ation
イ。エ@ 、・ーイA」ゥ。エゥッョI
quate
、ーイ」ᅫ。エ、@ ョ」ウウ。イケ ウッュ・エゥュウ
but when @ quite sharply. Fiscal pru-
dence ーイカョエ・、@ the excessive demand ーイウウオイ・ウ@ that 。ーーイG」ゥ。エ・、@ エィ@ real
’
exchange rate in such economies as cエ・ d Ivoire and Nigeria.
evolutÎon of in the HPAEs has been broadly
tィ@ ・ク」ィ。ョァ@ イ・ァャュウrate
similar. Hong Kong Malaysia and Singapore pegged their currencies to , ,
BritÎsh
the pound during the Bretton Woods period, エィョ@ ヲQ P。エ、 them U. in 1973 or 1974. The Taiwan China dollar was , , ーァァ・、@ tothe S. dol-
.4
Table 3 Average Appreciatìon Index 1976-85
,
Ecollomy
@
oャ・。ウHongKong 64 14
i@ % ’ a
t% Percentage rank
’m a“‘ m ra
(100 means most
m j@
HPAEs
lndonesia 98 24 Q
Korea, Rep. of 110
l 7 ll
Malaysia 88 •
l ll
Singapore 87 4
Taiwan, China 116 7/
Thailand 75 r1-
Other ウ・ャ・ ・、@ economies
Argentina 113 45
Bolivia 181 89
cエ@ d'lvoire 185 90
Ghana 248 99
Nígeria 277 100
Zaire 201 95
a. DolIat‘s ìndex is based on Summers-Heston purchasing power patiry (ppp) compar isons. An index value of 100 signifies that the economy's QZカェ。エゥッョ@ from PPP js where it shou1d be, given jts per capita income‘
Source: Dollar (1 992).
lar from 1960 to 1973, then appreciated twÌce, and was f1 0ated ìn 1979‘
1/ Thaìland had the ャッョァG ウエ@ ヲ↓ク、@ rate イァ↓ュ・Z@ the baht was fìxed to the dol- lar durìng 1954-84, with a sìngle small 、カ。ャオ。エ↓ッョ@ in 1981. In 1984 t/ the baht was 、カ。ャオ・、@ and f10ated as part of an adjustment program. ln-
donesìa ヲゥク、@ エィ@ rupiah to the U.S. dollar from 1971 to 1978. b・」。オウ@ ìnflation was higher in Indonesia than the United States
,
エィ@ rupiah ap- preciated vÎsàvÌs エィ@ doUar, ョ」・ウウゥエ。エ↓ョァ@ major devaluations ìn 1978(51 ー・イ」ョエI @ 1983 (38 percent), and 1986 (45 percent), after which In-
donesìa shifted to a managed float. Korea, too, エイᅩ、@ to エゥ@ Îts currency to the dollar but resorted to four major devalllations 「エキ・ョ@ 1961 and エィ@ start of a ュ。ョ。ァ、@ f10at in 1980‘
Most moved from longterm fixed rate イ・ァゥュウ @ to fìxedbut-
。、ェャャウエ。「ャ@ rate regimes with occasional steep devaluations, to managed
f10ating イ。エ@ イァゥュ・ウN@ Hong Kong, the ウゥョァャ@ exception, reintroduced a fixed (linked) rate regime in 1983 in the ヲ。」@ of fierce speculation against エィ@ currency prompted 「@ politicalllncertainty. Under the man- aged floating イァゥュ・ウ@ that began in the 。イャケ@ 19805
,
polìcymakers no longer set rates but attempt to ᅫョヲャオョ」@ them at the margin, ァョ・イ。ャャケ@to move in parallel to the U.S. dollar.‘ b」。ャャウ・@ the United sエ。エウ@ has 「・ョ@
the イァ ャo ョ ウ@ major export market, maintaining a ウエ。「ャ@ and at times
slighdy undervalued exchange rate visàvÎs the U.S. dollar has assisted exporters.
The HPAEs’ Sllccess at maintainÎng stable ・クィ。ョァ@ rates is apparent ín fìgure 3.3, whìch contrasts エィ@ remarkable stability of real exchange イ。エウ@ ウュ」@ 1970 in kッイ。 @ Malaysia, and Thailand with the ウ・カイ@ ク」ィ。ョァ@ rate instability in aイ ァョエᅩョ。 @ p ヲャャ @ and SrÌ Lanka. aイ ァョエᅩョ。@ イ・ー。エ・、ャケ@
。エエューエ・、@ to use the exchange rate as a nominal anchor against high in-
flatÍon (for ・ク。ューャャ@ in 197374 and 19808 1)‘ Bllt faÌlure to ォー@ other macroeconomic fundamentals in line Q、@ to the ッャャ。ーウ・@ of the real exchange rate and sharp real devaluations. II1 contrast, the East Asian economies’ pragmat1c ュ。」イッZッョッュゥ」@ ュ。ョ。ァュ・ョエ@ enabled エィュ@ to avoíd ウキゥョ of the real exchange rate, even in the ・@ of major クエイョ。ャ@
shocks (see box 3.1).
Responding Quickly to Macroeconomic Shocks
tィ@ hp s @ rapid イ・ウーッョウ@ to macroeconomic shocks has been ァイ 。エャケ@
ヲ。ゥャゥエ。エ・、@ by two 」ィ。イ。iイゥウエゥ」ウN@ First, 「@ lìmiting distortions and
tightly supervising banks, governments イ・、オ」、@ the spillover from the
II5
MIRACLE
Figure 3.3 Examples of Real Exchange Rate v。 。「ゥャゥエケ@ in East Asia and Other Selected Economies
Real exchange rate (percentl 350
300 Rep. of Korea
Malaysla Thalland 250
200
150 100
50
o
1970 1972 1974 1976 1978 1980 1982 1984 1986 1988
350
- - - Argentina
300 - - Mexico
•-
Peru250
200
150
100
50
o
1970 1972 1974 1976 1978 1980 1982 1984 1986 1988 Note: Index of real exchange rate: 1980= 100
,
real depreciation Ís downsッ @
‘
world Bank data.イ。ャウ」エッイ@ into エィ@ fìnancial ウ」エッイ@ that in ッエィイ@ 」ッョッュイ・ウ@ ク。」・イ「。 Zエ ・、@
fìscal woes. Second
,
ヲャ・クゥ「ャ@ labor and capital markets enabled the real sector to react quickly to government initiatives,
ウエエゥョァ@ off new growth」ケ」ャウ@ that ・。ウ、@ エィ@ イ・」・ウウ ャo ョ。イ@ impact of stabilization ュ。ウオイ・ウN@ Thus
エィ@ HPAEs イ」ッカ・イ・、@ quíckly &om macroeconomic shocks‘ Box 3.2 de- scribes rwo more typical developìng 」ッョッュゥ・ウ @ c¬エ@ 、Gャカッゥイ@ andMex-
n6
8o x3.1 Ea st Asia Was a ゥ Lucky
QNE pj[an aョon FOR THE HPAEs’ RELA11VELY RAPID REBOUND
fibtil.eitetna1 shÇlcks is that ャ@ shocks キ・イ@ ウュ。 ャQ・@ イゥイ ョ@ aウ ゥ qNNエZ@ ィ。 ョゥョ@
ッ ャc イ、↑カ、ー@ ゥョァエ・@ F@ セッョ ャ ウN@ According tothîs view, adverse shóck$Jrom
F ョゥイエァ@ terms óf ttade and risîng ゥョエ・イ ウエ@ イ。エGU@ wイ・@ less ウ・カ・エ@ foi
the HPAEs than for other developing economies‘ Put sill1ply, the SUè,- . ce$sfuL
Ea.s
tA!i
ian economies キ・イ @ ャオォケイ。エィイ@ than agile.Biit ・e 。ウN エ@ Asian ョッュゥ @ have been butfeted 「 @ s ᆳ
エイ Q@ ウィッ」ォウエセエ@ hît other OZQァゥ ャQsN@ As oíl importers,Kórea,Thallånd,
and, T Q.Íwan, Chlp.a, fucedsharp declines in their termsof trndedl.lring thepil ptic;e tisé shocks of 1974-75anq19S0-8 L Indqnesia atld
m£ャ。ケウゥ。 @ 「ゥョァ@ oil exporters, bene6ted fÌom the oil priçe rÎses but
faced 5evere adverse shocks in 1986 due tosagging 011 and conìmodity prices and rising Înterest rates. Oil price hikes had litde direct impact on Hong Kcmg and Singapore,which depend primarily on manufa.c- tured exports, but both suffered fÌom the ensuing world recessions.
Available data indicate that while the 5hocks to East Asian
・ッョッュゥ・ウ@ were ウッュ イゥュウ@ smaller than shocks to other developing
economies, more often エィ イwiイ・@ about @ same or larger.For ex-
。ューャ @ a 1993 World Bank study of eighteen ・」ッョッュゥウ@ rhat イ ャォ・、@ external shocks as a ーイッーッゥッョ@ of GDP found that the 1974-75 shocks for Korea and Thailand (the two HPAEs it studied) were smaller than those faced by Chìle, Costa Rìca, Pakistan, and three SubSaha- ran Mrican economíes; abollt the same as for Brazil andSri Lmka; and greater than those fuced by aイ ァョエゥョ。 @ Colombia, lndia, m・ャco @
and tオイォケ @ For 1979-81 , the study found that the 。、カイウ@ shock
from terms of trade deterioration and rising ゥョエ・イウエ@ rates was about 6
ー・イョエ@ of GDP for kッイ。@ and Thailand. This was less than for cィゥャ @
Cðted’Ivoire, and Sri Lanka; a ャゥエエャ@ more than for Brazil (5 percent);
。ョ、ュオ」ィュッイ than for all エィ@ ッエィ・@ norably Argentina (2 percent)
and India HャUU@ than 1 ーイ」・ョエIN@
Source; lゥオャ@ and others
,
forthcoming.1CO‘ that ヲ。ゥャ、@ to take エゥュャケ@ action in response to such shocks and suf-
ヲイ、@ from prolonged recessÍons and uncertainty as a result‘
Some observers have argued that East Asia has 「・ョ@ lucky rather than agile. |@ ・ク。ュャョ@ this argument in box 3.1 and find that the
エイュウ@ of‘ イイ。、@ for the East Asian economies ィ。カ@ been at Q。ウエ@ as オョヲ。セ@
カッイ。「ャ@ as those facing other 、カ・ャッーゥョァ@ economies‘ Below we exam
QQQ@ four cases in whìch the HPAEs イウーッョ、・、@ ウオ」」 ウウヲオャャケ@ to a variety of
ュ。」イッ」ッョッュゥ」@ shocks: lndonesìa, kッイ。 @ Singapore, and Thailand.
U7
ャQ racle@
Bo x3.2
ャ・@High Co st of
d・ ケ@in Mexico and Côte
、 iカ iG│@WHAT IF THE SUCCE.SSFUL EAST ASIAN ECONOMIES 。 ッヲヲ・・@ ウッ。イ Z、N@ Some of the investment w‘as ofdii- had fuiled to
de
aI quickly with ュ。」イッ・ ョッュゥ」@ dis1o- biöÍlS economic vaIue, like the expaP$ion ofthéshow-
c:atiqns? The experiènce of nations that responded to case city of Yamassoukro. PubHc investmèrii: external shocks inadequately suggests that deiays can イ・ュ。ゥョ、@ high even ・イ@ 」ッヲヲゥ・@ and cocoa prices co1-
「・カ・イ@ coscly indeed. ’rhese problems have béen par- lapsed‘ The resulting huge de6cits led to heavyextet-
tícular1y severe in Latin America and Sub-Saharan na1 borrowing, a full-blown debt crisis, rea1 exchange Africa, as the ウ・ウ@ of MexÎco and CÔte d’Ivoire rate 。ーー↓。エゥッョ @ and the 」ッャャ。ーウ@ of investmentand
i1lustrate. growth. CÔte d’Ivoìre,which had bêen a sオ「セs。ィ。イ。ョ@
Flush with cash from エィ@ 1979 oil boom, Mexico African success story, entered into a vicious tyclè of ìncreased public spending sharply, then fai\ed to cut unsustainable budget defìcits, fui1ed adjusrment at- back when oil revenues ヲゥQQN@ By early'‘ 1981 the need tempts, and shrinking per capira GDP from which Ìt for currency deva1 uation was obvious. While the gov- has yet to emerge.
イョュ・ョエ@ hesitated, investors キッイイゥ、@ about the com- The contrast between the experiences of Mexico
ゥョァ、カ。ャオ。エゥッョ@ and pulled $20 billion to $30 bìllion and CÔte d’Ivoire and that of the HPAEs shows how
out of the economy. l• acking ヲッイゥァョ@ exchange to valuable a reputation for macroeconomic stability is make regular payments on its foreign debt, mxico@ and how costly it is to lose it. Some HPAEs got away instituted capital controls and nationalized the banks with brief episodes of mismanagement because they
in ャ。エG@ 1982, exacerbating the crisÌs. Fiscal adjust- had a well-earned イ・ーオエ。 ッョ@ for prudence and be-
ment in the mid-1980s was strong but erratic and cause they 」ッイイ・」エ、@ the' mismanagement quìckly. failed to tame inf1 atÎon or restore busÎness con6- Mexico and CÔte d’Ivoire lastingly 、。ュ。ァ、@ theìr dcnce. Only in the late 1980s and early 1990s did a repuration by not correcting エィ@ macroeconomìc im-
ヲオイエィイ@ stabilization program fìna1ly take hold and ba1ances in the late 19705 and early 19805 quickly
bring down inflatíon. ョッオァィN@ The differences between success and failure Problems have been similar in Côte d'Ivoire, can turn on a couple of years’ delay ìn adjustment; in
キィゥィ@ embarked on a huge public investment pro- Mexico, two “ lost years" of adjustment resulted in a
gram in the mid-1970s when world prices of cocoa “lost decade" of growth.
Declining Oil pi 」・ウ@ in Indonesia. From 1982 to 1986
,
lndonesia c、@rapidly worsening terms of エイ。、@ caused ーイゥュ。イゥャ@ by 、、○ョゥョァ@ oil prices. Starting in 1983, エィ@ ァッカ・イョュョエ@ responded wìth a remarkably comprehensíve and successful adjustment program. lt 、・カ。ャオ、@ エィ@ ru- piah in 1983 and 1986 and cut expendìtures, mainly by イウ」ィ・、オャ↓ョァ@
」。ーゥエ 。Q Mゥョエョsi・@ ーイッj」エウ @ The need to reduce a オイイ・ョエ@ account 、ヲ↓」ゥエ@
without creating a イ」・ウウゥッョ@ was straightforward; the orthodox solutions キ・イ@ effectÎve.
aュ。ウオイ・@ of the achievement ッュ@ 1985 Îs illustrated by the follow-
ing calculation (from lゥエ、@ and others, fDrthcoming). The excess of imports of goods and nonfactor services over non-oil クーッイエウ@ fell from n8
15 percent of GDP in 1984 to 7 ーイ」・ョエ@ in 1988. This shift of 8 percent ofGDP measures the クエ・ョエ@ by whích absorption had to be イ・、オ」・、Mエィ@
イウ@ of ゥョ」ョ Gjsゥ、@
principal
ヲ ー。ケュ・ュウ@ of long-rerm debt,
ィゥァィイ@ m-rerest payments, and reduced income from oil and gas imports. This
ュ 。U ウ↓カ@ reSOUfce shìfr, also associated with エイ。、@ liberalízation, was
brought aboUt wìthout ゥョ」イ・。ウ、@ ínflatÎon.
Adjustment was not ー。↓ョャ ウウN@ Growth initially fell due to lower ex- port Íncomes and a tÍght 1983 budget; by 1985 the economy had slípped Ínto a recession, wÍth only 1 percent gwwth. Even 50 the gov- ernment pushed ahead wÍth the 。 オウエュョエ@ process, which actually ac-
」ャイ。エ・、@ ìn 1986. In the later half of エィ@ 19805, pイウ・カ イ。ョ」・@ paid off Ín
a boom of manufactured exports that pushed the export growth rate to 25 percent a year for エィ@ períod 1985• 9 L Since then lndonesia has chalked up average annual growth of about 7.1 percent.
Responding to Macroeconomic Crisis in ッイ・。N@ In 1979
,
Korea ・ョ」ッオョエイ・、@a カ。ョイケ@ of problems that エィイ。エ・ョ・、@ to undercut エィ@ 1970s’ ャューイssャカ・@
growth. Risìng oìl ーイゥ」 Zウ@ 「。エエ・イ、@ Korea’S エイュウ@ of trade, the world re- cession dampened export demand, and high ゥョエイウエ@ rates boosted debt
sイカゥ」・@ costs‘ kッイ。@ was not オョゥアオ@ in these troubles, of course; these
were the same woes that led to debt 」イゥウウ@ in many economies outside of East Asìa‘
kッイ。@ had plenry of specifìc problems 「・ウ↓、ウN@ r。ャ@ appreciation dur-
Íng the 1974--79 ・、@ exchange rate イァ↓ュ・@ had ュ。、@ exports less com- petitive, the イゥ」@ crop had ヲ。ゥャ、 @ and the assassinatÍon of‘ pイウ↓、ョエ@ Park
cィオョァMh・@ had ク。」・イ「。エ・、@ political uncertaÍnty (Collins and Park
1989)‘
kッイ。@ had a few structural advantages, however. UnlÍke economies
that quìckly fell ìnto debt crises, Korea was not running large and grow- ing budget defìcits‘ And while private savings had dropped due to de- dining output and incomes
,
investment remained high. More important, kッイ。@ イウーッョ、、@ quickly to its troubles with an aggressÍve January 1980 stabìlÍzation package 「。」ォ、@ by IMF standby credits. tィ@government ・ョ、、@ エィ@ fìxed 」ィ。ョァ・@ rate イァゥュ・ @ devalued the won by
17 pイ」ョエ @ and エゥァィエ・ョ、@ monetary and fìscal policy.
ThÍngs got worse before エィケ@ got better.‘ 1n 1980, output fell 5 ーイᆳ cent, inflation soared to more than 25 percem, and the current account deficit 。ーーイッ。」ィ、Yーイ」・ョエ@ ofGDP, tィ strong ュ・、ゥ」ゥョ@ was partly re- sponsible for t
II9
RACLE
‘ i
the drop in output. Even so, and 、ウーゥエ@ polîrical ッオイイ■・ウ@ over Korea’s rising foreign debt, ìt continued foreign borrowing throughouc the cri- sis, thus maintaining hìgh investment levels‘
Within rwo years, the medicine had begun to take the desired effect. 1n 1982 inf1ation dropped to 7 ーイョイ@ and in 1983 (0 3.4 percent‘ The
」オイイョエ@ account 、・ヲ↓ゥエ@ fell to 2 percent of GDP in 1983. Overall
,
theァッカ・イョュョエ Gウ@ prompt and effective response to a potential crisis
ウヲイ ョァエィ・ョ・、@ the economy, ーイー。イゥョァ@ it for rapid growth in the 1980s.
Adjusting to Oil Shocks in Thailand. Thailand only partially adjusted to the first oil shock and in the ャ。エ@ 19705 ョァ。ァ・、@ in a mild private and public spending boom‘ Then came the second oìl ウィッォ@ and エィ@ rise in world ゥョエイウエ@ rates‘ By 1980-8] , the 」ッョウッャゥ、。エ、@ public sector 、ヲ↓」ゥエ@ was 7 ー・イョエ@ of GDP, ョ。イャケ@ half of which was the defìcit of nonfìnan- cial public enterprises. The current account 、ヲ↓」ゥエ@ was also about 7 per- cent. Because ヲッイ↓ァョ@ borrowìng had been ュッ、イ。エMエィ・@ 、「エMgdp@
ratio was only 35 percenr in 1982-Thailand was not facìng a debt cri- sis and continued to borrow. Even so, エィ@ ョキ@ government that took over in 1980 ーイ」・ゥカ・、@ that ュ。イッ・」ッョッュゥ」@ adjustmenr was needed. Monetary policy optìons were limited by エィ@ frxed exchange rate and the relatively open capital ュ。イォNエ @ The government therefore took エィ@ alter- native path, fìscal contraction, moving gradually but consistendy durìng the next several years to cut expenditures and boost revenues.
pッャ↓」ケュ。ォイウ@ steeply cut defìcìts of the nonfìnancial publíc enter-
prises, then gradually reduced the central government defìcit. As a re-
sult, the 」ッョウッャゥ、。エ、@ ァッカ イョュョエ@ defìcit declíned from 8 percent of
GDP in 1981 セXR@ to 1.6 percent in QYXVセXW @ when 。 オウエュ・ョエ@ was es- sentìally complete, Meanwhile, steeper tax イ。エウ@ and エッオァィイ@ collection
ヲヲッイエウ@ boosted 」ョエイ。ャ@ ァッカ・イョュョエ@ tax revenue from 13 ーイ」ョエ@ of GDP
in 1982 to 16 percent in 1988 The adjustment ‘ ーイッ・ウウ@ was facílitated by a 1984 devaluation‘
Thai gradualism was possible because foreign borrowìng had 「・ョ@
moderate and the economy did not ・エ@ face a crisis. But gradualìsm was not hesitancy; conservatíve fìscal policies were consÎstent and were sus-
エ。ュ、@ into the late 1980s amid an クーッイエ@ and foreìgn investment boom.
sゥョ」@ 1987• 88 Thaìland has been accumulating foreìgn exchange イᆳ
serves, and the ァッカ・イョュョエ@