F U L L P A P E R
PPS
www.rsc.org/ppsKinetic analysis of the activation of photoactivated adenylyl cyclase
(PAC), a blue-light receptor for photomovements of Euglena†
Shinya Yoshikawa,a,bTakeshi Suzuki,a,bMasakatsu Watanabeb,cand Mineo Iseki*a,b
aPRESTO, Japan Science and Technology Agency, 4-1-8 Honcho, Kawaguchi, Saitama, 332-0012, Japan
bNational Institute for Basic Biology, Okazaki, Aichi, 444-8585, Japan. E-mail: [email protected]; Fax: +81-564-55-7535; Tel: +81-564-55-7535
cDepartment of Photoscience, School of Advanced Sciences, Graduate University for Advanced Studies, Shonan Village, Hayama, Kanagawa, 240-0193, Japan
Received 11th November 2004, Accepted 3rd March 2005 First published as an Advance Article on the web 15th March 2005
Photoactivated adenylyl cyclase (PAC) was first purified from a photosensing organelle (the paraflagellar body) of the unicellular flagellate Euglena gracilis, and is regarded as the photoreceptor for the step-up photophobic response. Here, we report the kinetic properties of photoactivation of PAC and a change in intracellular cAMP levels upon blue light irradiation. Activation of PAC was dependent both on photon fluence rate and duration of irradiation, between which reciprocity held well in the range of 2–50 lmol m−2s−1(total fluence of 1200 lmol m−2). Intermittent
irradiation also caused activation of PAC in a photon fluence-dependent manner irrespective of cycle periods. Wavelength dependency of PAC activation showed prominent peaks in the UV-B/C, UV-A and blue regions of the spectrum. The time course of the changes in intracellular cAMP levels corresponded well with that of the step-up photophobic response. From this and the kinetic properties of PAC photoactivation, we concluded that an increase in intracellular cAMP levels evoked by photoactivation of PAC is a key event of the step-up photophobic response.
Introduction
Euglena gracilis, a unicellular flagellate, shows abrupt changes in its swimming direction in response to a sudden increase or decrease in incident light intensity (i.e. step-up or step- down photophobic responses), resulting in photoavoidance or photo-accumulation, respectively.1,2 It also shows positive and negative phototaxis (movement toward or away from the light source, respectively).3,4 Although these responses have been well known over a century,5,6the responsible photosensor molecules have remained unidentified until recently. In 2002, Iseki et al. purified a novel blue-light receptor flavoprotein, PAC (photoactivated adenylyl cyclase), from a subcellular fraction containing photosensory organelles (the paraflagellar body: PFB or the paraxonemal body: PAB) of Euglena. They showed that PAC acts as a photosensor for the step-up photophobic response.7 In 2003, Ntefidou et al. reported that PAC itself or a molecule that is similar to PAC was also involved in positive and negative phototaxis.4
PAC consists of alpha and beta subunits both having two flavin binding domains F1 and F2, each followed by a catalytic domain of adenylyl cyclase C1 and C2, respectively. The flavin binding domains of PAC are similar to the N-terminal region of the flavoprotein AppA from the purple bacterium Rhodobacter sphaeroides.8Since both PAC and AppA act as photosensors, these flavin binding domains are called BLUF (sensors of blue- light using FAD).9 Recently, blue-light induced red-shift in absorption spectra of several BLUF proteins has been reported, and is regarded as a primary photochemical process of the photosensors.10–12
PAC shows adenylyl cyclase activity that is elevated upon blue light irradiation. Based on this fact, it is natural to think that light activation of PAC leads to an increase in intracellular cAMP levels which induces the step-up photophobic response.
† Presented at the 14th International Congress on Photobiology, at Jungmoon, Jeju Island, South Korea, 10th–15th June 2004.
However, this hypothesis has not yet been proven because in vitro kinetic properties of photoactivation of PAC and actual changes in intracellular cAMP levels upon blue light irradiation have not been determined so far.
In this study, we examined fundamental features of in vitro photoactivation of PAC in terms of photon fluence–response relationships and wavelength dependency, which corresponded well with those of the step-up photophobic response. We also showed the change in intracellular cAMP levels during the step- up photophobic response, which provides experimental evidence that an increase in intracellular cAMP is closely related to the step-up photophobic response.
Materials and methods
Culture conditions
Euglena gracilis strain Z (NIES-48) was grown in a heterotrophic growth medium (0. 14 M KH2PO4, 0.2 M MgSO4·7H20, 2.9 M sodium acetate, 0.1 M potassium citrate, 0.6 g l−1Bacto peptone (Difco, Detroit, MI), 0.4 g l−1 yeast extract (Difco), 1.2 lM vitamin B1, 3.4 pM vitamin B12) under continuous white light illumination (20 lmol m−2s−1) or in darkness at 27◦C.
Isolation of PFBs and purification of PAC
PFBs were isolated as described previously7and stored as pellets at −30 ◦C. The PFB containing pellets were suspended in a lysis buffer (40 mM Tris-HCl pH. 8.0 at 4◦C, 0.2% n-dodecyl- b-D-maltoside, 1 mM dithiothreitol, 0.1 mM phenlylmethyl- sulfonyl fluoride) and sonicated (20 kHz, 5 times 1 s). After removing debris by centrifugation (12 000 g, 10 min, 4 ◦C), PAC was purified from the lysate using liquid chromatography as described previously with a small modification.3 We used Resouce Q (Amersham Biosciences, Freiburg, Germany) as an anion exchange column and Superdex 200 10/300 GL (Amersham Biosciences) as a gel-filtration column. The sample was applied to the anion exchange column equilibrated with
DOI:10.1039/b417212d
This journal is©The Royal Society of Chemistry and Owner Societies 2005 P h o t o c h e m . P h o t o b i o l . S c i . , 2 0 0 5 , 4 , 7 2 7 – 7 3 1 7 2 7
Published on 15 March 2005. Downloaded by Graduate University for Advanced Studies on 13/08/2013 07:26:59.
a start buffer (40 mM Tris-HCl pH 8.0 at 4 ◦C, 0.02% n- dodecyl-b-D-maltoside, 1 mM dithiothreitol), and eluted with a linear gradient of NaCl (0–0.5 M in the start buffer). Forty- one fractions of 0.5 ml each were collected from the eluate. Fluorescence emission spectra of the fractions were measured under 370 nm excitation and the fraction showing the strongest fluorescence at 530 nm was recognized as the peak fraction that contained the largest amounts of PAC. The peak fraction and its adjacent two fractions were combined, concentrated by a centrifugal concentrator device (Biomax-5, Millipore Co., MA, USA) and then applied to the gel-filtration column equilibrated with a gel-filtration buffer (150 mM NaCl in the start buffer). Forty-eight fractions of 0.5 ml each were collected, and a PAC-rich fraction was determined by fluorescence measurement as above and used for the adenylyl cyclase assay. Protein concentrations were determined by the Bradford assay using bovine serum albumin as a standard.
Adenylyl cyclase assay
Measurements of the adenylyl cyclase activities of PAC were done in an assay buffer (50 mM Tris-HCl, pH 7.5, 1 mM dithiothreitol, 1 mM MnCl2, 0.1% bovine serum albumin) containing 100 lM ATP at 27 ◦C under various irradiation conditions. Reactions were started by adding purified PAC into the reaction mixture and were stopped by adding trichloroacetic acid (TCA, final concentration: 5%) at an appropriate time. After removing TCA by partitioning into diethyl ether, cAMP in the reaction mixture was assayed with a BIOTRAK EIA system (Amersham Biosciences). In the experiments which were done under constant irradiation throughout the reaction period (Figs. 1A and 3), activation of PAC was represented as the initial velocity of the reaction (pmol min−1 lg−1) according to a usual definition of enzyme activity. In other experiments which were done under a light/dark regime during the reaction period (Figs. 1B, 1C and 2), such a definition of activity was not applicable because the reaction velocity could drastically change during the reaction period. Therefore, PAC activation in these experiments was represented as the amount of cAMP in the reaction mixture (fmol ml−1).
Light sources
An LED illuminator (MIL-U200 with MIL-B18, SANYO Electric Biomedical Co., Ltd., Tokyo, Japan: peak wavelength, 472 nm; full width at half maximum, 30 nm) was used for in vitro kinetic analyses of PAC activation and for intracellular cAMP measurements. For intermittent irradiation, the LED illumina- tor was controlled by a relay unit (R4-ICH, Data Six Ltd., Kobe, Japan) connected to a personal computer (PCT-2202T, Hitachi Ltd., Tokyo, Japan). The Okazaki Large Spectrograph13 was used to examine the wavelength dependency of PAC activation. Most of the experiments including purification of PAC were done under dim red light (<0.2 lmol m−2s−1) obtained from a fluorescent tube (FL15W, Matsushita Electric Industrial Co. Ltd., Osaka, Japan) covered with an acrylic filter (Acrylite 102, Mitsubishi Rayon Co. Ltd., Tokyo, Japan). Photon fluence rates were measured using a silicon photodiode photometer (RMS101, Rayon Ind. Co. Ltd., Ibaraki, Japan).
Measurement of intracellular cAMP
More than 8 hours prior to each experiment, the dark-grown Euglena cells were harvested by centrifugation (400 g for 5 min at 25◦C) and resuspended in Diehn’s resting medium (4.2 mM Ca(NO3)2, 3.7 mM KH2PO4, 2.1 mM MgSO4)14at a density of 2–4 × 10⁶cells ml−1. A 0.5-ml aliquot of the cell suspensions was transferred to a glass tube and used for a single measurement. Cell suspensions were fixed by adding TCA (final concentration: 5%) at an appropriate time and immediately cooled on ice. After
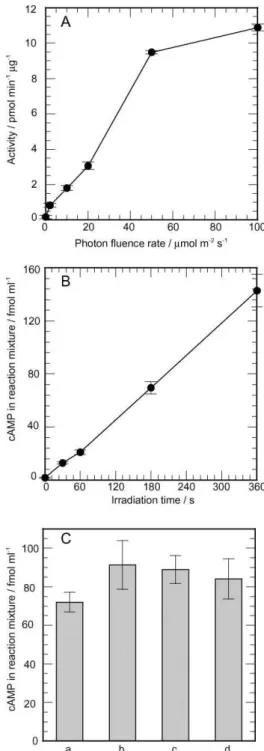
Fig. 1 (A) Photon fluence rate-response curve for PAC activation. The reaction mixtures containing PAC (1 ng ml−1) were irradiated with blue light from LEDs (472 nm) for 10 min at 27◦C. (B) The relationship between duration of irradiation and PAC activation. The reaction mixture containing PAC (4 ng ml−1) was irradiated with blue light (20 lmol m−2s−1, LEDs) for various durations (30, 60, 180, 360 s) within a constant reaction time (360 s). (C) Activation of PAC upon blue light irradiation at constant fluence. The reaction mixtures containing PAC (10 ng ml−1) were irradiated with blue light under various combinations of photon fluence rate and duration: (a) 2 lmol m−2s, 600 s; (b) 10 lmol m−2s−1, 120 s; (c) 20 lmol m−2s−1, 60 s; (d) 50 lmol m−2s, 24 s. Reactions were stopped at 600 s after onset of irradiation. Bars indicate standard errors, n = 3–4.
removing cell debris by centrifugation (10,000 g 10 min at 4◦C), cAMP in the supernatant was measured as described above.
Results and discussion
Dependency on photon fluence rates
In this study, we purified PAC according to Iseki et al.7with a small modification and observed adenylyl cyclase activity of the purified PAC under blue light provided by LEDs (472 nm).
Published on 15 March 2005. Downloaded by Graduate University for Advanced Studies on 13/08/2013 07:26:59.
Purified PAC activity under constant irradiation of blue light at 10 lmol m−2 s was ca. 1.8 pmol min−1lg−1, which was slightly lower than the activity obtained in a previous study7 may be related to the modification in the purification steps. To elucidate the fluence rate-response relationships in PAC activation, we measured the activity of PAC under blue light at various photon fluence rates. As shown in Fig. 1A, PAC activity (1 ng ml−1 in the reaction mixture) increased proportionally to photon fluence rates in the range of 2–50 lmol m−2 s and became nearly saturated in the range of 50–100 lmol m−2s−1. Ranges of photon fluence rates were equivalent to those that induce physiological responses in Euglena, such as the step-up photophobic response15and photodispersal of several mutant strains.16
Dependency on duration of irradiation
To examine the effects of irradiation time on PAC activation, we measured the amount of cAMP in the reaction mixture under blue light (20 lmol m−2 s−1) by varying the duration of irradiation between 0 and 360 s in the 360 s reaction time. As shown in Fig. 1B, the amount of cAMP produced by PAC increased proportionally to the duration of irradiation. This and the above results imply that activation of PAC is dependent on total photon fluence.
Bunsen-Roscoe law of reciprocity
To confirm the dependency of PAC activation on photon fluence, we measured the amount of cAMP produced in 600 s under blue light at various combinations of photon fluence rates and durations of irradiation, i.e., 2 lmol m−2s−1and 600 s, 10 lmol m−2 s−1 and 120 s, 20 lmol m−2 s−1 and 60 s and 50 lmol m−2s−1and 24 s, which produce the same fluence (1,200 lmol m−2). The amounts of cAMP produced under blue light at each combination were approximately 0.8 fmol ml−1, and there was no significant difference between them, judged by the t-test (p < 0.05). This demonstrates that reciprocity is valid for the fluence rate range of 2–50 lmol m−2s−1and for the duration range of 24–600 s. Taking into account all the above results, we conclude that activation of PAC is entirely dependent on photon fluence and can be regarded as a simple photochemical reaction.
Intermittent irradiation
The fact that the amount of cAMP was proportional to the duration of irradiation (Fig. 1B) means that activation of PAC occurred only during irradiation of blue light: i.e., if the elevation of activity lasted for several minutes even in darkness, the curve would not be proportional to the duration of irradiation. To examine the duration of the elevation of activity, we measured the amounts of cAMP in the reaction mixture under intermittent irradiation of blue light (100 lmol m−2 s−1). Intermittent irradiation with pulses of light/dark in equal lengths (0.1–180 s) caused activation of PAC to almost the same extents irrespective of the cycle periods (Fig. 2). This means that elevation of PAC activity occurs only during the light period and that elevated PAC activity falls off within 0.1 s after termination of irradiation: if the elevation of activity lasts for more than 0.1 s, the amount of cAMP should increase with the frequency. Such responsiveness is fast enough for PAC to mediate the step-up photophobic response that occurs with several subseconds latency.17
Wavelength dependency
It is reasonable that PAC is activated by UV-A and blue light because it contains FAD as a chromophore,7 however, experimental evidence for the wavelength dependency of PAC activation is lacking. Therefore, we tried to determine the action spectrum for the activation of PAC using the Okazaki Large Spectrograph. However, since adenylyl cyclase assay requires elevated costs to determine the actual action spectrum based on
Fig. 2 Activation of PAC upon intermittent irradiation. The reaction mixtures containing PAC (4 ng ml−1) were irradiated with intermittent blue light (100 lmol m−2 s−1, LEDs) at a duty ratio (ratio between durations of light and dark periods) of 1 : 1 for 360 s. Bars indicate standard errors, n = 4.
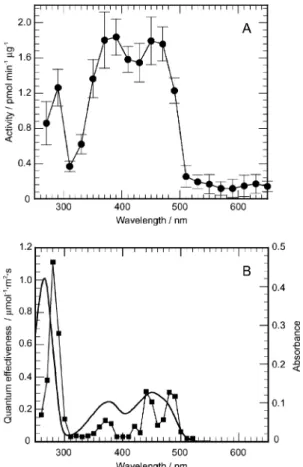
fluence-response relationships, we examined wavelength depen- dency between 260–650 nm at equal-quanta (10 lmol m−2s−1). The curve of wavelength dependency showed prominent peaks at 290, 390 and 450 nm (Fig. 3A). Fundamental features of the wavelength dependency coincided well both with the absorption spectrum of FAD and the action spectrum for the step-up photophobic response of Euglena (Fig. 3B),15 though small differences could be seen: e.g., the relative height of the 290 nm peak in the spectrum was lower than that of the corresponding peaks in other spectra. This confirmed that PAC is a sensor for the step-up photophobic response using FAD as a chromophore.
Fig. 3 (A) Wavelength dependency of PAC activation. The reaction mixture containing PAC (2 ng ml−1) was irradiated with monochromatic light (from 270 to 650 nm, 10 lmol m−2s−1) from the Okazaki Large Spectrograph for 10 min, at 27◦C. Bars indicate standard errors, n = 3–4. (B) Action spectra for the step-up photophobic response in Euglena (square) and absorption spectra of aqueous solutions of 1 × 10⁻⁵M FAD (solid line). Redrawn from Matsunaga et al.15
Published on 15 March 2005. Downloaded by Graduate University for Advanced Studies on 13/08/2013 07:26:59.
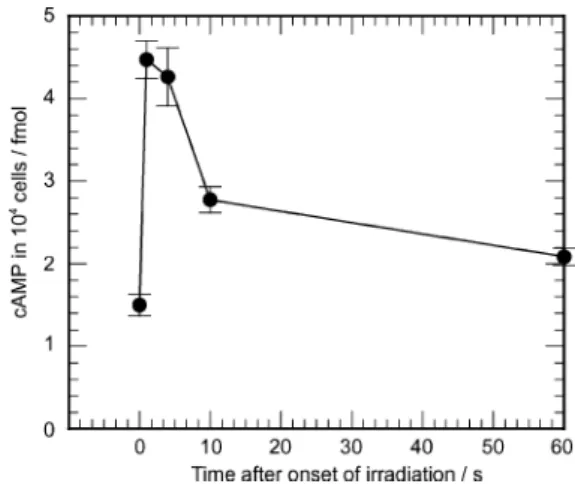
The change in intracellular cAMP levels during the step- up photophobic response. Since in vitro activity of PAC was elevated by blue light irradiation, we hypothesize that an increase in intracellular cAMP level evoked by photoactivation of PAC is a major cause of the step-up photophobic response. However, so far, there has been no experimental evidence that blue light irradiation induces an increase in intracellular cAMP level of Euglena. To examine this hypothesis, we measured intracellular cAMP before and after onset of blue light irradiation (20 lmol m−2 s−1). The intracellular cAMP level remarkably increased within 1 s after onset of irradiation (Fig. 4). The cAMP level at 1 s after onset of irradiation became almost three times higher than that before irradiation. From the data shown in Fig. 4, the increase in cAMP is 3 × 10⁻⁴ fmol cell−1. On the other hand, we estimated the increase in cAMP under irradiation with blue light at 20 lmol m−2s−1for 1 s to 2.5 × 10⁻⁵fmol cell−1 from Fig. 1A by assuming that the PFB (volume: 0.38 lm3, calculated from the size;1specific gravity: 1.25, estimated from density gradient centrifugation6) solely consisted of PAC: this is the maximum estimation because it has been reported that PFB also contains other proteins such as pterin binding proteins.6,18 Thus, the measured value of the increase in intracellular cAMP was at least 10 times higher than estimated. This means that the actual activity of PAC in the Euglena cell is much higher than the in vitro activity of the purified PAC, or that PAC is present not only in PFB but also in other cellular compartments such as flagella. The former can be well explained by considering a possibility that the activity of PAC used in the in vitro assay might have been lowered during storage of the PFB preparation and/or during purification of PAC. The latter is also possible because it has been reported that several mutant strains of Euglena gracilis and Astasia longa, which have no PFB but have homologues of PAC, show the step-up photophobic response.4,19
Fig. 4 The change in intracellular cAMP level upon blue light irradiation. Amounts of intracellular cAMP in Euglena cells were measured before and after onset of blue light irradiation (20 lmol m−2s−1, LEDs). Bars indicate standard errors, n = 4–6.
The elevated cAMP level upon irradiation with blue light went down within 10 s and gradually returned to the initial level even if irradiation continued. The time course of intracellular cAMP coincides well with the process of the step-up photophobic response: a Euglena cell shows a turn or tumbling for several seconds in response to blue light irradiation, and then resumes a straight swimming. This suggests that the increase in intracel- lular cAMP level induces the step-up photophobic response of Euglena and that the decrease of cAMP induces the recovery of straight swimming. Therefore, the step-up photophobic response is dependent on a mechanism that brings about such high and low intracellular cAMP levels. A major component for the former function should be PAC, which produces cAMP upon blue light irradiation, and that for the latter would be a phosphodiesterase (PDE), which decomposes cAMP, probably
by sensing the elevated cAMP level (Fig. 5). It has been reported that circadian rhythmicity of the activities of adenylyl cyclase and PDE generated circadian oscillations of cAMP level in Euglena cells.20In contrast to circadian oscillations of cAMP, the change in cAMP level during the step-up response is fast and transient. Therefore, we suggest that there may be an unidentified PDE specifically involved in the photophobic response probably located in the PFB or in the flagellum.
Fig. 5 Schematic representation of PAC involvement in the step-up photophobic response of Euglena. PAC is activated by UV-B/C, UV-A and blue light in a photon fluence-dependent manner to produce cAMP, which increases intracellular cAMP. The increase in intracellular cAMP triggers the step-up photophobic response, being followed by a decrease in intracellular cAMP, probably mediated by PDE, which brings about recovery from the step-up photophobic response.
Concluding remarks
In this study we found that in vitro kinetic properties of PAC photoactivation are suitable to explain the step-up photophobic response and that the change in intracellular cAMP level corresponded well with the process of the step-up photophobic response. Taking these results into account, we concluded that the increase in intracellular cAMP evoked by photoactivation of PAC is a key event of the step-up photophobic response (Fig. 5).
Acknowledgements
This work was supported in part by Grant-in-Aid for Scientific Research from the Ministry of Education, Science, Sports and Culture of Japan (15207006 to MW). A part of this study was carried out under the NIBB Cooperative Research Program for the Okazaki Large Spectrograph (No. 4-521). The authors thank Makiko Itoh for technical assistance in isolating PFBs.
References
1 E. Mikolajczyk and B. Diehn, The effect of potassium iodide on photophobic responses in Euglena: evidence for two photoreceptor pigments, Photochem. Photobiol., 1975, 22, 269–271.
2 P. L. Walne, F. Lenci, E. Mikolajczyk and G. Colombetti, Effect of pronase treatment on step-down and step-up photophobic responses in Euglena gracilis, Cell Biol. Intern. Rep., 1984, 8, 1017–1027. 3 D.-P. H¨ader, G. Colombetti, F. Lenci and M. Quaglia, Phototaxis
in the flagellates, Euglena gracilis and Ochromonas danica, Arch. Microbiol., 1981, 130, 78–82.
4 M. Ntefidou, M. Iseki, M. Watanabe, M. Lebert and D.-P. H¨ader, Photoactivated adenylyl cyclase controls phototaxis in the flagellate, Plant Physiol., 2003, 133, 1517–1521.
5 J. Buder, Zur Kenntnis der phototaktischen Richtungsbewegungen, Jb. Wiss. Bot., 1919, 58, 105–220.
6 M. Lebert, Phototaxis of Euglena gracilis-flavins and pterins, in Comprehensive Series in Photosciences 1: Photomovement. ed. D.- P. H¨ader and M. Lebert, Elsevier, Amsterdam, 2001, pp. 297–341. 7 M. Iseki, S. Matsunaga, A. Murakami, K. Ohno, K. Shiga, K.
Yoshida, M. Sugai, T. Takahashi, T. Hori and M. Watanabe, A blue- light activated adenylyl cyclase mediates photoavoidance in Euglena gracilis, Nature, 2002, 415, 1047–1051.
Published on 15 March 2005. Downloaded by Graduate University for Advanced Studies on 13/08/2013 07:26:59.
8 M. Gomelsky and S. Kaplan, AppA, a redox regulator of photo- system formation in Rhodobacter sphaeroides 2.4.1, is a flavoprotein. Identification of a novel FAD binding domain, J. Biol. Chem., 1998, 273, 3531–35325.
9 M. Gomelsky and G. Klug, BLUF: a novel FAD-binding domain involved in sensory transduction in microorganisms, Trends Biochem. Sci., 2002, 27, 497–500.
10 S. Masuda and C. E. Bauer, AppA is a blue light photoreceptor that antirepresses photosynthesis gene expression in Rhodobacter sphaeroides, Cell, 2002, 110, 613–623.
11 K. Okajima, S. Yoshihara, X. Geng, M. Katayama and M. Ikeuchi, Structural and functional analysis of a novel flavoprotein in cyanobacteria, Plant Cell Physiol., 2003, 44, s162.
12 S. Masuda, K. Hasegawa, A. Ishii and T. Ono, Light-induced structural changes in a putative blue-light receptor with a novel FAD binding fold sensor of blue-light using FAD (BLUF); Slr 1694 of Synechocytis sp. PCC6803, Biochemistry, 2004, 43, 5304–5313. 13 M. Watanabe, M. Furuya, Y. Miyoshi, Y. Inoue, I. Iwahashi and
K. Matsumoto, Design and performance of the Okazaki Large Spectrograph for photobiological research, Photochem. Photobiol., 1982, 36, 491–498.
14 B. Diehn, Photophobic responses of Euglena to single and repetitive pulses of actinic light: orientation time and mechanism, Exp. Cell Res., 1969, 56, 375–381.
15 S. Matsunaga, T. Hori, T. Takahashi, M. Kubota, M. Watanabe, K. Okamoto, K. Masuda and M. Sugai, Discovery of signaling effect of UV-B/C light in the extended UV-A/blue-type action spectra for step-down and step-up photophobic responses in the unicel- lular flagellate alga Euglena gracilis, Protoplasma, 1998, 201, 45– 52.
16 D. Geiß, H. Senger and P. Galland, Photoreception in Euglena gracilis: fluence rate and time dependence of photoaccumulation and photodispersal, J. Plant Res., 1998, 111, 431–440.
17 B. Diehn, J. R. Fonseca and T. L. Jahn, High speed cinemi- crography of the direct photophobic response of Euglena and mechanism of negative phototaxis, J. Protozool., 1975, 22, 492– 494.
18 D.-P. H¨ader and M. Lebert, The photoreceptor for phototaxis in the photosynthetic flagellate Euglena gracilis, Photochem. Photobiol., 1998, 68, 260–265.
19 M. Lebert and D.-P. H¨ader, Behavioral mutants of Euglena gracilis: functional and spectroscopic characterization, J. PlantPhysiol., 1997, 151, 188–195.
20 J. T. Isabelle, A. Carr´e and L. N. Edmunds, Jr., Circadian rhyth- micity in the activities of adenylate cyclase and phosphodiesterase in synchronously dividing and stationary-phase cultures of the achlorophyllous ZC mutant of Euglena gracilis, J. Cell Sci., 1991, 100, 365–369.
Published on 15 March 2005. Downloaded by Graduate University for Advanced Studies on 13/08/2013 07:26:59.