Isolation and Analysis of Arabidopsis Mutants
with Altered Leaf Thickness or Leaf Length
Noriyuki N. Narita
Doctor of Philosophy
2004
Department of Molecular Biomechanics
School of Life Science
The Graduate University for Advanced Studies
TABLE OF CONTENTS
GENERAL INTRODUCTION 1
CHAPETR I
Overexpression of a Novel Small Peptide ROTUNDIFOLIA4
Decreses Cell Proliferation and Alters Leaf Shape in Arabidopsis thaliana.
1 Introduction 3
2 Materials and Methods 5
3 Results 10
4 Discussion 16
CHAPTER II
Development of Leaf Thickness Measurement Instrument
and Anatomical Characterization of Arabidopsis Thick-leaf Mutant N692.
1 Introduction 29
2 Materials and Methods 32
3 Results 33
4 Discussion 36
CONCLUSION 44
ACKNOWLEDGMENT 45
REFERENCES 46
GENERAL INTRODUNTION
Diversity in the architecture of vascular plants is established by combination of morphogenesis of leaf, stem and roots arising from meristems. Stems and roots make the primary and higher order axes by branching. Thus, the pattern of branching is a mechanism underlying the determination of overall plant shape. In contrast, leaf is a lateral organ and has an essentially planar shape. Therefore the diversity in leaf shape should be created by a fundamentally different mechanism(s) from those employed in stems and roots. In addition, leaf is another major determinant of whole plant shape since most aerial parts of a plant is covered with leaves. Within a given species, the shape of leaves could also be different according to the node number as well as in response to environmental conditions. Thus, intrinsic developmental programs are coordinated with external stimuli, enabling highly plastic development. Moreover, flowers are mainly modified leaf organs, so the morphogenesis of floral organs could be understood through leaf
morphogenesis.
The diversity found in leaf shape reflects the evolutional history and adaptation of currently existing plant species. Leaves are the primary organs for photosynthesis and plants that have adapted in a particular ecological niche should be able to survive by modifying leaf shape. Therefore, understandings of
mechanisms of leaf morphogenesis are important for the elucidation of general plant morphogenesis as well as evolution and adaptation of plants.
Since leaves have three-dimensional formulation, it is thought that the mechanisms each controls growth and development along length, width or height direction would be important for leaf morphogenesis. This simplified idea seems helpful to dissect leaf morphogenesis into several elemental pathways. A number of mutants displaying disorganized leaf morphogenesis are often difficult to interpret how the normal gene function contributes to the developmental program of leaf shape control. Therefore, mutants with any specific defects in these axis-dependent mechanisms will provide fundamental knowledge about the leaf morphogenesis.
Several Arabidopsis mutants were isolated based on this idea in our laboratory. For example, leaves of
rotundifolia3-1 (rot3-1) are shortened specifically along length direction (Tsuge et al., 1996; Kim et al.,
1998b). The cause of short-leaf phenotype is that cell shape is shortened along the leaf-length direction. The molecular genetic analysis revealed that rot3-1 has a defect in the CYP90C1 that is involved in
brasinosteroid biosynthesis pathway (Kim et al., 1998b, in press). However, it had not been known whether control of leaf length is exclusively mediated by cell expansion. Therefore I focused on another important process of morphogenesis, namely cell proliferation. Screening of T-DNA activation lines of Arabidopsis thaliana led to the isolation of a novel short-leaf mutant, rot4-1D. Leaves of this mutant have fewer cells
than wild type specifically along the leaf-length direction. The results of detailed investigation are described in chapter I.
With respect to mutants that have a defect in the control of leaf width, angstifolia-1 (an-1) has been isolated (Tsuge et al., 1996). an-1 has a defect in the polar expansion of cells like rot3-1, but the leaf cells are narrower and thicker than wild type (Tsuge et al., 1996). In an-1 mutants, the abnormal orientation of the cortical microtubules was also found (Kim et al., 2002). Since orientation of cortical microtubule is important for the anisotropic cell expansion (Cyr, 1994; Shibaoka, 1994), the appropriate organization of cortical microtubule may be important for the determination of leaf width and thickness. However molecular function of AN is not well understood except that it is a homolog of transcriptional corepressor CtBP (Kim et al., 2002; Folkers et al., 2002; Cho et al., unpublished). In another narrow leaf mutant an3, the leaf width decreases due to the poor cell proliferation activity during the leaf blade expansion, and does not increase the leaf thickness (Horiguchi et al., unpublished).
As mentioned above, at present, isolation of mutants that have a specific defect in leaf thickness has been not reported. For the elucidation of the basic programs of leaf morphogenesis, I thought that identification of factors that specifically regulate leaf thickness is necessary. However, this has been hampered by the complicated procedure for the determination of leaf thickness. Therefore, I started the development of simple measurement system for the leaf thickness followed by the isolation of mutant with altered leaf thickness. The concept and usefulness of this system are described in chapter II. I believe that my results in this thesis should to better understandings of leaf-length and -thickness control.
CHAPTER I
Overexpression of a Novel Small Peptide ROTUNDIFOLIA4 Decreases Cell Proliferation and Alters Leaf Shape in Arabidopsis thaliana.
1 Introduction
Plant leaves exhibit great diversity in shape and size among different species. To understand the molecular basis of such morphological diversity, it is essential to reveal basic processes of leaf development. Since leaves of Arabidopsis thaliana are simple in shape, it is useful to understand how common developmental properties of leaf organ, such as dorsoventrality (Eshed et al., 2001; Kerstetter et al., 2001; McConnell et al., 2001; Sawa et al., 1999; Siegfried et al., 1999) and symmetry (Byrne et al., 2002; Iwakawa et al., 2002; Semiarti et al., 2001; Sun et al., 2002) are established (reviewed in Tsukaya, 2002).
Cell division and expansion are two major factors that influence organ shapes. Many mutants defective in cell expansion processes, including cell wall biosynthesis and modification (Cho and Cosgrove, 2000; Nicol et al., 1998), turgor generation (Dennison et al., 2001; Elumalai et al., 2002), endoreduplication (Sugimoto-Shirasu et al., 2002; reviewed in Sugimoto-Shirasu and Roberts, 2003) as well as hormone biogenesis and perception have been characterized (for review, see Tsukaya, 2003). In addition, transgenic plants, in which expression of core cell cycle genes such as CDKA;1 (Hemerly et al., 1995), CYCD3;1 (Dewitte et al., 2003), CDK inhibitors (De Veylder et al., 2001; Wang et al., 2000), E2F and DP (De Veylder et al., 2002) was manipulated, have been described. Many of these plants produced small leaves due to the inhibition of cell expansion, cell proliferation or cell differentiation. However, the relationship between the polar development of leaves and cell division and expansion is largely unknown.
To reveal the mechanisms of two-dimensional polar leaf development, Tsukaya and cowerkers have screened for leaf-shape mutants with a specific alteration in either the length or width of leaf blade, and
have characterized two classes of mutants, namely angustifolia (an) and rotundifolia (rot). In leaves of an and rot3, cell size is reduced mainly in the leaf width- and leaf length directions, respectively (Tsuge et al., 1996). The AN and ROT3 genes were found to encode a homolog of the transcription co-repressor, CtBP and a member of the cytochrome P450 family CYP90C1, potentially involved in brassinosteroid
biosynthesis, respectively (Kim et al., 1998b, 1999, 2002). These results demonstrated that distinct mechanisms are involved in the control of leaf cell expansion in the leaf-length and -width directions. In contrast, control of cell division orientation during leaf development is poorly characterized. Mutants with reduced leaf cell proliferation such as aintegumenta (ant), struwwelpeter (swp), pointed first leaf2 (pfl2) and grf interecting factor1 exhibit narrow-leaf phenotypes (Autran et al., 2002; Ito et al., 2000; Mizukami and Fischer, 2000; Kim et al, 2004). Moreover, histological characterization of the brassinosteroid-related mutants, de-etiolated2 (det2) and dwarf1 (dwf1), showed that these two mutants are defective not only in leaf cell expansion but also in leaf cell proliferation preferentially along the leaf-length direction (Nakaya et al., 2002). Consistently, expression of CYCD3;1 is induced by brassinosteroid in det2 suspension culture (Hu et al., 2000). These observations suggest that there is at least some preference in the direction of cell division within the leaf blade.
In this study, I investigated a newly isolated dominant mutant, named rot4-1D, develops short and rounded leaves which are resulting from a decrease in cell proliferation along the leaf-length direction. ROT4encodes a plasma membrane-localized small polypeptide of 53 amino acid residues and defines a novel plant specific family of small peptides. This study will provide information for better understanding of the mechanism that links cell proliferation and leaf morphogenesis.
2 Materials and Methods
2.1 Plant Materials and Growth Conditions
The rot4-1D mutant was isolated in Landsberg erecta (er) background that also carried the week curly leaf(clf) mutant allele, clf-9 (Goodrich et al., 1997). The rot4-1D mutant was crossed to wild type
Columbia three times to remove the clf-9 and er alleles and an identical phenotype was observed, indicating that it was independent of the clf or er background. Because the rot4-1D inflorescence phenotype
resembled that of er, absence of er mutation was confirmed by a sequence analysis of the ER locus. clf mutation was also removed from the rot4-1D mutant. For analyses of plants, seeds were sown on rock wool. After 24 h at 4°C in darkness, plants were grown under light at 40.4 ± 6.7 µmol/m2/s at 22°C. Ages of plants were given in terms of days after transfer to 22°C.
2.2 Anatomical Analysis
To observe palisade cells, leaf tissues were cleared with chloral hydrate solution (4 g/ml chloral hydrate and 0.4 g/ml glycerol) as described elsewhere (Tsuge et al., 1996). Individual cell sizes were measured using the ImageJ 1.29x program (National Institutes of Health; http://rsb.info.nih.gov/ij/).
2.3 Determination of the T-DNA Insertion Site in rot4-1D
To clone genomic DNA flanking the T-DNA insertion, plasmid rescue (Weigel et al., 2000) was performed. Genomic DNA was extracted from rot4-1D mutant plants, digested with EcoRI and ligated overnight under conditions favoring intramolecular ligation. The resulting plasmid, pJG28, contained both pSKI015 and plant genomic DNA sequences with a single EcoRI site. Sequence analysis of pJG28 using a primer designed from pSKI015 sequence indicated the approximate site of the T-DNA insertion. To confirm the precise T-DNA insertion site, the following oligonucleotides were used for polymerase-chain- reaction (PCR) amplification using rot4-1D genomic DNA as a template; ROT4RBsite, 5'-
AAGCCGTTAGGTTTAGAGGG-3'; T7, 5'-GTAATACGACTCACTATAGGGC-3'. Amplified DNA
fragments were sequenced with the ROT4RBsite primer.
2.4 Determination of the Full-length ROT4 cDNA Sequence
The full-length cDNA of ROT4 was established by 5' rapid amplification of cDNA ends (RACE) and 3' RACE using 5' RACE System Version 2.0 (Invitrogen Corp., Carlsbad, CA, USA) and 3' RACE System (Invitrogen Corp.). Total RNAs were prepared from whole mature plants using the RNeasy Plant Mini Kit (QIAGEN Inc., Valencia, CA, USA). The following oligonucleotides were used as gene-specific primers 1 (GSP1) of PCR for 5' RACE; ROT4-R, 5'-TAATCAAGAGTCTTTGCGGTCG-3'; and as GSP2; 5RACE- GSP2, 5'-CGTGCCAGCAAACTAACATG-3'. For 3' RACE, the following oligonucleotides were used as GSP1 and GSP2; ROT4-F, 5'-ACAAATCAATGGCACCGGAG-3'; 3RACE-GSP2, 5'-
TGAGCCGTGCAAGACTTTTG-3'.
2.5 Generation of Transgenic Lines Overexpressing ROT4 Variants
Total RNAs were prepared from whole mature plants as above. The SuperScript One-step RT-PCR Kit (Invitrogen Corp.) was used for reverse-transcription PCR (RT-PCR) according to the manufacturer's protocol. The condition for amplification by RT-PCR was one cycle at 50°C for 15 min and 94°C for 2 min, then 35 cycles at 94°C for 15 s, 57°C for 30 s and 72°C for 60 s. ROT4-F and ROT4-R were used as primers for RT-PCR. The RT-PCR products were subcloned into pCR2.1 (Invitrogen Corp.), and the resultant vector was named ROT4/pCR2.1. To generate 35S::ROT4-green fluorescence protein (GFP) transgenic plants, the binary vector construct ROT4-GFP/pSMAB704 was first made as follows. ROT4 DNA was PCR amplified from ROT4/pCR2.1 template DNA using the oligonucleotides; ROT4-Gly-F (5'- CAATGGCACCGGAGGAGAATG-3') and ROT4-Gly-R (5'-
TTTCCATGGCACCTCCACCTCCACCTCCAGAGTCTTTGCGGTCGTGG-3') in order to remove the ROT4stop codon and to introduce an NcoI site and a glycine linker. The product was subcloned into pCR2.1 to produce ROT4-Gly/pCR2.1. ROT4-Gly/pCR2.1 was digested by EcoRI, blunted using a DNA Blunting Kit (TaKaRa Bio Inc., Otsu, Japan) and then digested with NcoI. The vector pTH2 (Niwa et al.,
1999) which carries the GFP gene under control of the cauliflower mosaic virus (CaMV) 35S promoter was digested with SalI, blunted as described above and then digested with NcoI. These two fragments were
ligated to produce ROT-GFP/pTH2. pSMAB704 was digested with HindIII and EcoRI to remove the 35S:: ɋ-glucuronidase gene and then ligated to the 35S::ROT4-GFP gene which was excised from ROT4- GFP/pTH by HindIII and EcoRI digestion. Similarly, plasmid vector constructs ROT4ȵN/pCR2.1 and ROT4ȵC/pCR2.1 were made as follows. ROT4ȵNDNA was PCR amplified from ROT4/pCR2.1 template DNA using the oligonucleotides; ROT4dN-F (5'-ATGACTTTTGGGCAAAAGTGC-3') and ROT4-R in order to remove the N terminus region of ROT4 and to add the first methionine codon. ROT4ȵCDNA was PCR amplified using the oligonucleotides; ROT4-F and ROT4dC-R (5'-TCAGTCGTGCCAGCAAACTA- 3') in order to remove the C terminus region of ROT4 and to add the stop codon. Each DNA fragment was inserted in pCR2.1. The DNA fragment insertion to the binary vector pSMAB704 was performed as described for the case of ROT4-GFP. These constructs were introduced into wild-type plants by
Agrobacterium-mediated transformation using the simplified floral dip method (Clough and Bent 1998).
Transgenic plants were selected on Murashige and Skoog medium containing 2 mg/ml Gellan Gum (Wako, Osaka, Japan), 10 µg/ml bialaphos (Shinyo-Sangyo, Tokyo, Japan) and 500 µg/ml claforan (Aventis Pharma Ltd., Tokyo, Japan).
2.6 Semi-quantitative RT-PCR
Reverse transcriptions were carried out using the Super Script II RT and the adapter primer of the 3' RACE System. For amplification of ROT4 cDNA, ROT4-F and ROT4-R were used. As a control, the following oligonucleotides were used to detect the constitutively expressed ACTIN2 (ACT2) gene (An et al., 1996); ACT2-F, 5'-GAAATCACAGCACTTGCACC-3'; ACT2-R, 5'-AAGCCTTTGATCTTGAGAGC-3'. The condition for amplification by RT-PCR was one cycle at 50°C for 15min and 94°C for 2 min, then 27 cycles for ROT4 cDNA amplification or 33 cycles for ACT2 cDNA amplification, at 94°C for 15 s, 57°C for 30 s and 72°C for 60 s.
2.7 Observation of the Intracellular Localization of ROT4
The ROT-GFP/pTH2 construct was introduced into Arabidopsis plants by floral dip transformation, as above. The GFP fluorescence was observed under a confocal laser-scanning microscope, TCS SP2 (Leica, Wetzlar, Germany). To carry out a plasmolysis experiment, epidermal peel was immersed in 0.8 M mannitol solution for 2 h.
2.8 Microarray Analysis
Total RNAs were prepared from 25-days-old plant using RNeasy Plant Mini Kit. Gene chip ATH1 (Affymetrix, Santa Clara, CA, USA) was used as the probe array DNA for microarray analysis according to the manufacturers protocol.
2.9 Phylogenetic Analysis
DNA sequences, which are similar to ROT4, were obtained by TBLASTN searches at NCBI
(http://www.ncbi.nlm.nih.gov/BLAST/). The deduced amino acid sequences of the conserved region of ROT4and the retrieved DNA sequences were aligned using the CLUSTAL W program (Thompson et al., 1994) and alignments were refined manually. For construction of a maximum-likelihood (ML) tree, a neighbor-joining (NJ) tree as the start tree was used for a local rearrangement search. Then, the NJdist and ProtML programs were used in MOLPHY, version 2.3b3, package
(http://www.ism.ac.jp/software/ismlib/softother.html; Adachi and Hasegawa, 1996). The NJ tree was obtained with NJdist and the ML tree was obtained with ProtML. The local bootstrap probability of each branch was estimated using the ProtML program (Himi et al., 2001, Sakakibara et al. 2001).
2.10 Isolation of rtfl4-1, osrtfl1-1 and osrtfl2-1
To find knockout mutants of Arabidopsis and rice for the cording region of RTFL members, BLASTN searches were performed at TAIR BLAST (http://www.arabidopsis.org/Blast/) or Mutant panel
(http://tos.nias.affrc.go.jp/~miyao/pub/tos17/). In Arabidopsis, only one mutant that has an insertion of T-
DNA in the coding region of a RTFL family member was found in the SALK T-DNA insertion collection, namely accession SALK_089234 which carries an insertion in RTFL4. In Oryza sativa L., two mutants with a Tos17 transposon insertion in the cording region of RTFL4 were found from the Rice insertion mutant database (Miyao et al., 2003), and these RTFL members were named OsRTFL1 and OsRTFL2, respectively. These candidate knockout mutant populations were kindly supplied by the Ohio Arabidopsis Stock Center (USA) and the Rice Genome Resource Center (NIAS, Japan). Each homozygous mutant was identified by PCR analysis of genomic DNA. To identify homozygotes for the T-DNA insertion in RTFL4, the following oligonucleotides were used; RTFL4-P, 5'-GTTCGTTCACCCAATGGCTC-3'; RTFL4-N, 5'-
TGTTTGTGCCAGCAAACGAG-3', LBb1, 5'- GCGTGGACCGCTTGCTGCAACT-3'. The primer pair of RTFL4-P and LBb1 specifically amplifies DNA from the insertion allele whereas the primer pair of RTFL4-P and RTFL4-N was used for identification of the non-insertional allele. Similarly, to identify homozygotes for Tos-17 transposon insertions in the OsRTFL1 and OsRTFL2 genes, the following oligonucleotides were used; OSRTFL1-F, 5'-GCCTATGGTTTGGCATTG-3'; OSRTFL1-R, 5'-
GCGCCTCGTCGTCGACGT-3'; OSRTFL2-F, 5'-ATGGCATATCCCCTCCTGT-3'; and OSRTFL2-R, 5'- TCGCTCCAGCGGAGCAACA-3'.
3 Results
3.1 Isolation and Phenotypic Characterization of the rot4-1D Mutant
An insertional mutagenesis was performed by transforming plants with the T-DNA containing plasmid pSKI015. Insertion of this T-DNA in intergenic regions frequently results in gain of function mutations that increase expression of flanking genes (Weigel et al, 2000). Seeds were harvested from 2000 individual primary transformants (T1 generation) and the resulting T2 families were screened for mutations affecting leaf morphology. One family segregated for a novel, short leaf phenotype in a ratio (61 mutants:18 wild- type) consistent with the presence of a single, dominant mutation. Because the mutagenesis was performed in a Landsberg er background that also carried the weak clf allele clf-9 (Goodrich et al., 1997), the mutation was introduced into an ER+ CLF+ background by crossing three times to plants of Columbia ecotype. A similar dominant mutant phenotype was observed to segregate, indicating that the phenotype was independent of the ER or CLF genes. The mutation was designated rot4-1D and all subsequent
morphological analysis involved comparison of rot4-1D and wild-type sibs in the introgressed Columbia background.
The leaf blade of rot4-1D was short and rounded (Fig. 1A). The reductions in leaf blade length and petiole length in rot4-1D were more severe than those in leaf blade width (Fig. 1B, Fig. 2A). In addition, the reduction in leaf blade length was more pronounced in leaves formed at later developmental stages (Fig. 1B, Fig. 2A). In addition to the effects on leaf blade and petiole, rot4-1D floral organs and inflorescence stems were also shorter than those of wild type (Fig. 1C, D, Fig. 2A). By contrast, there were no significant differences in morphological features between wild type and rot4-1D roots (data not shown).
To test whether the reduced leaf length in rot4-1D is due to a decrease in cell number or size or both, the numbers and sizes of the palisade cells in the first, third and fifth rosette leaves were measured. The leaf blades of rot4-1D had fewer cells than wild type did, and, as in the case of the leaf blade length, this was more evident in the leaves formed at later developmental stages (Fig. 2B). To relate the decrease in the cell number to the effect of rot4-1D on leaf shape (Fig. 2A), the palisade cell numbers in both the leaf-length
and -width directions were counted. Again, the number of palisade cells in the leaf-length direction in rot4- 1Ddecreased in a similar fashion to the decrease in total cell number in the sub-epidermal layer (Fig. 2C). However, the cell numbers along the leaf-width direction in rot4-1D were not significantly different at any of the developmental stages examined (Fig. 2C). In addition, the palisade cell sizes in bottom, middle and top portions of first and third leaves in rot4-1D were comparable to the corresponding wild type leaves and portions (Fig. 1E, Fig. 2D). Although the cell size in the bottom portion of the fifth leaf in rot4-1D was smaller than that of wild type (Fig. 2D), this might be due to a retardation in fifth leaf expansion since rot4- 1Dplants grow slightly slower than wild type. Cells in older leaves of rot4-1D expanded to a similar extent to wild type cells.
Taken together, these results suggest that the main effect of the rot4-1D mutation is a decrease in cell proliferation along the leaf-length direction. The measurements of cell size and cell number do not account for the decrease in leaf-width (Fig. 2A). This discrepancy could be attributable to the combined effect of subtle decreases in the cell number in the leaf-width direction and cell size in rot4-1D. In fifth leaves, wild type and rot4-1D were indistinguishable with respect to the sizes and the shapes of palisade, sponge and epidermal cells when transverse sections were examined (data not shown).
3.2 Identification of ROT4
To test whether this insertion might cause the rot4-1D mutation, I analyzed the genetic linkage of a herbicide (bialaphos) resistance marker carried on the T-DNA with the mutant phenotype. All 68 mutants in the original T2 family were resistant, whereas the 18 wild-type plants were herbicide sensitive, consistent with the insertion being responsible for the rot4-1D mutation. To identify the affected gene, the DNA flanking the T-DNA insertion was isolated by plasmid rescue (see materials and methods). Sequence analysis indicated that the insertion was in an intergenic region on chromosome II between the genes At2g36980 and At2g36990 (Figure 3A). However, when the mRNA levels of these genes were determined by RT-PCR, expression levels were similar in rot4-1D and wild-type plants (data not shown), suggesting that neither gene was likely to be responsible for the rot4-1D phenotype. Because the interval between
these two genes was relatively long (about 4.5 kbp), I searched the region for potential open reading frames (ORFs). A TBLASTX search was performed using the genomic DNA sequence between the stop codon of At2g36980 and the stop codon of At2g36990 as a query and several cDNA sequences from Arabidopsis and other plant species were retrieved. Although none of them perfectly matched the query genomic sequence, on the basis of the alignments and conceptual translations, a small potential ORF that encodes 53 amino acid residues was identified (Figure 3A,B). The ORF was located within 1kb from the right border of the T- DNA insert. Because pSKI015 T-DNA insertions generally affect expression of genes adjacent to the T- DNA right-border which carries CaMV 35S enhancers (Weigel et al, 2000), it seemed likely that increased expression of this ORF was the basis of the dominant rot4-1D phenotype.
To test whether this small ORF was expressed in wild type, RT-PCR was carried out. As shown in Figure 3C, a cDNA band of the expected size was amplified. In addition, this mRNA accumulated at a higher level in rot4-1D than in wild type (Figure 3C). Because these results strongly suggest that ROT4 encodes this small ORF, its full-length sequence was determined by RACE PCR (GenBank accession number,
AB107209). To confirm that this gene corresponded to ROT4, I tested whether the rot4-1D phenotype was reconstituted when wild-type plants were transformed with a construct that placed the candidate gene fused with GFP under control of the CaMV 35S promoter (35S::ROT4-GFP). Foliage leaves of homozygous T2 plants from three independent transformants were shorter than those of wild type as was seen in rot4-1D (Figure 3D), confirming that the candidate gene corresponded to ROT4.
3.3 Expression Pattern of ROT4
The ROT4 expression pattern was examined in various organs of wild-type plants by RT-PCR analysis using ROT4-specific primer sets. Although ROT4 was strongly expressed in flowers and flower buds, the accumulation of ROT4 mRNA was not detected in mature rosette leaves (Figure 4A). In young seedlings, however, the expression of ROT4 was clearly detected in shoots (Figure 4B). I next characterized the ROT4 expression level in shoots of seedling at different developmental stages. After stratification, plants were incubated in dark condition for 2 days, and were then grown in light for several days. The ROT4 expression
level in shoots of seedlings was highest at 6 days after the shift to light (Figure 4C). Using plants at this stage, the organ-specificity of ROT4 expression was analyzed. The shoots of seedlings were dissected into the full-expanded cotyledons, the primordia of the first pair of foliage leaves, and shoot apices which included the shoot apical meristem and younger leaf primordia. The ROT4 expression was highest in the shoot apices, and somewhat reduced in the leaf primordia (Figure 4D). Expression in the mature cotyledons was extremely low. These results confirmed that ROT4 is expressed in wild-type leaves during early developmental stages.
3.4 Plasma Membrane Localization of ROT4
To determine the intracellular localization of the ROT4 protein, I examined young leaves of 35S::ROT4- GFPtransgenic Arabidopsis plants using confocal microscopy. As shown in Figure 5A and B, GFP signal was localized at the periphery of goth palisade and epidermal cells in the transgenic Arabidopsis plants. The same localization was observed also in onion epidermal cells that were bombarded with the 35S::ROT4- GFP transgene (Figure 5D). To determine whether the ROT4-GFP fusion was localized in the plasma membrane or in the cell walls, plasmolysis was induced with 0.8 M mannitol. ROT4-GFP localized with the shrunken plasma membrane, indicating that it was present in the plasma membrane and not in the cell wall (Figure 5C,D). Thus, unlike the 35S::GFP control plants, in which the GFP fluorescence was mainly cytosolic (Figure 5E), the ROT4-GFP fusion protein was localized to the plasma membrane.
3.5 Microarray Analysis in rot4-1D
Over-expression of ANT extends the period of CycD3 expression in leaves and eventually leads to the formation of large leaves (Krizek, 1999; Mizukami and Fischer, 2000). Therefore, I expect that expression of some of the cell cycle-related genes might be altered in rot4-1D. To identify genes whose expression level was altered in rot4-1D mutants, a microarray analysis was carried out. Although cell proliferation activity is reduced in rot4-1D, expression levels of genes that control the cell proliferation such as cell cycle-related genes were not detectably altered. Several genes were dramatically up-regulated in rot4-1D
(Table 1) but the relationship between these genes and cell proliferation is unclear. There were no genes that were down-regulated below 10% levels of wild type gene expression (data not shown).
3.6 ROT4 Is a Member of a Novel, Seed Plant Specific Family of Small Peptides
Database searches revealed 22 other putative Arabidopsis proteins with similarity to ROT4. These proteins were named RTFL1 through 22 (ROT FOUR LIKE). Alignment revealed a 29 amino acid region that was conserved between the RTFL members (Figure 6A). The region was rich in basic amino acids and has not been previously identified in any other proteins of known function. I named the novel region RTF (ROT FOUR) domain. When a phylogenetic tree was produced from the RTF domain, no sub-classes were found between the RTFL members (Figure 6B). In other plant species such as Oryza sativa, Glycine max, Populus balsamifera, etc., there are ESTs that encode RTFL members (O.s., AU182671; G.m., AW458841; P.b., BU880463). These hypothetical proteins were not found in non-seed plants and animals, suggesting
that RTFL may be a seed plant-specific gene family.
Recently, Wen et al. (2004) reported that DVL family affect to Arabidopsis development especially the fruit shape. The DVL family corresponds to RTFL family; DVL1, DVL2, DVL3, DVL4 and DVL5 correspond to RTLF18, RTFL19, RTFL21, RTFL17 and RTFL15, respectively.
To further characterize RTFL function, in particular the loss of function phenotype, we screened existing collections of insertion mutants in Arabidopis and rice for insertions that disrupted any RTFL member. Such mutations were very rare, presumably because the RTFL genes are extremely small, and I could not identify any insertion at ROT4. However a mutant that carried a T-DNA insertion within the ORF of RTFL4was identified within the SIGNAL collection of Arabidopsis T-DNA insertion lines (Figure 7A). The mutation is likely to be null because it disrupts the conserved RTFL domain and was designated rtfl4-1. Furthermore, I identified two mutants in Oryza (rice), that carried insertions of the Tos17 transposon within Oryzahomologues. These Oryza RTFL members were named OsRTFL1 and OsRTFL2, and encoded proteins sharing 45 % and 38 % amino acid identity with ROT4 within the RTF domain, respectively (Figure 7B). The two rice mutants, also predicted to be severe loss of function alleles, were named osrtfl1-1
and osrtfl2-1, respectively. I identified plants that were homozygotes for the various mutant alleles. However, none of the mutants showed any phenotype that I could discern, either in terms of organ shape or any other gross morphological character (Figure 7C, D). These results suggest that there might be
functional redundancy between several or all RTFL members as might be expected given that the family comprises more than twenty members with similar protein sequences.
3.7 The RTF Domain Is Sufficient for ROT4 Activity
Although the RTF domain is conserved between distantly related plant species, the regions outside the RTF domain at the N-terminal and C-terminal ends of the protein are diverged. To investigate the function
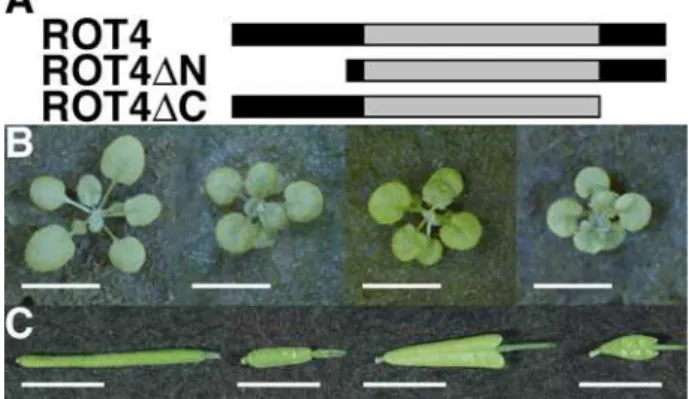
of the different domains of ROT4, I generated the constructs ROT4ȵN or ROT4ȵC which expressed modified proteins that lacked either the N-terminal or the C-terminal regions of ROT4, respectively (Figure 8A). The constructs were expressed under control of the CaMV 35S promoter in transgenic Arabidopsis plants. In both cases the resulting transgenic plants had short rosette leaves similar to those of rot4-1D mutants (Figure 8B). This result suggests that only the conserved RTF domain is required for ROT4 activity.
As in rot4-1D plants, which had short siliques, the transgenic plants also had short siliques. This phenotype was less severe for plants expressing ROT4ȵN than for plants expressing ROT4ȵC. Interestingly, the siliques of both of ROT4ȵN and ROT4ȵC over-expressing plants showed changed shape so that they resembled an arrowhead (Figure 8C). A similar phenotype was also reported for plants over-expressing the CYP78A9 gene, which encodes a cytochrome P450 enzyme or DVL family. In CYP78A9, the effects on silique shape were caused both by increased cell proliferation and also by increased cell enlargement in the carpel valves (Ito and Meyerowitz, 2000). Over-expression of DVL family leads the repression of expression level of MADS-box gene, FRUITFULL (FUL; Wen et al., 2004). It has known that the carpel cells in ful mutant decrease the cell size (Ferrándiz et al., 2000).
4 Discussion
4.1 ROT4 Is a Novel Small Peptide with a Conserved RTF Domain
I identified a novel gene that is over-expressed in an Arabidopsis mutant with short leaves (Figure 1). ROT4encodes a small peptide and its predicted molecular weight is only 6.2 kDa. Genome-wide database searches revealed that ROT4 is a member of a novel gene family, which shares a 29 amino-acid domain, RTF. All these members encode small peptides. Small peptides are often involved in developmental or defense signaling. For example, CLAVATA3 (CLV3), phytosulfokine, S-locus cystein-rich protein/S-locus protein11, ENOD40, systemin, Brick1 (Brk1), rapid alkalinization factor and POLARIS (PLS) have been described (Fletcher et al., 1999; Matsubayashi and Sakagami, 1996; Schopfer et al., 1999; Takayama et al., 2000; Yang et al., 1993; Pearce et al., 1991; Frank and Smith, 2002; Pearce et al., 2001; Casson et al., 2002). With the exception of Brk1 and PLS, these peptides are shown to act extracellularly as peptide hormones (Ryan et al., 2002). The action of Brk1 is unusual because it has no predictable targeting signals and functions non-cell autonomously. ROT4 represents another unusual example, since the ROT4-GFP fusion protein localized to the plasma membrane in onion epidermal cells (Figure 5). Given that ROT4 has neither a predictable signal peptide nor a transmembrane domain, it is likely that ROT4 is a peripheral membrane protein or a part of a plasma membrane-localized protein complex. Alternatively it may be tranported across plasma membrane, since a cellular immune system, the transporter associated with antigen processing (TAP) transports peptides in the cytosol to the lumen of endoplasmic reticulum (Schmitt and Tampé, 2000). The RTF domain within the ROT4 peptide is likely sufficient for ROT4 activity, since
transgenic plants expressing ROT4ȵN or ROT4ȵC truncations have short rounded leaves similar to those of the rot4-1D mutant (Figure 8B). This result indicates that other RTFL members may have similar activities, on account of their shared RTF domain, and suggests that there could be substantial functional redundancy between RTFL members.
4.2 Limitations of Conventional Genetic Screens for Identifying Small Genes
Because ROT4 and RTFL genes have not been annotated in the Arabidopsis genome database, it is likely that many other novel small genes may be overlooked by gene prediction programs. In addition, the small size of their coding regions means that loss of function mutations are likely to be rare, so that the genes may not be disrupted in conventional mutagenesis programs. For example, I was able to identify only one insertion mutant amongst the 22 RTFL members in Arabidopsis despite the extensive collections that exist for reverse genetic analysis. Similarly, loss of function mutations affecting the CLV3/ESR (embryo- surrounding region) -related (CLE) gene family, which contains 28 members encoding small peptides
(Cock and McCormick, 2001), are also extremely rare (Hobe et al, 2003). As well as the relative scarcity of mutations within small genes, redundancy between family members may also limit their identification in forward genetic screens. Consistent with this, it was striking that the rtfl4-1, osrtfl1-1 and osrtfl2-1 mutants were all without gross morphological phenotypes (Figure 7B). For identification of small genes and/or genes with functional redundancy, activation tagging has several advantages. Firstly, overexpression can often reveal a gain of function phenotype when loss of function mutations are without obvious phenotype (Wilson et al, 1996. Weigel et al, 2000). Secondly, because insertions that are very distant from the promoter (at least 3.6 kb upstream, Weigel et al, 2000) can give gain of function phenotypes, genes with small coding regions are nonetheless mutagenised as effectively as those with much larger coding regions. Thus activation tagging has recently proved an efficient means for identifying another class of small genes, those encoding microRNA (Palatnik et al, 2003).
4.3 The role of ROT4 in cell proliferation and leaf morphogenesis
When ROT4 is over-expressed, cell numbers decreased specifically in the leaf-length direction (Figure 2, 3D). In addition other organs such as petals and sepals also showed a shortened, rounded shape, suggesting that ROT4 over-expression may generally inhibit polar cell proliferation in lateral organs, specifically in the leaf-length direction (Figure 1C, D). As cell proliferation in the leaf-length direction in a leaf primordium continues as long as the leaf primordium grows (Donnelly et al., 1999). The mRNA of ROT4 accumulated in wild-type shoot apices and leaf primordia, but was not detected in mature rosette leaves (Figure 4B, D).
Strong expression of ROT4 was also detected in roots, flowers and flower buds, which like apices and young leaf primordial are regions of active cell proliferation. Because ROT4 acts to restrict cell proliferation it is perhaps surprising that it is mainly expressed in regions of active cell proliferation. However, a precedent for this is provided by the CINCINNATA (CIN) gene of Antirrhinum, which is also involved in the control of leaf shape. The CIN gene is proposed to restrict cell proliferation by promoting cell cycle arrest, and it is also expressed in young leaf primordia in actively dividing regions of the leaf lamina (Nath et al, 2003). The expression of CIN moves in a wave that passes from tip to base of the leaf and that is correlated with a wave of cell cycle arrest and cell expansion that moves from tip to base. It will be interesting to observe the behaviour of the arrest front in rot4-1D mutants.
Two other factors that inhibit cell proliferation, ICK1 and KRP2, have been analyzed in detail (Wang et al., 2000; De Veylder et al., 2001). These proteins bind to CDKA;1 and D-type cyclins, and inhibit the activity of cyclin-dependent kinase (Wang et al., 1998). The characteristic phenotypes of the respective over-expressers are that they show an extreme decrease in the number of cells per leaf blade (10% of wild type leaf cell number), and have serrated leaves. ROT4 also exerts an inhibitory effect on cell proliferation. However, a critical difference compared with the over-expression of ICK1 or KRP2 is that the reduction in cell number caused by over-expression of ROT4 is modest (Figure 2B; in the severest case, cell number of rot4-1D was 67.5% of that of wild type). Such differential inhibitory effects on cell proliferation may reflect different roles in the control of cell proliferation. Whereas ICK1 and KRP2 directly control key cell cycle components, it is likely that ROT4 acts more indirectly. Firstly, ROT4 is plasma membrane localized and therefore is likely to interact indirectly through a transduction pathway with the cell cycle machinery. In addition, ROT4 and RTFL are a seed plant-specific gene family, suggesting they have evolved to control cell proliferation by a specialized manner.
Another important difference between plants over-expressing ICK1 or KRP2, relative to rot4-1D is in the effect on individual cell sizes. In the previous reports, it was shown by the observations of transgenic plants expressing ICK1, KRP2 or dominant negative CDKA;1 and also of ant, swp, pfl2, G-protein a subunit 1 (gpa1) and gibberellic-acid insensiteive (gai) (Wang et al., 2000; De Veylder et al., 2001; Hermerly et al.,
1995; Mizukami and Fischer, 2000; Autran et al., 2002; Ito et al., 2000; Ullah et al., 2001; Tsukaya et al., 2002; reviewed in Tsukaya, 2003) that when the cell number of leaves decreases, compensatory increases in cell size occur, and the reduction of leaf size is consequently alleviated. This frequently observed
phenomenon raised a possibility of the existence of a compensatory system between cell division and expansion. In clf leaves, both cell number and size decrease (Kim et al., 1998a). To best of our knowledge, rot4-1Dis one of the very few instances of a mutant in which a decrease in cell number does not affect cell size. The only other example that I was aware of is the ask1 mutant (Zhao et al., 1999). One simple interpretation of the rot4-1D phenotype is that a threshold value of reduction rate of cell number may exist to induce the compensation. It should be noted that some natural variations in leaf size and shape is solely attributable to changes in cell number (Tsukaya, 2002). Thus, it is also possible that ROT4 is involved in the control of organ shape and size. Further analysis of function of ROT4 and RTFL peptides should help us to understand how small peptides control development of plant organs. Another important question is whether individual leaf cells possess proliferation potential in leaf-length and leaf-width directions independently of one another. The rot4-1D phenotype is consistent with independent control of
proliferation along the two axes. Observation of the cell division direction during leaf blade morphogenesis will provide more information to help answer this possibility.
Table 1 Genes up-regulated in rot4-1D identified by gene chip analysisa
Up-regulation (-fold: rot4-1D/wt)b
Encoded protein Experiment one Experiment two
beta-glucosidase 29.86 27.86
expressed protein 34.30 21.11
glycine-rich protein 5.28 22.63
lipid transfer protein, putative 16.00 6.50
glycine-rich protein 11.31 5.28
caffeoyl-CoA 3-O-methyltransferas, putative 4.00 6.50
anther development protein 5.28 4.00
lipid transfer protein-like protein 5.66 2.64
xyloglucan endotransglycosylase, putative 4.29 2.83
glycine-rich protein 5.28 2.46
putative cysteine proteinase inhibitor B 4.29 3.25
putative hydrolase 3.48 3.73
oxidoreductase-like protein 3.03 4.00
hypothetical protein 3.73 2.14
family II extracellular lipase 3.03 2.64
ribosomal protein L16 2.14 3.48
ribosomal protein L14 2.00 3.03
aGenes for which levels of transcripts were at least three times higher in rot4-1D than in wild type are shown.
bRatio of transcript levels in the rot4-1D mutant to those in wild type.
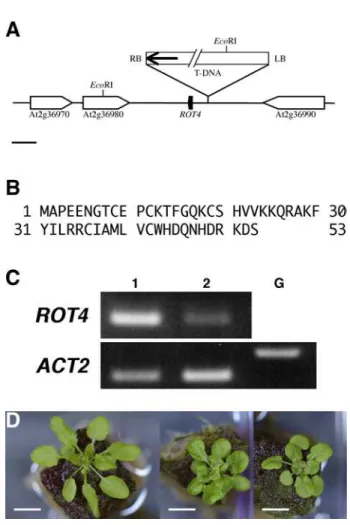
Figure 1 Phenotypes of rot4-1D.
(A) 25-days-old plants of wild type (left) and rot4-1D (right). Scale bars: 10 mm. (B) Leaves of 33-days-old plants of wild type (top) and rot4-1D (bottom). A cotyledon pair, first though seventh foliage leaves, and a cauline leaf are shown from left to right. Scale bars: 10 mm. (C) Top view of wild type (left) and rot4-1D (right) flowers. Scale bars: 1 mm. (D) Side view of wild type (left) and rot4-1D (right) flowers. Two sepals and petals were removed. Scale bars: 1 mm. (E) Palisade cells in middle portion of third foliage leaves of 38- day-old wild type (left) and rot4-1D (right). Scale bars: 0.1 mm.
Figure 2 Measurements of leaf morphological characteristics in rot4-1D.
(A) Leaves and stems sizes were measured when individual plants had opened their third flower. Open column, wild type (n = 14); shaded column, rot4-1D (n = 6). Values are mean ± SD. Numbers indicate the foliage leaf positions. C indicates cauline leaves. (B) Number of palisade cells in subepidermal layer per leaf blade. (C) Number of palisade cells in leaf-length direction and leaf-width directions. (B, C) Open column, wild type (n = 3); shaded column, rot4-1D (n = 3). Numbers indicate foliage leaf positions. Values are mean ± SD. (D) Palisade cell size. Three independent experiments were carried out. In each case, cell area of 10 cells was measured. Three times using independent samples. Open column, wild type; shaded column, rot4-1D. Values are mean ± SD. B, M and T indicate bottom, middle and top portions of a leaf, respectively.
Figure 3 Structure of the ROT4 locus and ROT4 over-expression phenotype.
(A) A schematic map of the T-DNA insertion site in rot4-1D. An arrow indicates CaMV 35S enhancer. A bar indicates 1 kbp. (B) The deduced amino acid sequence of ROT4. (C) RT-PCR analysis of ROT4 mRNA accumulation. Total RNAs of mature whole plants were used. Lane 1, rot4-1D; lane 2, wild type. The ACT2 was used as a control. Lane G indicates a negative control using genomic DNA. (D) 30-day-old plants of wild type (left), rot4-1D (center) and transgenic T2 plants over-expressing ROT4-GFP (right). Scale bars: 10 mm.
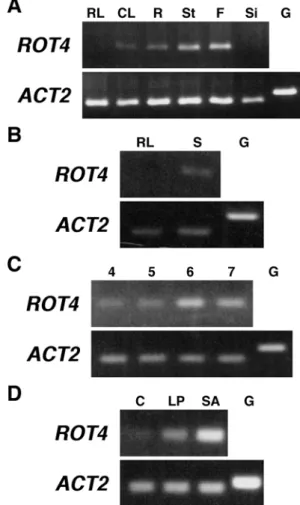
Figure 4 Expression of ROT4.
(A) Differential expression of ROT4. Total RNAs from following organs were analyzed. RL, rosette leaves; CL, cauline leaves; R, roots; St, stems; F, flowers and flower buds; Si, siliques. (B) ROT4 mRNA
accumulation in mature rosette leaves (RL) and shoots of 10-day-old seedlings (S). (C) ROT4 mRNA accumulation in shoots of seedling at different stages. Etiolated seedlings grown 2 days in the dark were transferred to light condition and grown for several days. Numbers indicate days after shifting from the dark condition. (D) ROT4 mRNA accumulation in shoots of seedling. C, cotyledons; LP, leaf primordia of first and second leaves; SA, shoot apices. G indicates negative controls using genomic DNA. The ACT2 gene is expressed contitutively and is used a control for equivalent levels of cDNA amplification.
Figure 5Intracellular localization of ROT4-GFP.
(A-C) Localization of ROT4-GFP fusion protein in mesophyll (A) and epidermal (B,C) cells of a young leaf primordium of a transgenic Arabidopsis plant harboring 35S::ROT4-GFP. Cells were untreated (B) and treated with 0.8 M mannitol to cause osmosis (C). Scale bars = 10 µm. (D, E) Localization of ROT4-GFP fusion protein (D) and GFP protein (E) in onion epidermal cells. Fluorescent and Nomarski images are integrated for each panel. The upper panel shows cells untreated and the lower panel shows cells treated with 0.8 M mannitol. Scale bars = 100 µm. Note that the ROT4-GFP localized to the plasma membrane.
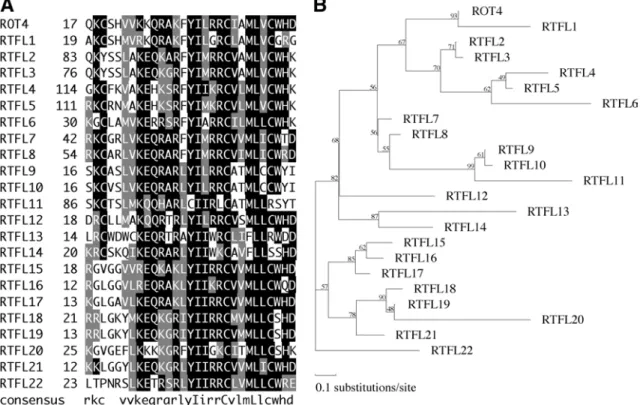
Figure 6 ROT4 gene family.
(A) The RTF domain of RTFL members in Arabidopsis genome. Numbers on the right of gene names indicate the positions of amino acid residues. Following Arabidopsis Genome Initiative (AGI) gene code have been assigned; RTFL2, At2g29125; RTFL3, At1g07490; RTFL5, At5g59510; RTFL8, At2g39705; RTFL16, At3g25717; RTFL17, At1g13245. Following members have an EST entry in GenBank; RTFL2, AV790691, AV825235; RTFL3, AU239065, AU239065; RTFL8, AU238463; RTFL10, AU237602; RTFL11, AU230682; RTFL12, AI997361, AV537172; RTFL15, AU227486, AU236535; RTFL16, T44697, T88458, Z17964; RTFL17, AI992996, AV534331, AV788885, AV832293, BU634921, T21221. (B) Phylogenetic tree of RTFL member. Numbers on branches indicate local bootstrap values, which were calculated with the ProtML program. The length of each horizontal branch is proportional to the estimated evolutionary distance.
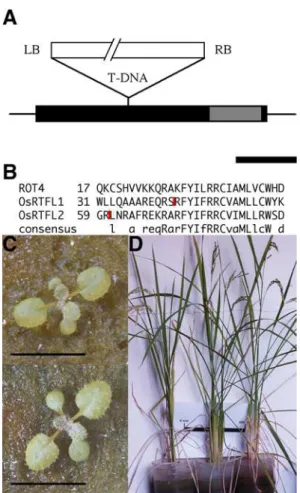
Figure 7 Knockout mutant of the members of ROT4 family.
(A) T-DNA insertion site within RTFL4 in Arabidopsis. A solid rectangle and a shaded rectangle indicate a potential protein-cording region and a region encoding RTF domain of RTFL4, respectively. A bar indicates 100 bp. (B) The RTF domain of ROT4, OsRTFL1 and OsRTFL2. Numbers on the right of gene names indicate the positions of amino acid residues. Red lines indicate insertion sites of Tos17. (C) Top view of rtfl4- 1(top) and wild type (bottom) of Arabidopsis. Scale bars: 10 mm. (D) Side view of wild type (left), osrtfl1-1 (center) and osrtfl2-1 (right) of Oryza. Scale bar: 200 mm.
Figure 8 Phenotypes of transgenic plants over-expressing ROT4ȵN and ROT4ȵC.
(A) Primary structure of ROT4, ROT4ȵN and ROT4ȵC peptide. Solid rectangles and shaded rectangles indicate protein-coding regions and RTF domains of ROT4. (B) 25-day-old plants of wild type, rot4-1D, transgenic T2 plant over-expressing ROT4ȵN and ROT4ȵC are shown from left to right. Scale bars: 10 mm. (C) The silique of wild type, rot4-1D, transgenic T2 plant over-expressing ROT4ȵN and ROT4ȵC are shown from left to right. Scale bars: 5 mm.
CHAPTER II
Development of Leaf Thickness Measurement Instrument and Anatomical Characterization of Arabidopsis Thick-leaf Mutant N692.
1 Introduction
Plant leaves have a polarity toward its thickness direction besides dorsoventral, longitudinal and mediolateral polarities. Diversity in leaf thickness reflects morphological adaptation of leaves to various environments. For example, succulent plants such as Crassulaceae and Cactaceae have thick leaves. Moreover, plants exhibit plasticity in leaf thickness. Leaves developed as sun leaves have more developed palisade tissue under high intensity of light, or as shade leaves that developed under low intensity of light have thinner palisade tissue than sun leaves (Esau, 1977). Yano and Terashima (2001) reported that light signals from mature leaves affect determination of anatomy of new leaves in Chenopodium album. In addition to light conditions, it is known that several phytohormones also affect the leaf thickness. Brassinolide, indoleacetic acid or gibberellin A3 treatment leads to a slight increase of height of leaf parenchyma and epidermal cells in Tabebuia alba (Ono et al., 2000). In Arabidopsis thaliana, the de- etiolated-2(det2) mutant, which has a defect in steroid 5Ɋ-reductase involved in brassinosteroid biosynthesis pathway (Li et al., 1996), has thick leaves compared with wild type (Ramonell et al., 2001), while Nakaya et al. (2002) did not recognize such a phenotype in det2-13 and det2-18 alleles. In tomato, leaves of high pigment-1 (hp-1) mutant are thicker than those of wild type, because hp-1 mutation dramatically increases the periclinal elongation of palisade cells (Cookson et al., 2003). Despite these phenomena were confirmed in several plant species, the mechanisms for the leaf-thickness control are still unknown. Recently, it was reported that HP-1 encodes a tomato homolog of the Arabidopsis UV-damaged DNA binding protein 1 (DDB1), and are shown to interact both biochemically and genetically with the nuclear localized protein, DET1 (Schroeder et al., 2002; Lieberman et al., 2004). However, the casual
relationship between HP-1 and the leaf-thickness was unclear, because phenotype of hp-1 is pleiotropic. Several examples in which cell proliferation or polarized expansion affect the leaf thickness have been known besides the effects of phytohormones. For example, the angstifolia (an) mutant, which has a defect in a gene for C-terminal Binding Protein homolog, develops leaf cells narrower and thicker than wild type (Tsuge et al., 1996). From the observation of mesophyll cells and the cortical microtubules in an, the orientation of the cortical microtubules altered (Kim et al., 2002). Because in plant cells, an orientation of cortical microtubules controls a direction of cell expansion (Cyr, 1994; Shibaoka, 1994), this result suggests that polar cell expansion controlled by microtubule organization may be important for the determination of the leaf thickness. Moreover, leaf thickness is known to be affected by some cell cycle regulatory genes. For example, when Kip-related protein 2 (KRP2) is over-expressed, leaf thickness is increased since so-called compensation (Tsukaya, 2002; Beemster, 2003) is triggered where the decrease of cell proliferation induces an increase of cell volume (De veylder et al., 2001). Although the decrease of cell number is occurred in the proximodistal and the mediolateral directions, the number of mesophyll-cell layers does not decrease and leaf cells expand a polar manner. The same phenomenon is also seen in tobacco overexpressing a dominant negative version of CDKA;1 (Hemerly et al., 1995).
The increase of leaf thickness observed in these examples, however, is thought as a secondary effect since these mutants and transgenic plants do not have thickness-specific phenotypes. Such mutants have not been reported yet. Therefore, studies concerning to the leaf thickness have fallen behind those for plane
geometrical morphogenesis of leaves. This is in part because the measurement of leaf thickness requires complicated processing of samples. Therefore, to isolate mutants whose leaves are thicker or thinner than wild type, I developed a new equipment for rapid measurement of the leaf thickness using a laser displacement sensor.
This instrument was named Leaf Thickness Measurement Instrument (LTMI). Complicated steps in conventional method can be omitted by using LTMI. This enabled me to perform a high-throughput screening for mutants with altered leaf thickness. As a result, three mutants were isolated. N692 is a representative mutant and has a decreased cell number and an increased cell volume without alteration of
number of mesophyll layer. In this chapter, I describe the usefulness of LTMI and novel leaf-thickness mutants isolated by LTMI, which should serve as important materials for the better understandings of the thickness control.
2 Materials and Methods
2.1 Plant Materials and Growth Conditions
Arabidopsiswild type C24 (CS906) was obtained from the Arabidopsis Biological Resource Center (ABRC; Columbus, OH, U.S.A.). N692 mutant was crossed to C24 for back cross. For analyses of plants, seeds were sown on rock wool. Other environmental conditions are same as described in chapter I. For screening of mutant with altered leaf thickness, C24 T-DNA activation tagged pool (CS31401) was obtained from ABRC. The 3rd leaves of 30-day-old plants are measured by LTMI.
2.2 Equipments for LTMI
For construction of LTMI, a power supply (MS-H75), a programmable controller (KV-16DT), a laser displacement sensor (LK-2010), a graphic analog controller (RJ-800) and an A/D converter (NR-110) were prepared (all equipments were produced by Keyence Corp., Osaka, Japan). The power supply is a source of electric supply to the programmable controller, the laser displacement sensor and the graphic analog controller. CRY-2000 (Diversified Biotech, Boston, MA U.S.A) was used as a segment of white tape to ensure the correct reflection of the laser beam (Figure 9).
2.3 Anatomical Analyses
To observe palisade cells, leaf tissues were cleared with chloral hydrate solution as described in chapter I. For histological analysis, leaf or stem samples were fixed and embedded in Technovit 7100 (Kulzer,
Hereaus). A series of 6 µm thick transverse sections were made with a rotary microtome HM355S (Microm). Sections were stained with staining solution containing 0.5% toluidine blue and 0.1 % sodium carbonate and observed with microscope. Individual cell sizes were measured using the IMAGE J program described as chapter I.
3 Results
3.1 Development of Measurement Instrument of Leaf Thickness
Traditional measurement of Arabidopsis leaf thickness requires time consuming steps, such as fixation of leaves, dehydration, embedding of the samples, slicing by a microtome and observation under microscopes. Thus, I tried to develop an instrument, which can measure quickly the thickness of Arabidopsis living leaves.
As the first attempt, I used the coating thickness tester SDM-3000T (Sanko electronic laboratory Co. Ltd., Kawasaki, Japan), which measures a distance between a metal surface and the sensor probe. In theory, putting a piece of leaf on a metal plate and pressing the leaf surface with the sensor probe can measure a thickness of plant leaves. However, employment of the sensor probe of this tester was unsuitable for this
purpose due to two problems. First, the diameter of sensor tip was too large (about ɞ 2 mm). This prevented the measurement from the correct positioning of a leaf sample. Second, measurement with the same pressing force, with which leaf piece is pushed onto a metal plate, at every experiments was difficult. Because Arabidopsisleaves are tender, pressing by the sensor probe crushed leaves. Moreover, when a degree of pressing force was altered manually, the different outputs were obtained depending on the intactness of leaf sample. Therefore, I tried another method. To solve the first problem, a laser displacement sensor LK-035 (Keyence Corp.; diameter of the laser, ɞ 30 m) was adopted. This sensor also solved the second problem since it is a non-destructive method. But the measurement of distance between the sensor and the surface of leaf tissue was difficult, probably because leaf epidermal cells and trichomes are transparent, and diffused reflection of the laser ray is occurred on the leaf surface. In order to obtain the appropriate laser reflection, the leaf sample was covered with a piece of white tape. The addition of this step gave successful reflection of the laser beam. This method was named Leaf Thickness Measurement Instrument (LTMI). Figure 9 shows the concept of LTMI.
To confirm the precision of LTMI, thickness of micro cover glass (Matsunami Ind. Ltd., Kishiwada, Japan; thickness, 0.12 ~ 0.17 mm) was tested, and the output values from LTMI are in the range of standerd. This result indicates that LTMI can measure plate-like materials at high precision, and an artifactual effect by the
adoption of white tape is negligible if any.
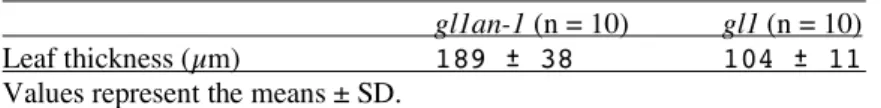
Next, I tried the measurement of living leaf samples. Before measurement of thickness of a leaf, following preparations was needed. First, since the midrib is thicker than the other part of leaf lamina, it was removed by cutting with a razor blade, and then the leaf sample was mounted on a slide grass. Then a segment of white tape was overlaid on the surface of leaf sample, with a care not to remain air bubbles between them. Even using the LTMI, the presence of trichomes on the leaf surface severely affects the quality of the measurements, because LTMI is so sensitive to detect the air space made by the trichomes. Thus, all measurements were carried out for strains without trichomes, such as ecotype C24 or the glabra1 (gl1) mutant of ecotype Columbia. To estimate the efficiency and accuracy of LTMI, I compared values of leaf thickness measured by the LTMI method and the conventional method. The output values obtained by these methods were slightly different. Since the conventional method requires dehydration, this may cause partial shrinkage of leaf samples (Table 2). Before screening of mutants associated with altered leaf thickness was carried out, another control experiment was done. When leaf thicknesses in gl1an-1 double mutant and gl1 single mutant were compared with LTMI method (Table 3), clear difference in the leaf thickness was found. Thus, LTMI is proven to be a suitable system for the rapid measurement of leaf thickness. Therefore, LTMI was used in following analyses.
3.2 Isolation and Anatomical Characterization of Arabidopsis Mutants with Altered Leaf Thickness To isolate thick- or thin- leaf mutants of Arabidopsis, I carried out a genetic screening by using LTMI. Since mutant screening using activation tagging has several advantages, C24 T-DNA activation tagged pool was used. This mutant pool enables to isolate both loss- and gain-of-function mutants. In addition, genomic DNA sequences flanking T-DNA are easily determined by plasmid rescue. I expected that mutants with an increased leaf thickness due to an increased cell layer and/or an increased cell height will be isolated. Under the growth condition in this study, the number of leaf tissue layer is minimum. Therefore, thin-leaf mutants will be associated with the reduction of cell height. Thick-leaf mutants may have increased cell height and/or layer number. By screening 227 pools each containing 10 lines, I isolated three mutants from pool numbers
CS35692, CS35865 and CS36091. These mutants were named tentatively N692, N865 and N091, respectively (Figure 10). The leaf thicknesses of N692 or N865 were thicker and that of N091 was thinner than that of wild type. N692 was extreme mutant in terms of fold-change in thickness (Table 4; 1.25-, 1.11- and 0.90-fold leaf thickness in N692, N865 and N091, respectively). Thus, I choose N692 for further detailed analyses.
To find the cause of increased leaf thickness in N692, cross section of the mutant and wild type leaves was prepared and observed with microscope. Consistently, I found that the leaf thickness of N692 was 1.09-fold thicker than the wild type leaves (Figure 11 A,B; Table 4). The difference of the leaf thickness between wild type and N692 decreased compared with the measurement using by LTMI. This discrepancy may be caused by a difference of shrinkage of samples in the dehydration process during the preparation of the leaf section. Slicing of samples by microtome at right angle is difficult, and this may also be a cause of error. In N692, epidermal and mesophyll cells were larger than wild type. The height of cells in uppermost layer of the palisade tissue (subepidermal layer) was measured. The extent of the increase in the leaf thickness correlated with those of the cell height (Table 5), indicating that the increase of the leaf thickness in N692 is mainly caused by the cell expansion and is not by the increase of the mesophyll cell layer. Next, the area of the palisade cells from a paradermal viewpoint and the leaf blade area were measured (Figure 11 C,D; Table 6). Despite the cell area increased in N692, the leaf blade area did not differ between N692 and wild type, indicating that compensation occurred in N692. Stem thickness has also increased in N692 especially the expansion of epidermal cells is striking (Figure 12; Table 7).
4 Discussion
4.1 Usefulness of LTMI
In this study, LTMI was developed to measure the leaf thickness. This instrument allows the determination of leaf thickness easier and faster than the conventional method. Without this method, mutant screening based on leaf thickness should be impossible. As compared to the coating thickness tester which is necessary to touching to leaf samples, LTMI can measure soft leaf samples without crushing. However, there are some points to be improved. First, LTMI is not suitable to measure the thickness of a material with irregular surface; Arabidopsis leaves have a midrib, which is thicker than lamina portion, and numerous trichomes. Moreover, leaf epidermal cells cause diffused reflection of a laser beam. Therefore, measurement by LTMI requires removal of midrib and masking of leaf sample with opaque sheet. The optical problem may be able to solve by using supersonic waves displacement sensor (for example, E4PA-N; Omron Corp. Kyoto, Japan). Second, LTMI is applicable only to glabrous leaves. Since trichome prevents precise measurement, LTMI cannot be applied to standard wild type Columbia. This problem may not be solved without changing the fundamental approach.
4.2 Isolation of Arabidopsis Mutants with Altered Leaf Thickness
By using LTMI, I isolated three mutants N692, N865 and N091. However, I screened from only 227 pools each containing 10 lines. Although T-DNA is often inserted as multi copies (average 1.5 copy per line; Alonso et al., 2003) and activation tagging induces gene activation and disruption, the mutant screening performed in this study yielded genetic loci far from saturation. Thus, further screening should identify more genetic loci involved in the control of leaf thickness.
To understand a leaf thickness control in plants, mutants which increases or decreases cell proliferation and/or expansion along specifically leaf thickness direction are valuable. In order to isolate a mutant which decreases layer number, mutant screening under the condition to develop sun leaf may be needed.
N692 has expanded cells in epidermis and mesophyll layer along not only leaf thickness direction but also
leaf plane directions. In addition leaf cell number is reduced in N692. Therefore, phenotypes of N692 are different from what I had expected. However, mutants which mimic sun leaf or shade possibly exist in Arabidopsis.
4.3 Relationship between Leaf Thickness and Compensation
In N692, the cell volume increases while the cell number decreases. It is thought that compensation occurs. However, the decrease of the cell number occurs within each layer of leaf tissues. The increase of the cell volume is isotropic. As a result, the area of leaf blade is same as wild type while leaf thickness increases in N692. From these results, compensation does not occur such that leaf thickness is unchanged by the decrease in the number of tissue layer in N692.
Generally, compensation is triggered by the reduction in cell number (Tsukaya, 2003). However,
fundamental defects in N692 should be carefully examined. For example, N692 has normal leaf area although most of known mutants with a decreased leaf cell number, such as aintegumenta, struwwelpeter, pointed first leaf 2, gibberellic-acid insensitive and grf interecting factor1, display incomplete compensation (Mizukami
and Fischer, 2000; Autran et al., 2002; Ito et al., 2000; Tsukaya et al., 2002; Kim et al., 2004). As a rare example, Boudolf et al. (2004) recently reported that the transgenic lines expressing a dominant negative variant of B-type cyclin-dependent kinase repress the cell division in leaf, resulting the promotion of endoreduprecation and the increse of cell size, and the leaf blade area of the transgenic plants is as large as wild type. It is thought possibility that causes of N692 phenotype are in similar pathway to these transgenic plants. However, cell size and thickness in the stem are increased in N692 than in wild type. Therefore it remains possible that the enhanced cell expansion suppresses cell proliferation. To distinguish these possibilities, cloning of the N692 gene is necessary.
Table 2 Leaf thickness of mutants identified by LTMI.
Output value as leaf thickness (µm)
LTMI method (n = 10) 134 ± 8
Conventional method (n = 10) 125 ± 19 Values represent the means ± SD.
Table 3 Comparison of the leaf thickness in gl1an-1 and gl1 by using LTMI. gl1an-1(n = 10) gl1(n = 10)
Leaf thickness (µm) 189 ± 38 104 ± 11
Values represent the means ± SD.
Table 4 Leaf thickness of mutants identified by LTMI. Leaf thickness (µm) LTMI method
N692
Mutant (n = 23) 158 ± 10
Wild type (n = 27) 126 ± 6
N865
Mutant (n = 11) 130 ± 5
Wild type (n = 12) 117 ± 11 N091
Mutant (n = 12) 105 ± 9
Wild type (n = 12) 117 ± 11 Cross section method
N692
Munant (n = 10) 159 ± 23
Wild type (n = 10) 146 ± 18 Values represent the means ± SD.
Table 5 Comparison of the leaf thickness and height of subepidemal layer in C24 and N692.
N692 C24
Leaf thickness (µm) 159 ± 23 146 ± 18
Height of subepidermal layer (µm)* 35 ± 6 32 ± 5
Hight of subepidermal layer / leaf thickness (%) 22 22
*Values represent the means ± SEM for more than 8 plants.
Table 6 Comparison of the leaf blade area, palisade cell area and cell number.
N692 C24
Leaf blade area (mm2) 13.9 ± 2.0 13.2 ± 2.2
Cell area from a paradermal viewpoint (µm2)* 2228 ± 168 1502 ± 281
Cell number per 1 mm2 440 ± 44 632 ± 77
*Values represent the means ± SEM for more than 8 plants.
Table 7 Comparison of the stem thickness in N692 and wild type. N692 (n = 7) C24 (n = 7)
Stem thickness (mm2) 1.16 ± 0.15 0.93 ± 0.15
Values represent the means ± SD.
Figure 9 System Construction of LTMI.
(A) System construction diagram of LTMI. Power supply is a source of electronic supply to a programmable controller, a laser displacement sensor and a graphic analog controller. The programmable controller controls the laser displacement sensor. Arrows indicate a flow of signal of leaf thickness from a sensor head. GND indicates grounding (earthing). (B) A diagram showing the measurement with LTMI. A cover tape, a leaf sample and the sensor head are put between two stationary plates. The sensor head is fixed to the bottom plate. The cover tape adheres to top plate (left). To define zero point, distance from the sensor head to the surface of tape is measured. A leaf sample is held between the cover tape and the top plate (right). Actual leaf thickness is determined by subtracting the values measured with and without the leaf sample. Dotted lines indicate laser beam from the sensor head.
Figure 10 Mutants with altered leaf thickness.
(A) N692. (B) N865. (C) N091. (D) C24. Bars indicate 10 mm.
Figure 11 The Cell Shape in N692 Mesophyll Cells.
(A,B) Cross section of 1st leaf in N692 (A) and C24 (B). (C,D) Palisade cells from a paradermal viewpoint of 1st leaf in N692 (C) and C24 (D).
Figure 12 Cross section of N692 and wild-type stem. (A) N692. (B) C24. Bars indicate 1 mm.