Associations of Dietary Protein with Disease and Mortality in a Prospective Study of
Postmenopausal Women
Linda E. Kelemen1, Lawrence H. Kushi2, David R. Jacobs, Jr.3,4, and James R. Cerhan1
1 Department of Health Sciences Research, Mayo Clinic College of Medicine, Rochester, MN.
2 Division of Research, Kaiser Permanente, Oakland, CA.
3 Division of Epidemiology, School of Public Health, University of Minnesota, Minneapolis, MN.
4 Department of Nutrition, University of Oslo, Oslo, Norway.
Received for publication June 24, 2004; accepted for publication August 26, 2004.
Some weight loss diets promote protein intake; however, the association of protein with disease is unclear. In 1986, 29,017 postmenopausal Iowa women without cancer, coronary heart disease (CHD), or diabetes were followed prospectively for 15 years for cancer incidence and mortality from CHD, cancer, and all causes. Mailed questionnaires assessed dietary, lifestyle, and medical information. Nutrient density models estimated risk ratios from a simulated substitution of total and type of dietary protein for carbohydrate and of vegetable for animal protein. The authors identified 4,843 new cancers, 739 CHD deaths, 1,676 cancer deaths, and 3,978 total deaths. Among women in the highest intake quintile, CHD mortality decreased by 30% from an isoenergetic substitution of vegetable protein for carbohydrate (95% confidence interval (CI): 0.49, 0.99) and of vegetable for animal protein (95% CI: 0.51, 0.98), following multivariable adjustment. Although no association was observed with any outcome when animal protein was substituted for carbohydrate, CHD mortality was associated with red meats (risk ratio = 1.44, 95% CI: 1.06, 1.94) and dairy products (risk ratio = 1.41, 95% CI: 1.07, 1.86) when substituted for servings per 1,000 kcal (4.2 MJ) of carbohydrate foods. Long-term adherence to high-protein diets, without discrimination toward protein source, may have potentially adverse health consequences.
dietary carbohydrates; dietary proteins; heart diseases; mortality; neoplasms; postmenopause; prospective studies
Abbreviations: CHD, coronary heart disease; CI, confidence interval.
The role of dietary protein in the development of cancer and coronary heart disease (CHD) has been less widely studied in epidemiologic investigations than have the effects of dietary fats, carbohydrates, and alcohol. Ecologic data showed strong positive correlations between the amount of animal protein in the diet and CHD mortality in different countries (1), suggesting that amount and type of protein may be important in disease etiology. Similar findings were observed for milk, meat, and overall protein intake with cancer mortality (2).
Historically, experimental studies found that animal protein fed to rabbits was associated with atherosclerosis (3) and plaque formation (4) independent of dietary cholesterol and saturated fat (3, 5, 6). In contrast, rabbits fed soy protein did not develop vascular lesions (3, 7). A major limitation of
the experimental trials is that only one type of animal protein (typically casein) was compared with only one type of vege- table protein (typically soy).
Human experimental trials observed favorable short-term effects on serum lipids, plasma insulin (8–10), and fasting blood glucose (11) when dietary animal protein replaced carbohydrate. Higher protein intake was also associated with a 26 percent lower risk of ischemic heart disease when substituted for carbohydrate in a large epidemiologic study after controlling for major CHD risk factors including dietary fats (12).
More recently, studies showed positive associations between consumption of well-done red meat and frequent frying, barbecuing, and broiling of meats with the develop- ment of several cancers (13), associations thought to be
Correspondence to Dr. Linda E. Kelemen, Department of Health Sciences Research, Mayo Clinic College of Medicine, Charlton 6-141, 200 First Street SW, Rochester, MN 55905 (e-mail: kelemen.linda@mayo.edu).
at Life Science Library- Sinica on July 8, 2010 http://aje.oxfordjournals.orgDownloaded from
explained by increased exposure to the potent and highly bioavailable carcinogens, heterocyclic aromatic amines (14, 15).
With the advent of many popular high-protein diets, little information is available on their long-term effects on health outcomes in humans. Further, these diets typically do not discriminate among protein sources, treating the putative beneficial effects of animal and vegetable proteins equally. We investigated the relation of total protein substituted for carbohydrate, a change that would be expected while adhering to a high-protein diet, and the association of different protein sources substituted for one another with chronic disease and mortality using data collected from the Iowa Women’s Health Study.
MATERIALS AND METHODS Study population
Details of the Iowa Women’s Health Study were published previously (16). Briefly, in January 1986, we mailed a 16- page questionnaire to 99,826 eligible women between the ages of 55 and 69 years who were randomly selected from the Iowa driver’s license registry. Those who responded (41,836 or 41.9 percent) form the cohort under study.
Dietary and risk factor assessment
The questionnaire inquired about factors known or suspected to be related to cancer, including smoking, phys- ical activity level, postmenopausal hormone use, alcohol use, and anthropometric measurements. We assessed base- line diet in 1986 with a semiquantitative food frequency questionnaire described by Rimm et al. (17). For each food, a common unit or portion size was specified, and participants were asked how often, on average, they had consumed that amount of the item over the past year. The nine responses ranged from “never or less than once per month” to “six or more times per day.” The questionnaire also asked about vitamin and mineral supplement intake. Daily intakes of nutrients were calculated by summing across all food items the product of the frequency of consumption of the specified unit of each food by the nutrient content of that unit of food. The validity and reliability of the food frequency question- naire have been documented in this cohort (18).
Exclusion criteria
We excluded women who, at baseline, were premeno- pausal, who reported a history of cancer other than skin cancer, known heart disease, or known diabetes, and who left 30 or more food items blank or had total energy intake less than 600 kcal/day (2.5 MJ/day) or more than 5,000 kcal/day (20.9 MJ/day). A total of 29,017 women were available for analysis.
Follow-up
We mailed questionnaires in 1987, 1989, 1992, and 1997 to establish vital status and change of address. Deceased
nonrespondents were identified through linkage with the National Death Index. Incident cases of cancer were ascer- tained through the State Health Registry of Iowa, part of the Surveillance, Epidemiology, and End Results Program (19), via an annual computer match of participant identifiers.
Statistical analysis
Person-years for each participant were calculated from the date of returning the baseline questionnaire to the date of diagnosis of cancer, death, emigration from Iowa, or December 31, 2000, whichever came first. Macronutrients were expressed as a percentage of total energy, and other dietary covariates were energy adjusted by the regression method (20). We examined the distribution of potential confounding and risk factors by quintiles of total protein intake. Continuous variables were categorized into quintiles and treated as indicator variables in statistical models following inspection of their relation with each outcome in univariable analysis. We calculated risk ratios and 95 percent confidence intervals using Cox regression, and we modeled survival as a function of age (21), using as the referent the lowest quintile of protein intake.
We assessed the relation between dietary protein and each outcome with multivariable-adjusted nutrient density models (22). These models allow estimation of the effect on each outcome of an increase in the percentage of energy from protein intake. By forcing total energy and other intake, such as dietary fats, to be constant and by excluding carbo- hydrate from the model, an increase in protein intake by defi- nition statistically results in a decrease in carbohydrate intake. Thus, the effect estimates of protein assume a substi- tution interpretation (12, 22). The percentage of energy from protein that is “substituted” for carbohydrate is the differ- ence in median energy intake of protein between the highest and lowest quintiles. For each endpoint, we first assessed the effect of an isoenergetic substitution of each of total, animal, and vegetable protein for total carbohydrate. Next, we assessed the effect of an isoenergetic substitution of vege- table protein for animal protein while holding constant the intakes of carbohydrate, total energy, and potential confounding factors. Thus, the difference in the percentage of energy from protein (or protein type) between the lowest and the four remaining quintiles varied according to the comparison under study.
While the use of nutrient values was necessary to evaluate our hypotheses of protein for carbohydrate substitutions on various outcomes, realistically most individuals interchange foods when implementing dietary changes. Therefore, we also evaluated the effect of an isoenergetic substitution of various intakes of high-protein foods, standardized as serv- ings per 1,000 kcal/day (4.2 MJ/day), for carbohydrate- dense foods while holding constant total energy, dietary fats, and other components of protein foods such as cholesterol. This was done to better isolate the effect on our outcomes of the protein in these foods separate from the effects of other nutrients that have established associations with our outcomes. All statistical analyses were performed using the Statistical Analysis Software, version 8.0 (SAS Institute, Inc., Cary, North Carolina), and S-Plus (Mathsoft, Seattle,
at Life Science Library- Sinica on July 8, 2010 http://aje.oxfordjournals.orgDownloaded from
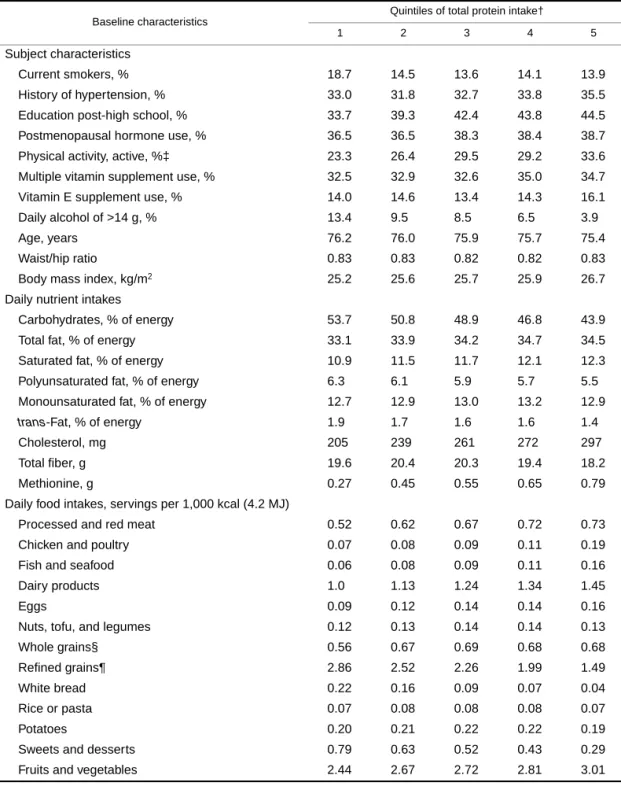
TABLE 1. Distribution of baseline characteristics* of 29,017 postmenopausal Iowa women, across median quintiles of total protein intake, 1986
* Median values or %.
† Total protein intake expressed as percentage of total energy by quintile: quintile 1, 14.1%; quintile 2, 16.3%; quintile 3, 17.8%; quintile 4, 19.4%; quintile 5, 22.0%.
‡ Physical activity, active: either moderate activity for more than four times per week or vigorous activity for one or more times per week.
§ A composite of dark bread, brown rice, oatmeal, whole-grain breakfast cereal, bran, wheat germ, and other grains such as bulgar, kasha, and couscous.
¶ A composite of rice, pasta, potatoes, refined cold breakfast cereal, muffins, snack foods, sweetened sodas, pizza, chocolate, candy, cakes, cookies, donuts, pastries, and pies.
Baseline characteristics Quintiles of total protein intake†
1 2 3 4 5
Subject characteristics
Current smokers, % 18.7 14.5 13.6 14.1 13.9
History of hypertension, % 33.0 31.8 32.7 33.8 35.5
Education post-high school, % 33.7 39.3 42.4 43.8 44.5
Postmenopausal hormone use, % 36.5 36.5 38.3 38.4 38.7
Physical activity, active, %‡ 23.3 26.4 29.5 29.2 33.6
Multiple vitamin supplement use, % 32.5 32.9 32.6 35.0 34.7
Vitamin E supplement use, % 14.0 14.6 13.4 14.3 16.1
Daily alcohol of >14 g, % 13.4 9.5 8.5 6.5 3.9
Age, years 76.2 76.0 75.9 75.7 75.4
Waist/hip ratio 0.83 0.83 0.82 0.82 0.83
Body mass index, kg/m2 25.2 25.6 25.7 25.9 26.7
Daily nutrient intakes
Carbohydrates, % of energy 53.7 50.8 48.9 46.8 43.9
Total fat, % of energy 33.1 33.9 34.2 34.7 34.5
Saturated fat, % of energy 10.9 11.5 11.7 12.1 12.3
Polyunsaturated fat, % of energy 6.3 6.1 5.9 5.7 5.5
Monounsaturated fat, % of energy 12.7 12.9 13.0 13.2 12.9
trans-Fat, % of energy 1.9 1.7 1.6 1.6 1.4
Cholesterol, mg 205 239 261 272 297
Total fiber, g 19.6 20.4 20.3 19.4 18.2
Methionine, g 0.27 0.45 0.55 0.65 0.79
Daily food intakes, servings per 1,000 kcal (4.2 MJ)
Processed and red meat 0.52 0.62 0.67 0.72 0.73
Chicken and poultry 0.07 0.08 0.09 0.11 0.19
Fish and seafood 0.06 0.08 0.09 0.11 0.16
Dairy products 1.0 1.13 1.24 1.34 1.45
Eggs 0.09 0.12 0.14 0.14 0.16
Nuts, tofu, and legumes 0.12 0.13 0.14 0.14 0.13
Whole grains§ 0.56 0.67 0.69 0.68 0.68
Refined grains¶ 2.86 2.52 2.26 1.99 1.49
White bread 0.22 0.16 0.09 0.07 0.04
Rice or pasta 0.07 0.08 0.08 0.08 0.07
Potatoes 0.20 0.21 0.22 0.22 0.19
Sweets and desserts 0.79 0.63 0.52 0.43 0.29
Fruits and vegetables 2.44 2.67 2.72 2.81 3.01
at Life Science Library- Sinica on July 8, 2010 http://aje.oxfordjournals.orgDownloaded from
Washington) software systems. All p values are based on two-sided tests.
RESULTS
Through December 31, 2000, representing 475,755 person-years of follow-up, we documented 4,843 new cancers, 739 CHD deaths, 1,676 cancer deaths, and 3,978 deaths from all causes. Increasing protein intake was posi- tively associated with higher education, physical activity, dietary cholesterol, methionine, and servings of meat, fish, dairy products, and eggs and inversely associated with the proportion of current smokers, intakes of alcohol of more than 14 g/day (approximately one drink), carbohydrate, and servings of refined grains and of sweets and desserts (table 1). Modest or no associations were observed with hyperten- sion, postmenopausal hormone use, body mass index, intakes of vitamins, dietary fats, fiber, and servings of nuts/ tofu/legumes, whole grains, and fruits and vegetables.
We did not observe any statistically significant associa- tions for CHD mortality from substituting an isoenergetic quantity of total protein (protein from all sources combined) or animal protein (protein from meat, poultry, dairy, fish, and eggs) for the same amount of energy from carbohydrate
(table 2). However, a 40 percent decreased risk was observed in the macronutrient-adjusted analyses (95 percent confi- dence interval (CI): 0.46, 0.79; ptrend = 0.0001) among women in the highest quintile compared with the lowest quintile of vegetable protein intake (representing a differ- ence of 2.4 percent of total energy) when substituted in place of the same percentage of total energy from carbohydrate. The association was attenuated yet remained statistically significant following additional adjustment for potential confounding variables (for the highest quintile: risk ratio = 0.70, 95 percent CI: 0.49, 0.99; ptrend = 0.02). Because women who consume diets higher in vegetable proteins may also have greater intakes of micronutrients such as magne- sium, potassium, zinc, copper, niacin, vitamin B12, or flavones, we further adjusted the data for each of these vari- ables individually, but our results were not appreciably changed.
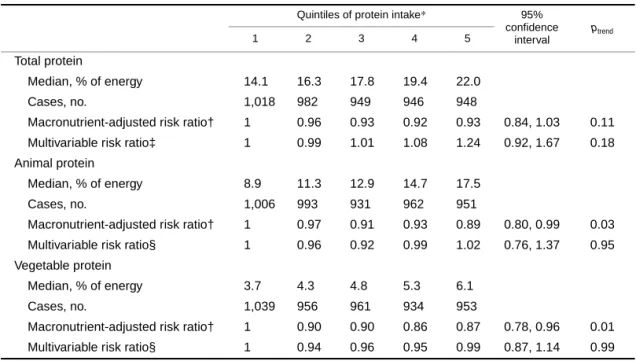
The results for cancer incidence are shown in table 3 and those for cancer mortality in table 4. For both outcomes, we did not observe any statistically significant associations from substituting an isoenergetic amount of total protein for the same amount of energy from carbohydrate. An isoenergetic substitution of animal protein for carbohydrate (8.6 percent) was associated with a decreased risk in the macronutrient-
TABLE 2. Risk ratios of coronary heart disease mortality according to quintiles of protein intake substituted for an isoenergetic amount of carbohydrate, among 29,017 postmenopausal Iowa women, 1986–2000
*Protein intake expressed as percentage of energy.
† Adjusted for age, total energy, saturated fat, polyunsaturated fat, monounsaturated fat, and trans-fat (expressed as percentage of energy and categorized into quintiles).
‡ Also adjusted for total fiber, dietary cholesterol, dietary methionine (all quintiles are based on energy-adjusted values), alcohol (≤14 g/day vs. >14 g/day), smoking (never, former, current), activity level (active vs. not active), body mass index (<21.0, 21.0–22.9, 23.0–24.9, 25.0–28.9, ≥29.0), history of hypertension, postmenopausal hormone use, multivitamin use, vitamin E supplement use, education (high school education or less vs. post-high school), and family history of cancer.
§ In addition to all of the above variables, the animal protein model is also adjusted for vegetable protein and vice versa.
Quintiles of protein intake* 95% confidence
interval
ptrend
1 2 3 4 5
Total protein
Median, % of energy 14.1 16.3 17.8 19.4 22.0
Cases, no. 168 141 132 152 146
Macronutrient-adjusted risk ratio† 1 0.84 0.78 0.89 0.85 0.66, 1.09 0.35
Multivariable risk ratio‡ 1 0.72 0.56 0.71 0.84 0.39, 1.79 0.62
Animal protein
Median, % of energy 8.9 11.3 12.9 14.7 17.5
Cases, no. 149 148 144 147 151
Macronutrient-adjusted risk ratio† 1 0.96 0.91 0.88 0.83 0.64, 1.09 0.16
Multivariable risk ratio§ 1 0.99 0.88 0.81 0.88 0.42, 1.86 0.29
Vegetable protein
Median, % of energy 3.7 4.3 4.8 5.3 6.1
Cases, no. 184 155 145 132 123
Macronutrient-adjusted risk ratio† 1 0.83 0.77 0.67 0.60 0.46, 0.79 0.0001
Multivariable risk ratio§ 1 0.88 0.86 0.75 0.70 0.49, 0.99 0.02
at Life Science Library- Sinica on July 8, 2010 http://aje.oxfordjournals.orgDownloaded from
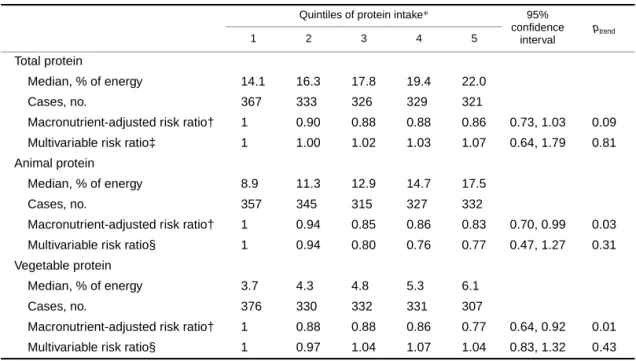
adjusted analyses for cancer incidence and for cancer mortality, although the associations were no longer signifi- cant following additional adjustment for covariates. An isoenergetic (2.4 percent) substitution of vegetable protein for carbohydrate was also associated with a decreased risk in the macronutrient-adjusted analyses for cancer incidence and for cancer mortality. However, both associations were no longer evident following control for other covariates.
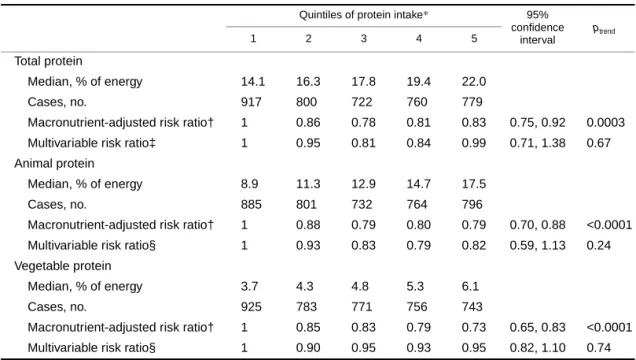
For all-cause mortality, the macronutrient-adjusted anal- yses showed statistically significant inverse associations when carbohydrate was exchanged with an isoenergetic quantity of total protein, animal protein, and vegetable protein (table 5). In analyses controlling for additional vari- ables, however, all associations were attenuated and were no longer statistically significant.
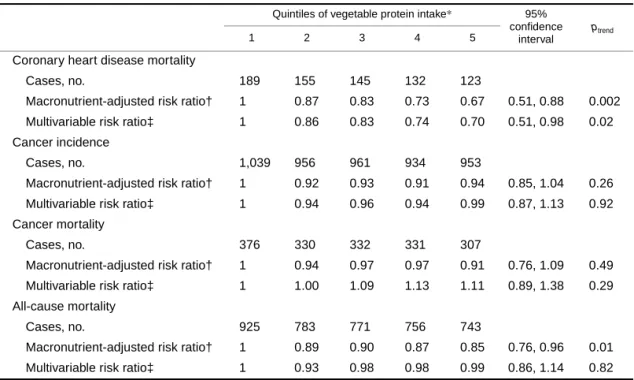
In order to compare protein sources with the different outcomes, we evaluated the association of substituting vege- table protein for animal protein while simultaneously controlling for carbohydrate, a change that would be expected if one were following a vegetarian diet (table 6). In the macronutrient-adjusted analyses, this substitution was associated with a statistically significant decreased risk of CHD mortality and of all-cause mortality. Following addi- tional adjustment for other covariates, only the association
with CHD mortality remained significant and resulted in a 30 percent decreased risk among women in the highest compared with lowest category of vegetable-for-animal protein intake (95 percent CI: 0.51, 0.98; ptrend = 0.02). The results were relatively unchanged with further adjustment for micronutrients such as magnesium and zinc.
We also examined the association of different food sources of protein in place of carbohydrate-dense foods, standardized as servings per 1,000 kcal (4.2 MJ) (table 7). For CHD mortality, multivariable-adjusted analyses showed a significant increased risk of 41 percent for dairy servings and 44 percent for red meat servings for the highest compared with lowest quintile of intake, when substituted in place of an isoenergetic number of servings of carbohydrate- rich foods, and a 17 percent decreased risk for the highest compared with lowest quintile of legume intake, although the association was only marginally statistically significant (ptrend = 0.08). In other words, a daily substitution of 0.9 serv- ings of red meat per 1,000 kcal (4.2 MJ) in place of a similar number of servings of carbohydrate-dense foods was associ- ated with a 44 percent increased risk of CHD mortality (see table 7 for range of food servings). For cancer mortality, intake of legumes in the highest compared with lowest quin- tile when substituted for an isoenergetic quantity of carbohy-
TABLE 3. Risk ratios of cancer incidence according to quintiles of protein intake substituted for an isoenergetic amount of carbohydrate among 29,017 postmenopausal Iowa women, 1986–2000
*Protein intake expressed as percentage of energy.
† Adjusted for age, total energy, saturated fat, polyunsaturated fat, monounsaturated fat, and trans-fat (expressed as percentage of energy and categorized into quintiles).
‡ Also adjusted for total fiber, dietary cholesterol, dietary methionine (all quintiles are based on energy-adjusted values), alcohol (≤14 g/day vs. >14 g/day), smoking (never, former, current), activity level (active vs. not active), body mass index (<21.0, 21.0–22.9, 23.0–24.9, 25.0–28.9, ≥29.0), history of hypertension, postmenopausal hormone use, multivitamin use, vitamin E supplement use, education (high school education or less vs. post-high school), and family history of cancer.
§ In addition to all of the above variables, the animal protein model is also adjusted for vegetable protein and vice versa.
Quintiles of protein intake* 95% confidence
interval
ptrend
1 2 3 4 5
Total protein
Median, % of energy 14.1 16.3 17.8 19.4 22.0
Cases, no. 1,018 982 949 946 948
Macronutrient-adjusted risk ratio† 1 0.96 0.93 0.92 0.93 0.84, 1.03 0.11
Multivariable risk ratio‡ 1 0.99 1.01 1.08 1.24 0.92, 1.67 0.18
Animal protein
Median, % of energy 8.9 11.3 12.9 14.7 17.5
Cases, no. 1,006 993 931 962 951
Macronutrient-adjusted risk ratio† 1 0.97 0.91 0.93 0.89 0.80, 0.99 0.03
Multivariable risk ratio§ 1 0.96 0.92 0.99 1.02 0.76, 1.37 0.95
Vegetable protein
Median, % of energy 3.7 4.3 4.8 5.3 6.1
Cases, no. 1,039 956 961 934 953
Macronutrient-adjusted risk ratio† 1 0.90 0.90 0.86 0.87 0.78, 0.96 0.01
Multivariable risk ratio§ 1 0.94 0.96 0.95 0.99 0.87, 1.14 0.99
at Life Science Library- Sinica on July 8, 2010 http://aje.oxfordjournals.orgDownloaded from
drate food servings was associated with a 23 percent increased risk (ptrend = 0.02). For all-cause mortality, red meat servings in the highest compared with lowest quintile of intake were associated with a 16 percent increased risk when substituted for an isoenergetic quantity of carbohy- drate food servings (ptrend = 0.02). The results were essen- tially unchanged following adjustment for additional micronutrients including total and heme iron (data not shown).
Some popular high-protein diets do not distinguish between types of carbohydrate and suggest that all carbohy- drate foods be replaced with protein foods. To evaluate the association with the different outcomes of substituting high- protein foods for refined carbohydrate foods only, we also performed secondary analyses and simultaneously controlled for whole-grain foods (data not shown). The risk ratios were virtually identical for all outcomes.
DISCUSSION
In this prospective study of over 29,000 postmenopausal women followed for 15 years, we found inverse associations of vegetable protein and legume food sources and positive associations of dairy and red meat food sources for CHD mortality when substituted in place of carbohydrate. Red
meat food sources were also associated with increased risk for all-cause mortality but not for any cancer outcome.
Our results suggest that animal protein and total carbohy- drate may have similar potentially adverse effects on CHD mortality compared with vegetable protein, because an inverse association was observed when vegetable protein replaced either carbohydrate or animal protein and because no association was observed when animal protein replaced carbohydrate. Although animal protein per se was not asso- ciated with any of the outcomes, a composite of red and processed meat servings in place of carbohydrate food serv- ings was associated with a 44 percent increased risk of CHD mortality, and a similar increased risk was observed with dairy servings. Modest associations were also found with all- cause mortality and persisted despite adjustment for dietary fats and cholesterol. Indeed, the weak association of dietary fats across quintiles of total protein intake in this study supports the notion that our findings are unlikely to be from confounding by these variables. The apparent discrepancy between the animal protein and food group analyses may be from the inability to differentiate among the effects of proteins derived from different animal sources when using the nutrient value, suggesting that protein sources may differ in their metabolic effects.
TABLE 4. Risk ratios of cancer mortality according to quintiles of protein intake substituted for an isoenergetic amount of carbohydrate among 29,017 postmenopausal Iowa women, 1986–2000
*Protein intake expressed as percentage of energy.
† Adjusted for age, total energy, saturated fat, polyunsaturated fat, monounsaturated fat, and trans-fat (expressed as percentage of energy and categorized into quintiles).
‡ Also adjusted for total fiber, dietary cholesterol, dietary methionine (all quintiles are based on energy-adjusted values), alcohol (≤14 g/day vs. >14 g/day), smoking (never, former, current), activity level (active vs. not active), body mass index (<21.0, 21.0–22.9, 23.0–24.9, 25.0–28.9, ≥29.0), history of hypertension, postmenopausal hormone use, multivitamin use, vitamin E supplement use, education (high school education or less vs. post-high school), and family history of cancer.
§ In addition to all of the above variables, the animal protein model is also adjusted for vegetable protein and vice versa.
Quintiles of protein intake* 95% confidence
interval
ptrend
1 2 3 4 5
Total protein
Median, % of energy 14.1 16.3 17.8 19.4 22.0
Cases, no. 367 333 326 329 321
Macronutrient-adjusted risk ratio† 1 0.90 0.88 0.88 0.86 0.73, 1.03 0.09
Multivariable risk ratio‡ 1 1.00 1.02 1.03 1.07 0.64, 1.79 0.81
Animal protein
Median, % of energy 8.9 11.3 12.9 14.7 17.5
Cases, no. 357 345 315 327 332
Macronutrient-adjusted risk ratio† 1 0.94 0.85 0.86 0.83 0.70, 0.99 0.03
Multivariable risk ratio§ 1 0.94 0.80 0.76 0.77 0.47, 1.27 0.31
Vegetable protein
Median, % of energy 3.7 4.3 4.8 5.3 6.1
Cases, no. 376 330 332 331 307
Macronutrient-adjusted risk ratio† 1 0.88 0.88 0.86 0.77 0.64, 0.92 0.01
Multivariable risk ratio§ 1 0.97 1.04 1.07 1.04 0.83, 1.32 0.43
at Life Science Library- Sinica on July 8, 2010 http://aje.oxfordjournals.orgDownloaded from
Our data also provide evidence that reduced risk of CHD mortality may be obtained from the substitution of vegetable protein sources from the legume food group that included dried beans, tofu, nuts, and peanut butter for carbohydrate foods. The observed inverse trend with legume foods was unchanged regardless of whether we substituted legumes for all carbohydrate-rich foods or for only refined carbohydrate foods with simultaneous control for whole-grain foods. Indeed, all risk ratios for all outcomes were unchanged when only refined carbohydrate foods were used as the referent. This likely reflects the small contribution of whole-grain, compared with refined grain, food intake to total carbohy- drate consumption in these Iowa women (table 1) despite the reported inverse association of whole-grain foods with CHD and all-cause mortality in this cohort (23, 24). Thus, one would not expect to see substantial differences in results comparing protein intake with total or refined carbohydrate intake. Our current findings therefore do not negate the apparent beneficial effects of increasing whole-grain intake and the carbohydrate that would come along with such food choices.
The reduced risk of CHD mortality from substitution of legume foods for refined carbohydrates may be from the diminution in the diet of highly refined carbohydrates that
may have high glycemic indices (25), which are associated with CHD and its risk factors (8–11, 24), and possibly from the addition of constituents that are associated with legumes and that may decrease the risk of CHD. In addition to their higher protein content compared with other vegetable foods, legumes and nuts are also lower in their glycemic index (25) and are sources of other nutrients that may be important in the pathogenesis of CHD, such as magnesium (26), copper (27), phytosterols and antioxidants (28), and arginine, the precursor of nitric oxide which is an endothelium-derived relaxing factor (29). However, our findings persisted despite additional adjustment for those micronutrients for which we had available data. A previous analysis in this cohort observed an attenuated risk reduction of 28 percent for CHD mortality (ptrend = 0.11) from consumption of nuts and seeds following adjustment for vitamin E (30). In the current anal- yses, our composite index of legume foods also included dried beans and tofu. Nutrients unique to these foods other than vitamin E may explain why additional adjustment for vitamin E (whether from supplements only or from dietary plus supplemental sources combined) did not attenuate the association with CHD risk.
The distribution of protein intake in this cohort was similar to that from a large prospective study of US nurses, as was
TABLE 5. Risk ratios of all-cause mortality according to quintiles of protein intake substituted for an isoenergetic amount of carbohydrate among 29,017 postmenopausal Iowa women, 1986–2000
*Protein intake expressed as percentage of energy.
† Adjusted for age, total energy, saturated fat, polyunsaturated fat, monounsaturated fat, and trans-fat (expressed as percentage of energy and categorized into quintiles).
‡ Also adjusted for total fiber, dietary cholesterol, dietary methionine (all quintiles are based on energy-adjusted values), alcohol (≤14 g/day vs. >14 g/day), smoking (never, former, current), activity level (active vs. not active), body mass index (<21.0, 21.0–22.9, 23.0–24.9, 25.0–28.9, ≥29.0), history of hypertension, postmenopausal hormone use, multivitamin use, vitamin E supplement use, education (high school education or less vs. post-high school), and family history of cancer.
§ In addition to all of the above variables, the animal protein model is also adjusted for vegetable protein and vice versa.
Quintiles of protein intake* 95% confidence
interval
ptrend
1 2 3 4 5
Total protein
Median, % of energy 14.1 16.3 17.8 19.4 22.0
Cases, no. 917 800 722 760 779
Macronutrient-adjusted risk ratio† 1 0.86 0.78 0.81 0.83 0.75, 0.92 0.0003
Multivariable risk ratio‡ 1 0.95 0.81 0.84 0.99 0.71, 1.38 0.67
Animal protein
Median, % of energy 8.9 11.3 12.9 14.7 17.5
Cases, no. 885 801 732 764 796
Macronutrient-adjusted risk ratio† 1 0.88 0.79 0.80 0.79 0.70, 0.88 <0.0001
Multivariable risk ratio§ 1 0.93 0.83 0.79 0.82 0.59, 1.13 0.24
Vegetable protein
Median, % of energy 3.7 4.3 4.8 5.3 6.1
Cases, no. 925 783 771 756 743
Macronutrient-adjusted risk ratio† 1 0.85 0.83 0.79 0.73 0.65, 0.83 <0.0001
Multivariable risk ratio§ 1 0.90 0.95 0.93 0.95 0.82, 1.10 0.74
at Life Science Library- Sinica on July 8, 2010 http://aje.oxfordjournals.orgDownloaded from
the distribution of various covariates, such as body mass index and physical activity, across quintiles of increasing protein intake (12). In that study, Hu et al. observed that an isoenergetic substitution of total protein for dietary carbohy- drate was associated with a 26 percent lower risk of incident ischemic heart disease. Both vegetable and animal protein appeared to lower risk from 11 percent to 16 percent, respec- tively, although the associations were not statistically signif- icant. The results from several short-term human metabolic experiments that substituted at least 30 percent of total energy from animal protein for carbohydrate suggested that the protective association may be from favorable changes in serum lipids, blood glucose, and plasma insulin (8–11). However, changes in serum lipid fractions related to higher animal protein intake may not translate to a beneficial CHD risk factor profile (31). In other epidemiologic investiga- tions, meat consumption was positively associated with fatal ischemic heart disease during a 20-year follow-up study of 25,153 California Seventh-day Adventists (32). This associ- ation was apparently not due to confounding by eggs, dairy products, obesity, marital status, or cigarette smoking. During a 14-year follow-up of 80,082 US women, a higher ratio of red meat to poultry and fish consumption was asso- ciated with a significantly increased risk of incident cases of
major CHD events independent of major risk factors (33). Among 57,031 postmenopausal women in the same cohort, processed meat (hot dog, bacon, sausage, salami, and bologna) was significantly associated with a 44 percent increased risk of CHD, independent of other CHD risk factors including iron or total red meat intake (34).
Our findings and those of others suggest that factors uniquely associated with meat proteins may potentiate CHD morbidity and mortality. Although animal studies suggest that heterocyclic aromatic amines may be involved in the development of atherosclerosis (35), red meat protein was not associated with cancer incidence in this study, possibly because the relation is stronger for specific cancer sites in this cohort, such as breast cancer (36) and potentially colon cancer. Further, only well-done and charred meats contain heterocyclic amines and thus may not be accurately repre- sented by our composite measure of red and processed meats that comprise various degrees of doneness. However, in our study, dairy products, which do not contain heterocyclic aromatic amines, increased the risk for CHD mortality to a similar magnitude as did red meat. It has been suggested (37) that dairy and meat products, the two largest contributors to animal protein in our cohort (table 1), may increase CHD risk via methionine, the dietary precursor to homocysteine
TABLE 6. Risk ratios across median quintiles of vegetable protein intake substituted for an isoenergetic amount of animal protein for different outcomes among 29,017 postmenopausal Iowa women, 1986–2000
*Vegetable protein intake expressed as percentage of total energy by quintile: quintile 1, 3.7%; quintile 2, 4.3%; quintile 3, 4.8%; quintile 4, 5.3%; quintile 5, 6.1%.
† Adjusted for age, total energy, carbohydrate, saturated fat, polyunsaturated fat, monounsaturated fat, and trans-fat (expressed as percentage of energy and categorized into quintiles).
‡ Also adjusted for total fiber, dietary cholesterol, dietary methionine (all quintiles are based on energy-adjusted values), alcohol (≤14 g/day vs. >14 g/day), smoking (never, former, current), activity level (active vs. not active), body mass index (<21.0, 21.0–22.9, 23.0–24.9, 25.0–28.9, ≥29.0), history of hypertension, postmenopausal hormone use, multivitamin use, vitamin E supplement use, education (high school education or less vs. post-high school), and family history of cancer.
Quintiles of vegetable protein intake* 95% confidence
interval
ptrend
1 2 3 4 5
Coronary heart disease mortality
Cases, no. 189 155 145 132 123
Macronutrient-adjusted risk ratio† 1 0.87 0.83 0.73 0.67 0.51, 0.88 0.002
Multivariable risk ratio‡ 1 0.86 0.83 0.74 0.70 0.51, 0.98 0.02
Cancer incidence
Cases, no. 1,039 956 961 934 953
Macronutrient-adjusted risk ratio† 1 0.92 0.93 0.91 0.94 0.85, 1.04 0.26
Multivariable risk ratio‡ 1 0.94 0.96 0.94 0.99 0.87, 1.13 0.92
Cancer mortality
Cases, no. 376 330 332 331 307
Macronutrient-adjusted risk ratio† 1 0.94 0.97 0.97 0.91 0.76, 1.09 0.49
Multivariable risk ratio‡ 1 1.00 1.09 1.13 1.11 0.89, 1.38 0.29
All-cause mortality
Cases, no. 925 783 771 756 743
Macronutrient-adjusted risk ratio† 1 0.89 0.90 0.87 0.85 0.76, 0.96 0.01
Multivariable risk ratio‡ 1 0.93 0.98 0.98 0.99 0.86, 1.14 0.82
at Life Science Library- Sinica on July 8, 2010 http://aje.oxfordjournals.orgDownloaded from
production. Although dietary methionine is positively asso- ciated with homocysteine (38), our findings were not appre- ciably altered when methionine was excluded from the analyses. Other metabolic studies reported increases of 24- hour urinary free cortisol concentrations following a diet in
which the percentage of total energy as protein was increased from 15 percent to 30 percent (39) and increases of postmeal serum cortisol in subjects consuming a 40 percent protein diet ingested as three identical meals over a 12-hour period of time (40). The metabolic consequences of a dietary
TABLE 7. Multivariable* risk ratios according to quintiles of various protein-rich food groups substituted for an isoenergetic amount of all carbohydrate-rich foods† for different outcomes among 29,017
postmenopausal Iowa women, 1986–2000
* Each variable is adjusted for the variables in the footnotes of table 5 in addition to all the variables in table 7 and servings of fruits and vegetables excluding potatoes (expressed as servings per 1,000 kcal (4.2 MJ)).
† A composite of refined carbohydrates (rice, pasta, potatoes, refined cold breakfast cereal, muffins, snack foods, sweetened sodas, pizza, chocolate, candy, cakes, cookies, donuts, pastries, pies) and whole-grain carbohydrates (dark bread, brown rice, oatmeal, whole-grain breakfast cereal, bran, wheat germ, and other grains such as bulgar, kasha, and couscous).
‡ Median servings per 1,000 kcal (4.2 MJ) between extreme quintiles are as follows: legumes, 0.08 and 0.56; dairy and eggs, 0.60 and 2.74; red meats, 0.28 and 1.20; poultry, 0.04 and 0.30; fish, 0 and 0.28.
§ A composite of tofu, dried beans, nuts, and peanut butter.
¶ A composite of milk, cream, ice cream, yogurt, and cheese.
# A composite of beef, pork, and processed meat.
**A composite of chicken and turkey.
†† A composite of fresh fish, canned fish, and seafood.
Quintiles of intake‡ 95%
confidence interval
ptrend
1 2 3 4 5
Coronary heart disease mortality
Legumes§ 1 0.89 0.91 0.81 0.83 0.65, 1.07 0.08
Dairy¶ 1 1.13 1.26 1.26 1.41 1.07, 1.87 0.02
Eggs 1 1.15 1.15 0.84 1.04 0.75, 1.45 0.53
Red meats# 1 1.10 1.09 1.29 1.44 1.06, 1.94 0.02
Poultry** 1 0.94 1.06 0.98 0.93 0.71, 1.23 0.79
Fish†† 1 0.89 0.82 0.76 1.12 0.86, 1.46 0.95
Cancer incidence
Legumes 1 1.08 0.98 1.10 1.05 0.95, 1.16 0.34
Dairy 1 1.02 1.03 0.97 1.04 0.93, 1.16 0.87
Eggs 1 1.01 0.93 1.06 1.02 0.89, 1.16 0.61
Red meats 1 1.02 0.97 0.98 0.97 0.86, 1.10 0.64
Poultry 1 1.00 1.01 1.06 1.05 0.94, 1.17 0.18
Fish 1 1.07 1.04 1.04 0.98 0.88, 1.09 0.74
Cancer mortality
Legumes 1 1.17 1.14 1.23 1.23 1.04, 1.46 0.02
Dairy 1 0.98 1.08 0.87 0.97 0.80, 1.17 0.43
Eggs 1 0.90 0.88 0.96 0.96 0.77, 1.20 0.85
Red meats 1 0.93 0.87 0.92 1.04 0.85, 1.27 0.52
Poultry 1 0.92 1.01 1.12 1.04 0.87, 1.24 0.15
Fish 1 0.97 0.98 1.01 0.87 0.72, 1.04 0.32
All-cause mortality
Legumes 1 1.03 0.99 1.08 1.10 0.99, 1.23 0.09
Dairy 1 1.03 1.05 0.98 1.10 0.97, 1.24 0.36
Eggs 1 0.97 0.95 0.96 0.95 0.82, 1.09 0.39
Red meats 1 0.97 0.98 1.05 1.16 1.02, 1.32 0.02
Poultry 1 0.93 1.01 1.04 1.00 0.89, 1.13 0.48
Fish 1 0.91 0.94 0.91 0.97 0.86, 1.09 0.34
at Life Science Library- Sinica on July 8, 2010 http://aje.oxfordjournals.orgDownloaded from
protein-stimulated increase in cortisol production are unknown. Future studies are needed to address the mecha- nism(s) by which dietary proteins over the long-term may exert an effect on CHD and cancer.
An unexpected finding from our data was the observed positive association of legume intake with cancer mortality. This nuance in the data is difficult to explain and may be a reflection of using mortality measures for our outcome, which could be difficult to interpret if participants changed their pattern of intake following a morbid event during follow-up. This is less likely to be of a concern for CHD mortality, as prolonged survival after a sudden ischemic event is less likely than after a diagnosis of cancer. In addi- tion, the consistency in our findings of an inverse association of vegetable protein, and a positive association of animal protein and red meat servings, for CHD mortality is strength- ened by others’ reports that protein sources may exert differ- ential effects in the pathogenesis of CHD.
Finally, our results raise doubts about the safety of long- term adherence to diets that favor animal protein, particu- larly red/processed meat or dairy servings, in place of carbo- hydrate foods or vegetable sources of protein. It is important to note that the potential adverse effects of mortality from CHD and from all causes observed in this investigation were from intakes of approximately 22 percent of energy from total protein (tables 2 and 5), of which the majority was of animal origin, and not from a high-protein intake, generally defined as 30 percent or more of total energy from protein intake. Yet, surprisingly modest substitutions of specific animal sources of proteins for carbohydrate appeared to be associated with adverse effects. Our results, together with the lack of benefit to sustained weight loss due to consump- tion of a high-animal-protein diet such as promoted by Atkins and tested in a recent randomized trial (41), do not support any salutary gain of these diets and suggest potential harm.
Our study has several strengths. The prospective nature of our data collection discounts any biases associated with recall of diet and lifestyle behaviors. The use of a large, well- defined sample derived from a general population permits the generalizability of our findings, at least to older Cauca- sian females. We were also able to adjust for multiple confounding and potential risk factors. Further, it was reasonable to assume that, with a high-protein diet, the natural substitution would be for carbohydrate rather than dietary fats, since fats as a percentage of energy appear to be only modestly associated with increasing protein in this cohort (table 1), and the comparison with carbohydrate is typical in metabolic studies because it is the largest source of energy in most diets (22).
Our study also has potential limitations. First, diet was assessed once in 1986, and dietary changes may have occurred from the baseline period to the present, possibly biasing our associations. Systematic errors in measuring diet can also bias associations. However, if this were the case, we would not have expected to see different associations of protein intake for the different outcomes. Second, we were unable to examine whether intermediate variables, such as serum lipid, glucose, or insulin concentrations, could account for the associations that we found, as reported in the
short-term metabolic studies that replaced dietary protein for carbohydrate because blood samples were not collected. Third, we were unable to assess the impact on our outcomes of weight change as a consequence of nutrient or food substi- tutions. Although controlling for weight change may help to explain the mechanism by which dietary substitutions are associated with our outcomes, it would not preclude performing such dietary substitution analyses. Fourth, we recognize that, in performing food substitution analyses, we may also be measuring the effect on CHD mortality and other outcomes of nonprotein components of these foods. We controlled for dietary fats, cholesterol, fiber, and multi- vitamin and individual micronutrient intake to better isolate the effect on our outcomes of the protein in these foods sepa- rate from the effects of other nutrients that have established associations with our outcomes. However, confounding by unmeasured constituents associated with plant proteins cannot be excluded. Despite the limitations of this approach, these analyses are included in this report because these substitutions realistically represent typical dietary changes.
In conclusion, dietary proteins from animal and vegetable food sources appear to be differentially associated with mortality from CHD and all causes when substituted for carbohydrates in the diet. Long-term adherence to popular high-protein diets, without discrimination toward protein source, may have potentially adverse health consequences.
ACKNOWLEDGMENTS
The Iowa Women’s Health Study was funded by grant R01 CA39742, and Dr. Kelemen was supported by Mayo Clinic genetic epidemiology training grant R25 CA92049, both from the National Cancer Institute.
REFERENCES
1. Carroll KK. Dietary protein in relation to plasma cholesterol levels and atherosclerosis. Nutr Rev 1978;36:1–5.
2. Tominaga S, Kuroishi T. An ecological study on diet/nutrition and cancer in Japan. Int J Cancer 1997;10(suppl):2–6. 3. Kritchevsky D. Dietary protein, cholesterol and atherosclerosis:
a review of the early history. J Nutr 1995;125(suppl):589S– 93S.
4. Katan MB, Vroomen LHM, Hermus RJJ. Reduction of casein- induced hypercholesterolaemia and atherosclerosis in rabbits and rats by dietary glycine, arginine and alanine.
Atherosclerosis 1982;43:381–91.
5. Carroll KK, Hamilton RMG. Effects of dietary protein and car- bohydrate levels in relation to atherosclerosis. J Food Sci 1975; 40:18–23.
6. Carroll KK. Hypercholesterolemia and atherosclerosis: effects of dietary protein. Fed Proc 1982;41:2792–800.
7. Kritchevsky D, Tepper SA, Czarnecki SK, et al. Experimental atherosclerosis in rabbits fed cholesterol-free diets. Part 9. Beef protein and textured vegetable protein. Atherosclerosis 1981; 39:169–75.
8. Wolfe BM, Piche LA. Replacement of carbohydrate by protein in a conventional-fat diet reduces cholesterol and triglyceride concentrations in healthy normolipidemic subjects. Clin Invest
at Life Science Library- Sinica on July 8, 2010 http://aje.oxfordjournals.orgDownloaded from
Med 1999;22:140–8.
9. Wolfe BM. Potential role of raising dietary protein intake for reducing the risk of atherosclerosis. Can J Cardiol 1995; 11(suppl):127G–31G.
10. Dumesnil JG, Turgeon J, Tremblay A, et al. Effect of a low-gly- caemic index–low-fat–high-protein diet on the atherogenic metabolic risk profile of abdominally obese men. Br J Nutr 2001;86:557–68.
11. Gannon MC, Nuttall FQ, Saeed A, et al. An increase in dietary protein improves the blood glucose response in persons with type 2 diabetes. Am J Clin Nutr 2003;78:734–41.
12. Hu FB, Stampfer MJ, Manson JE, et al. Dietary protein and risk of ischemic heart disease in women. Am J Clin Nutr 1999;70: 221–7.
13. Sinha R. An epidemiologic approach to studying heterocyclic amines. Mutat Res 2002;506–507:197–204.
14. Gooderham NJ, Murray S, Lynch AM, et al. Assessing human risk to heterocyclic amines. Mutat Res 1997;376:53–60. 15. Sugimura T. Nutrition and dietary carcinogens. Carcinogenesis
2000;21:387–95.
16. Bisgard KM, Folsom AR, Hong CP, et al. Mortality and cancer rates in nonrespondents to a prospective study of older women: 5-year follow-up. Am J Epidemiol 1994;139:990–1000. 17. Rimm EB, Giovannucci EL, Stampfer MJ, et al. Reproducibil-
ity and validity of an expanded self-administered semiquantita- tive food frequency questionnaire among male health professionals. Am J Epidemiol 1992;135:1114–26.
18. Munger RG, Folsom AR, Kushi LH, et al. Dietary assessment of older Iowa women with a food frequency questionnaire: nutrient intake, reproducibility, and comparison with 24-hour dietary recall interviews. Am J Epidemiol 1992;136:192–200. 19. US Department of Health and Human Services. SEER Pro-
gram: cancer incidence and mortality in the United States. Bethesda, MD: National Cancer Institute, 1984:1073–81. 20. Willett W, Stampfer MJ. Total energy intake: implications for
epidemiologic analyses. Am J Epidemiol 1986;124:17–27. 21. Korn EL, Graubard BI, Midthune D. Time-to-event analysis of
longitudinal follow-up of a survey: choice of the time-scale. Am J Epidemiol 1997;145:72–80.
22. Willett WC. Nutritional epidemiology. 2nd ed. New York, NY: Oxford University Press, 1998.
23. Jacobs DR Jr, Meyer KA, Kushi LH, et al. Is whole grain intake associated with reduced total and cause-specific death rates in older women? The Iowa Women’s Health Study. Am J Public Health 1999;89:322–9.
24. Jacobs DR Jr, Meyer KA, Kushi LH, et al. Whole grain intake may reduce the risk of ischemic heart disease death in post- menopausal women: the Iowa Women’s Health Study. Am J
Clin Nutr 1998;68:248–57.
25. Foster-Powell K, Holt SH, Brand-Miller JC. International table of glycemic index and glycemic load values: 2002. Am J Clin Nutr 2002;76:5–56.
26. Elin RJ, Hosseini JM. Is the magnesium content of nuts a factor for coronary heart disease? (Letter). Arch Intern Med 1993;153: 79.
27. Klevay LM. Copper in nuts may lower heart disease risk. (Let- ter). Arch Intern Med 1993;153:401–2.
28. Fraser GE. Diet and coronary heart disease: beyond dietary fats and low-density-lipoprotein cholesterol. Am J Clin Nutr 1994; 59(suppl):1117S–23S.
29. Cooke JP. Is atherosclerosis an arginine deficiency disease? J Invest Med 1998;46:377–80.
30. Kushi LH, Folsom AR, Prineas RJ, et al. Dietary antioxidant vitamins and death from coronary heart disease in postmeno- pausal women. N Engl J Med 1996;334:1156–62.
31. Bonow RO, Eckel RH. Diet, obesity, and cardiovascular risk. (Editorial). N Engl J Med 2003;348:2057–8.
32. Snowdon DA, Phillips RL, Fraser GE. Meat consumption and fatal ischemic heart disease. Prev Med 1984;13:490–500. 33. Hu FB, Stampfer MJ, Manson JE, et al. Dietary saturated fats
and their food sources in relation to the risk of coronary heart disease in women. Am J Clin Nutr 1999;70:1001–8.
34. Liu J, Stampfer MJ, Hu FB, et al. Dietary iron and red meat intake and risk of coronary heart disease in postmenopausal women. (Abstract). Am J Epidemiol 2003;157(suppl):S100. 35. Wakabayashi K. Animal studies suggesting involvement of
mutagen/carcinogen exposure in atherosclerosis. (ICPEMC working paper 7/1/3). Mutat Res 1990;239:181–7.
36. Zheng W, Gustafson DR, Sinha R, et al. Well-done meat intake and the risk of breast cancer. J Natl Cancer Inst 1998;90:1724– 9.
37. Grant WB. Milk and other dietary influences on coronary heart disease. Altern Med Rev 1998;3:281–94.
38. Jacques PF, Bostom AG, Wilson PWF, et al. Determinants of plasma total homocysteine concentration in the Framingham Offspring cohort. Am J Clin Nutr 2001;73:613–21.
39. Nuttall FQ, Gannon MC, Saeed A, et al. The metabolic response of subjects with type 2 diabetes to a high-protein, weight-maintenance diet. J Clin Endocrinol Metab 2003;88: 3577–83.
40. Slag MF, Ahmed M, Gannon MC, et al. Meal stimulation of cortisol secretion: a protein induced effect. Metabolism 1981; 30:1104–8.
41. Foster GD, Wyatt HR, Hill JO, et al. A randomized trial of a low-carbohydrate diet for obesity. N Engl J Med 2003;348: 2082–90.
at Life Science Library- Sinica on July 8, 2010 http://aje.oxfordjournals.orgDownloaded from