sustainability
ISSN 2071-1050 www.mdpi.com/journal/sustainability ArticleEvaluation of Different Urban Microclimate Mitigation
Strategies through a PMV Analysis
Ferdinando Salata 1,*, Iacopo Golasi 1, Emanuele de Lieto Vollaro 2, Fabio Bisegna 1, Fabio Nardecchia 1, Massimo Coppi 1, Franco Gugliermetti 1 and Andrea de Lieto Vollaro 1
1 DIAEE-Area Fisica Tecnica, Università degli Studi di Roma “Sapienza”, Via Eudossiana,
18-00184 Rome, Italy; E-Mails: [email protected] (I.G.); [email protected] (F.B.); [email protected] (F.N.); [email protected] (M.C.);
[email protected] (F.G.); [email protected] (A.L.V.)
2 DIMI-Università degli Studi “Roma TRE”, Via Vito Volterra, 62-00146 Rome, Italy;
E-Mail: [email protected]
* Author to whom correspondence should be addressed; E-Mail: [email protected]; Tel.: +39-06-44585661; Fax: +39-06-4880120.
Academic Editor: Marc A. Rosen
Received: 28 May 2015 / Accepted: 7 July 2015 / Published: 10 July 2015
Keywords: outdoor thermal comfort; PMV; mitigation strategies; urban microclimate; ENVI-met
1. Introduction
During the past few years, the urbanization process caused atmospheric changes, which led to higher temperatures in cities than those characterizing the surrounding non-urban areas.
The examination of such phenomenon started in the XIX century [1] and lately it has caught the attention of the international scientific community, as showed by some studies carried out in different countries: Lodz (Poland) [2], Athens (Greece) [3], Beijing (China) [4], Aveiro (Portugal) [5].
This phenomenon, together with an increase in temperature in the cities, is the result of urban/rural energy budget differences [6]. For what concerns the radiation balance, the differences between urban and rural areas are not that significant [6,7] and the larger nighttime radiative loss determined by the high emissivity [8] compensates for the higher amount of energy input in the daytime in urban areas determined by a low albedo [8]. The increase in temperature in urban areas is so connected to the type of materials used. For example, the vegetation tends to cover just a small part of the surface in cities, thus the evapotranspiration is highly reduced and urban areas convert their radiant energy into sensible heat rather than latent heat [6]. The change of urban energy budget determined by a low albedo and the reduced evapotranspiration cause a higher urban energy input in the daytime [8]. Such excess of energy is usually stored: the thermal properties (e.g., heat capacity, thermal conductivity) of the materials used in the cities and the complex and traditional urban morphology increase the heat flux stored in these areas [9–13]. The surfaces start releasing the stored energy during the night [8], slowing down the cooling process in the cities and determining a temperature difference between urban and rural areas.
Sky view factor values are also able to facilitate the sensible heat stored at lower layers: in fact, during the night a low sky view factor reduces the disposal of the longwave radiation in urban areas determining temperature differences between urban and rural areas that can be 3.3 times higher than those measured during the daytime [14] where the energy budget is regulated by the incident solar radiation [15].
ground-level water surfaces [33] and roof ponds [34], vegetated surfaces [35], rooftop gardens [36–40], and trees [27,41].
This paper, through the examination of a case study concerning the Cloister of San Pietro in Vincoli (placed right inside the Faculty of Engineering of the Sapienza University of Rome), evaluates how some of the mitigation strategies previously mentioned affect the microclimate and the outdoor thermal comfort. Particular attention is given to the influence determined by the presence of high albedo materials (characterized by higher values of the reflectance in the region of infrared and lower values in the region of visible) and some vegetation: this is the reason why different configurations of the site were compared. The selected performance metric is then the comfort sensation of a pedestrian standing in the Cloister, whereas the outdoor thermal comfort is estimated through the PMV (Predicted Mean Vote). This index, developed by Fanger [42], it is based on 1565 thermal comfort questionnaires distributed for the evaluation of the thermoigrometric qualities of indoor spaces and it was then adapted to outdoor spaces taking into account the presence of solar radiation [43]. It takes into consideration the following environment variables: air temperature, mean radiant temperature, relative humidity, wind speed and some operative variables as clothing insulation and the metabolic rate. 2. Case Study
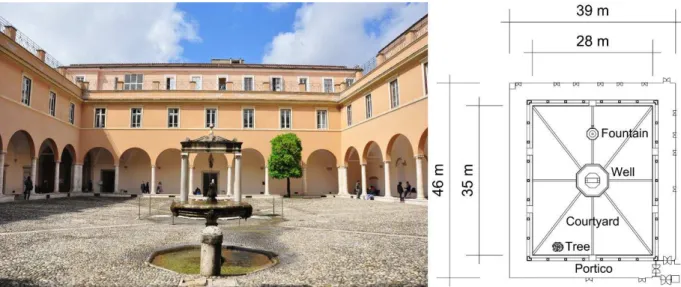
The case study of this paper focuses on the Cloister of San Pietro in Vincoli (Figure 1), placed next to the basilica with the same name and right inside the Faculty of Engineering of the “Sapienza” University of Rome.
Figure 1. Dimensions and present configuration of the Cloister of the Faculty of Engineering of the “Sapienza” University.
For what concerns the city of Rome, it is characterized by a latitude of 41°55′N, a longitude of 12°29′E and a height of 20 m above the sea level [44]. It is the most populated and the widest city of Italy respectively with 2,844,821 inhabitants and 1285.30 km2.
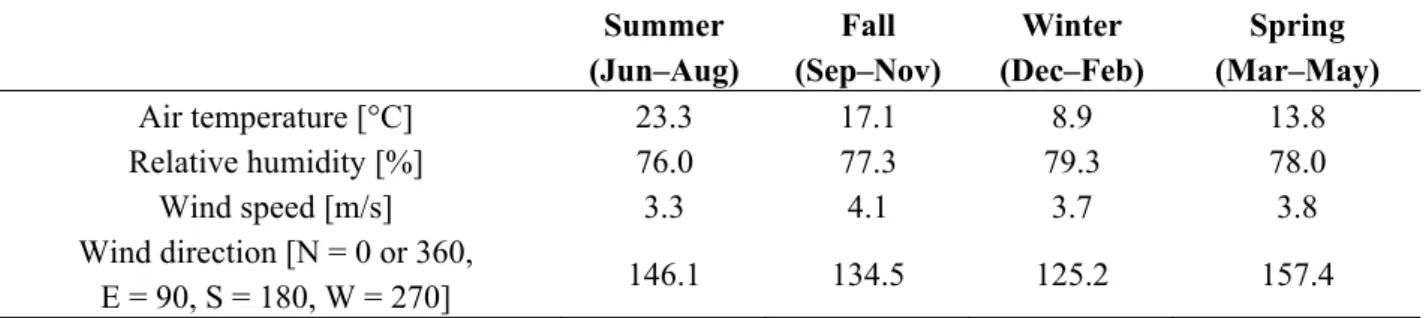
It is characterized by the typical Mediterranean climate, mild and comforting in the spring and fall. Spring and autumn are then the rainiest seasons, especially in November and April. The summer is hot, humid and usually with infrequent precipitation, whereas the winter is rainy and rarely cold. Table 1 shows the average values for each season of the most important meteorological variables [45–47].
Table 1. Average values for all seasons of the air temperature, relative humidity, wind speed and direction in Rome.
Summer (Jun–Aug)
Fall (Sep–Nov)
Winter (Dec–Feb)
Spring (Mar–May)
Air temperature [°C] 23.3 17.1 8.9 13.8 Relative humidity [%] 76.0 77.3 79.3 78.0 Wind speed [m/s] 3.3 4.1 3.7 3.8 Wind direction [N = 0 or 360,
E = 90, S = 180, W = 270] 146.1 134.5 125.2 157.4
According to Köppen classification, this climate belongs to the Csa category [48] (Figure 2).
Figure 2. Köppen climate classification.
Table 2. Description of the symbols of Köppen climate classification and defining criteria (for C category, representing mild climates).
1st 2nd 3rd Description Criteria
C Mild THOT > 10 and 0 < TCOLD < 18
s Dry summer PSDRY < 40 and PSDRY < PWWET/3
w Dry winter PWDRY < PSWET/10
f Without dry season Not (Cs) or (Cw) a Hot summer THOT≥ 22
b Warm summer Not (a) and TMON10≥ 4
c Cold summer Not (a or b) and 1 ≤ TMON10 < 4
3. Other Configurations of the Site
In order to make an evaluation of how the urban context affects the thermal comfort in the Mediterranean area, the present configuration of the Cloister is compared to other four configurations.
The present configuration (conf. 1) is the one that has been characterizing the Cloister since the latest building restructuring: the basic surface of the yard is made of cobblestones, while the portico of ceramic tiles. For what concerns the vertical limits of the structure, they present painted lime plaster.
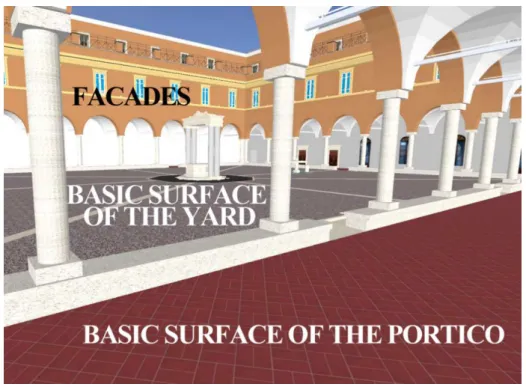
In order to evaluate how vegetation and a higher albedo coefficient affect human thermal sensations, four different configurations by changing the materials of the facades and of the basic surface of the yard have been designed. The surfaces are reported in Figure 3.
Figure 3. 3D-model of the Cloisterand identification of the various surfaces.
Figure 4. Cloister: on the left conf. 2 with the garden (picture taken in the 90s), on the right conf. 1 with cobblestones (present days).
In the second alternative configuration (conf. 3), the albedo coefficient of the yard increases while the facades remain unchanged (as in conf. 1 and in conf. 2).
In the third alternative configuration (conf. 4), the structural solution presents a higher albedo coefficient characterizing the facades and the yard surface.
Finally, the fourth alternative configuration (conf. 5) combines both mitigation strategies: it is characterized by a lawn and some vegetation in the yard and, at the same time, the albedo coefficient of the facades increases.
Table 3 reports the planning choices of each configuration.
Table 3. Planning choices of the five configurations examined.
Present Conf. Alternative Confs.
Conf. 1 Conf. 2 Conf. 3 Conf. 4 Conf. 5
Facades
Painted lime plaster X X X High albedo
material X X
Basic surface of the yard
Cobblestone X High albedo
material X X
Lawn and
vegetation X X
Basic surface of the portico Ceramic tiles X X X X X
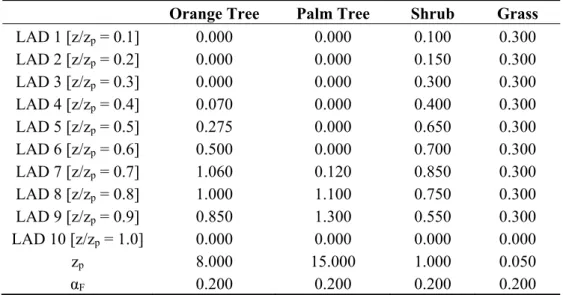
Configurations 2 and 5 also present, besides the lawn, 12 orange trees, two palms and six shrubs. In order to recognize the characteristics of each plant, Table 4 reports: the height zP, albedo coefficient αF
= −− − −− (1)
Table 4. Leaf Area Density values, height and albedo coefficient of the plants characterizing configurations 2 and 5.
Orange Tree Palm Tree Shrub Grass
LAD 1 [z/zp = 0.1] 0.000 0.000 0.100 0.300
LAD 2 [z/zp = 0.2] 0.000 0.000 0.150 0.300
LAD 3 [z/zp = 0.3] 0.000 0.000 0.300 0.300
LAD 4 [z/zp = 0.4] 0.070 0.000 0.400 0.300
LAD 5 [z/zp = 0.5] 0.275 0.000 0.650 0.300
LAD 6 [z/zp = 0.6] 0.500 0.000 0.700 0.300
LAD 7 [z/zp = 0.7] 1.060 0.120 0.850 0.300
LAD 8 [z/zp = 0.8] 1.000 1.100 0.750 0.300
LAD 9 [z/zp = 0.9] 0.850 1.300 0.550 0.300
LAD 10 [z/zp = 1.0] 0.000 0.000 0.000 0.000
zp 8.000 15.000 1.000 0.050
αF 0.200 0.200 0.200 0.200
Then, Table 5 reports some thermophysical properties of the materials characterizing the limits surfaces of the structure in every configuration:
Table 5. Thermophysical properties of the materials used for the limits surfaces of the Cloister.
Painted Lime Plaster High Albedo Material Cobblestone Ceramic Tiles
εS 0.900 0.890 0.900 0.880
αS 0.270 0.660 0.400 0.370
In detail, the high albedo material coefficients were chosen according to previous research [50] related to the development of innovative materials with the same spectral response of those used in historical centers in the visible region, but high reflectance in another solar spectrum range. In this way, it is possible to respect the architectural restrictions of the historical buildings.
4. The Software: ENVI-met
In order to evaluate how the different mitigation strategies affect the microclimate and outdoor thermal comfort, ENVI-met was the prediction software used [51,52]. It is a 3D prognostic microclimate model designed to simulate the interactions among buildings, surfaces, vegetation and air in an urban context. It relies on the fundamental laws of fluid dynamics and thermodynamics and it can be used with a typical resolution of 0.5–10 m in space and 1–10 s in time. The model can simulate:
- flow around and between buildings;
- exchange processes of heat and vapor at urban surfaces; - turbulence;
The main input parameters of an ENVI-met simulation include: weather conditions, initial soil wetness and temperature profiles, structures and physical properties of urban surfaces, and plants. Several scientific studies certify its reliability [53,54]. The software is able to calculate the values of several meteorological and microclimatic variables (e.g., wind speed and direction, potential temperature, specific humidity, relative humidity, mean radiant temperature, direct, diffuse and reflected shortwave radiation, longwave radiation) and the PMV (Predicted Mean Vote); it also takes into consideration how evapotranspiration phenomena, determined by the presence of vegetation and permeable soils, affect this index thus ensuring a comparison, as in this paper, of different mitigation strategies.
5. The PMV
As previously mentioned, different mitigation strategies are compared thanks to the PMV (Predicted Mean Vote) [42]. This is a thermal comfort index which at first was developed for indoor environments based on some tests (1,565 people were surveyed). Afterwards, it was modified and adapted to examine outdoor environments as well [43].
The PMV predicts the mean value of the votes of a large group of persons and it is defined as follows [55]:
= . ⋅ . + . 8 ⋅
(2) where M is the metabolic rate and S is the storage deriving from the energy budget equation describing the heat exchange between the human body and the thermal environment. The equation is defined as follows:
+ + , + , + , + , + , = (3)
where W is the physical work output; Q is the radiation budget, a function of mean radiant temperature TMR and air velocity v; QH is the turbulent heat flux of sensible heat, a function of air temperature TA
and air velocity v; QL is the latent heat flow due to evaporation of moisture diffused through the skin, a
function of air humidity e and velocity v; QSW is the latent heat flow from sweat evaporation; QRE is
the respiratory heat flux (sensible and latent). Each term of Equation (3) is expressed in [W/m2] and it is positive if it is representative of energy benefit to the body: this is why M is always positive while W, QL and QSW are always negative.
For what concerns the PMV scale it ranges between −4 (very cold) and +4 (very hot) where 0 is the thermal neutral (comfort) value. It should not be forgotten that the PMV is a function of the local climate and its values can exceed the interval (−4) ÷ (+4). The PMV is then a stationary value and this means that a person is supposed to be exposed for a long time to a certain climatic situation until the energy exchange processes with the human body will be stationary.
carried out a cross-sectional investigation in five different Tunisian cities finding a correlation coefficient of about 0.71. Differently, the results of a study conducted by Cheng et al. [62] in Hong Kong show that PMV generally overestimates the thermal sensation towards the warmer end of the scale in summer and vice versa in winter. Thorsson et al. [63] reached similar conclusions in the city of Göteborg (Sweden): they compared thermal sensations assessed by the PMV and thermal sensations obtained through interviews finding that the PMV curve was skewed towards the warm zone. Another study was carried by Mahmoud [64] in Egypt and it examined nine zones representing various spaces inside an urban park located in Cairo: even if this study used the PET (Physiological Equivalent Temperature) [65], the authors highlighted how, for one of these zones, the calculated PMV was not significantly different from the mean thermal sensation vote obtained from subjective questionnaires. Finally, Oertel et al. [66] carried out a study in Glasgow (UK) and they found a satisfactory similarity between the PMV and the actual thermal sensation votes derived from outdoor surveys.
6. Simulations
The ENVI-met software performed some simulations to compare different mitigation strategies. This is the reason why it was developed a 3D model of the Cloister of San Pietro in Vincoli together with a mesh of (27 × 30) horizontal cells and 29 vertical cells; the horizontal spacing is of 2 m, while the vertical one is of 0.5 m where 0 m ≤ z ≤ 3 m; differently for higher heights, the vertical spacing is calculated through the following relationship:
ℎ = ℎ + ⋅ ℎ (4)
where s represents the extension factor equal to 20%.
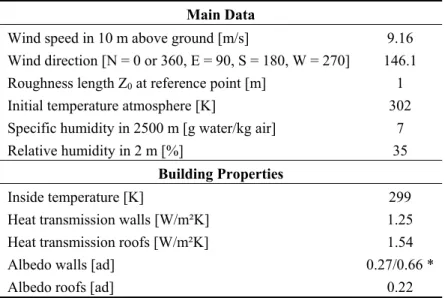
For what concerns the simulations, as demonstrated in other works, the choice of the input parameters is very important. For this reason, every simulation was performed with a 2 s time step. The simulations presented then a variation in the structural solution of the vertical and horizontal limits of the site examined (Tables 3–5), whereas the environmental and meteorological input parameters and the settings for the PMV estimation were the same (Table 6).
Table 6. Input parameters for the ENVI-met simulations. Main Data
Wind speed in 10 m above ground [m/s] 9.16 Wind direction [N = 0 or 360, E = 90, S = 180, W = 270] 146.1 Roughness length Z0 at reference point [m] 1
Initial temperature atmosphere [K] 302 Specific humidity in 2500 m [g water/kg air] 7 Relative humidity in 2 m [%] 35
Building Properties
Inside temperature [K] 299
Heat transmission walls [W/m²K] 1.25 Heat transmission roofs [W/m²K] 1.54
Albedo walls [ad] 0.27/0.66 *
Table 6. Cont. Settings for Soil
Initial temperature upper layer (0–20 cm) [K] 292 Initial temperature middle layer (20–50 cm) [K] 291 Initial temperature deep layer (below 50 cm) [K] 289 Relative humidity upper layer (0–20 cm) [%] 50 Relative humidity middle layer (20–50 cm) [%] 60 Relative humidity deep layer (below 50 cm) [%] 60
Clouds
Fraction of low clouds [x/8] 0 Fraction of medium clouds [x/8] 0 Fraction of high clouds [x/8] 0
Settings for PMV-Calculation
Walking speed [m/s] 0.0
Metabolic rate [W/m2] 70
Mechanical factor 0.0
Thermal resistance of clothing [clo] 0.35
* This value depends on the choices made for each configuration (Tables 3 and 5).
Table 6 reports the main data inserted into the software to reproduce a typical summer day. The wind speed, in 10 m above the ground level, was estimated through Equation (5) [67]:
= (5)
In this case study, where an urban area is examined and giving v as the value reported in Table 1, R is 0.36 [67] and therefore v10 is 9.16.
For what concerns the wind direction the value was of 146.1, representing the direction where it presents the highest frequency during the summer (Table 1); on the other hand the choice of the roughness length Z0 depends on the position of the site examined in the urban area.
Then, it is important to specify that the initial temperature of the atmosphere is expressed in potential temperature, referable to the absolute temperature through Equation (6):
= ⋅ (6)
where:
− is the potential temperature [K]; − TA is the air temperature [K];
− P1 is the pressure whose value is used to calculate TA [hPa]; − K = 0.286.
Deciding which building properties to select depends on the direct observation of the site [68–72], while the inside temperature of indoor spaces is set to 299 K [73].
medium and high altitude to reproduce a day characterized by a cloudless sky and high values of direct shortwave radiation.
On the other hand, to make an estimation of the PMV, it was taken into consideration the thermal sensation of a person standing in the site (with a metabolic rate M of 70 W/m2 and with a
mechanical factor of 0.0), whereas the clothing thermal resistance was assumed to be of 0.35 clo (1 clo = 0.155 m2K/W). Such value represents the thermal resistance of a typical summer clothing and
this choice, as the one concerning the activity performed by the person (serving as a sample), depends on a direct observation of the people attending the site examined.
7. Results and Discussions
The results provided by the simulations gave the possibility to compare, in terms of the PMV, the effectiveness of the different mitigation strategies (Figure 5). This is why the PMV is evaluated at the height of 1.1 m on the ground level, representing the height of the human body centre of gravity of people standing [75]. Afterwards, the case study focused on a typical summer day because the Mediterranean climate presents higher thermal stresses affecting people during the summer (the hottest summer month reports an average temperature higher than 22 °C [48]).
Figure 5. PMV maps of the different configurations.
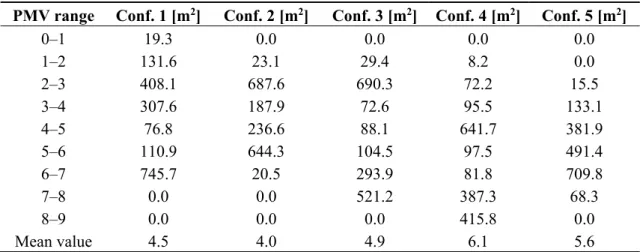
Table 7. PMV analysis of each configuration.
PMV range Conf. 1 [m2] Conf. 2 [m2] Conf. 3 [m2] Conf. 4 [m2] Conf. 5 [m2]
0–1 19.3 0.0 0.0 0.0 0.0 1–2 131.6 23.1 29.4 8.2 0.0 2–3 408.1 687.6 690.3 72.2 15.5 3–4 307.6 187.9 72.6 95.5 133.1
4–5 76.8 236.6 88.1 641.7 381.9
5–6 110.9 644.3 104.5 97.5 491.4 6–7 745.7 20.5 293.9 81.8 709.8
7–8 0.0 0.0 521.2 387.3 68.3
8–9 0.0 0.0 0.0 415.8 0.0
Mean value 4.5 4.0 4.9 6.1 5.6
While examining the results, it was possible to note how the best solution is configuration 2. In this configuration, the hypothetical intervention is restricted to the basic surface of the yard where it is assumed the presence of lawn and vegetation. The mean PMV is 4.0 and there are no sections of the surface belonging to categories 7–8 and 8–9; a wide part of the surface belongs to categories 2–3 (687.6 m2).
Even in configuration 1 (the present one, which presents painted lime plaster on the facades and cobblestones on the Cloister yard), there are no sections in the Cloister belonging to category 7–8 and 8–9; what happens though is that a considerable part (745.7 m2) belongs to category 6–7 and, in this way, the PMV value becomes 4.5.
Configuration 4 is then the worst: it is characterized by an increase of the albedo coefficient on both the facades and the yard floor. This determines a mean PMV of 6.1 due to a high contribution of categories 7–8 and 8–9 respectively of 387.3 m2 and 415.8 m2.
The same situation is reported in configuration 5 with the exertion of high albedo materials on the walls causing a deterioration of the outdoor thermal comfort, only in part mitigated by the lawn. The mean PMV is of 5.6 and this value is affected by the 709.8 m2 (category 6–7) and 491.4 m2 (category 5–6).
The exertion of a high albedo material just for the yard determines a less significant deterioration: in fact configuration 3 presents a mean PMV of 4.9. In this case it is possible to note the 690.3 m2 of
category 2–3 and 521.2 m2 of category 7–8.
Examining the results reported in Table 7 and observing Figure 4, it is possible to see how there is an improvement of the thermohygrometric conditions thanks to the presence of some vegetation while the exertion of high albedo materials (in urban contexts particularly enclosed as the one studied) determines a deterioration of the microclimate.
low level reflection and a high thermal capacity provoking cooling and humidification processes thanks to evapotranspiration phenomena, hence a decrease in air temperature).
On the other hand, configurations with a higher albedo coefficient lead to a deterioration of the outdoor thermal comfort due to an increase in the reflected radiation which in turn determines a sensible heat storage in the lower layers. This is determined by the multiple reflections being established, because of the low sky view factor of the surfaces characterized by a higher albedo, between the limits of the site examined, leading to an increase in the mean radiant temperature. From this point of view and with reference to the actual configuration of the site (configuration 1), it should be kept in mind that the exertion of a high albedo material on the basic surface of the yard (configuration 3) determines a reduction of the air temperature of about 0.3 °C but at the same time an increase of the mean radiant temperature of about 7 °C [78]. Differently, those configurations characterized by a higher albedo coefficient of the facades show an increase of air temperature and mean radiant temperature, for instance in configuration 4 equal to 1.5 °C and about 20 °C, respectively [78].
For what concerns the fountain, from the analysis of Figure 4 it is possible to notice how it determines a very localized improvement of the outdoor thermal comfort. This improvement, for those standing in the surrounding area, is due to the reduction of the Bowen ratio (defined as the ratio between the sensible and latent heat flux) and to a decrease in the mean radiant temperature.
Finally, it is interesting to analyze the influence of the wind: Figure 4 reports a decrease of the PMV value right in the area of the portico placed between the two entrances where this variable reaches the highest values and the convective heat transfer increases.
8. Conclusions
This paper compared, through simulations performed thanks to the ENVI-met software, different microclimatic mitigation strategies in an urban context to evaluate their effect on the outdoor thermal comfort in a particular enclosed structural configuration. The case study was carried out in the Cloister of San Pietro in Vincoli with an area of 1,800 m2, situated inside the Faculty of Engineering of the Sapienza University of Rome, during a typical summer day. For what concerns the PMV, the present configuration of the site was compared to another four configurations characterized by different solutions for both the vertical and horizontal limits of the structure. Particular attention was given to the influence of the vegetation and to the use of high albedo materials.
The use of this kind of materials in particular enclosed urban contexts causes a microclimatic deterioration, hence higher thermal stresses. This increase is inversely proportional to the sky view factor of the surfaces with a high albedo.
In the case study, a higher albedo on the yard surface determines an increase of the mean PMV of about 0.4 units in respect to the present configuration; whereas if the facades are also made of a high albedo material, the mean PMV is 1.6 units higher.
Finally, the presence of lawn, trees and shrubs leads to an improvement of the outdoor thermal comfort if the facades do not change: in this case, the magnitude of the multiple reflections inside the structure decreases and the reduction of the mean PMV is about 0.5 units.
Acknowledgments
This research received no specific grant from any funding agency in the public, commercial, or not-for-profit sectors. A special thanks to Flavia Franco for the help she provided in the preparation of this paper.
Author Contributions
The study was designed by Ferdinando Salata, Iacopo Golasi, Franco Gugliermetti and Andrea de Lieto Vollaro. Emanuele de Lieto Vollaro, Fabio Bisegna and Fabio Nardecchia retrieved the data from yearbooks and professional websites and reviewed the literature related to the research. The results were then analysed by Ferdinando Salata, Iacopo Golasi, Massimo Coppi and Fabio Bisegna. Model design and English corrections were undertaken by Emanuele de Lieto Vollaro and Fabio Nardecchia. Finally, Franco Gugliermetti and Andrea de Lieto Vollaro, the full professors of the research group, supervised the work related to the paper and the execution of its various phases.
Conflicts of Interest
The authors declare no conflicts of interest. Nomenclature
e air humidity [%];
hC vertical spacing of the cell [m];
j factor representing the j-th cell [ad]; K parameter set to 0.286 [ad];
LAD(z) Leaf Area Density [m2/m3];
LADm maximum value of the Leaf Area Density [m2/m3];
M metabolic rate [W/m2];
n parameter set to 6 for z values included between 0 and zm and to 0.5 for z values
included between zm and zP [ad];
p1 pressure whose value is used to determine TA [hPa];
PSDRY precipitation of the driest month during the summer [mm];
PSWET precipitation of the wettest month during the summer [mm];
PWDRY precipitation of the driest month during winter [mm];
PWWET precipitation of the wettest month during winter [mm];
PMV Predicted Mean Vote [ad]; Q radiation budget [W/m2];
QH turbulent heat flux of sensible heat [W/m2];
QRE respiratory heat flux (sensible and latent) [W/m2];
QSW latent heat flux from sweat evaporation [W/m2];
R wind speed ratio [ad];
S storage [W/m2];
TA air temperature [K];
TCOLD temperature of the coldest month [°C];
THOT temperature of the hottest month [°C];
TMON10 months where the temperature is above 10 [ad];
TMR mean radiant temperature [K];
S extension factor [%]; v air velocity [m/s];
v10 air velocity at 10 m from the ground [m/s];
x parameter ranging between 0 and 8 representing the fraction of cloud cover at a certain height [ad];
W physical work output [W/m2];
z height [m];
Z0 roughness length [ad];
zm height where there is the maximum value of LAD [m];
zP height of the plant [m];
Greek letters
αF short-wave albedo of the plant leaf [ad];
αS short-wave albedo of the considered surface [ad];
εS emissivity of the considered surface [ad];
mechanical factor [ad];
potential temperature [K];
References
1. Howard, L. The Climate of London; Harvey and Dorton: London, UK, 1883; Volume I–III.
2. Klyzik, K.; Fortuniak, K. Temporal and spatial characteristics of the urban heat island of Lódz, Poland. Atmos. Environ. 1999, 33, 3885–3895.
3. Livada, I.; Santamouris, M.; Niachou, K.; Papanikolaou, M.; Michalakakou, G. Determination of places in the great Athens area where the heat island effect is observed. Theor. Appl. Cimatol. 2002, 71, 219–230.
4. Miao, S.; Chen, F.; le Mone, A.M.; Tewari, M.; Li, Q.; Wang, Y. An observational and modelling study of characteristics of urban heat island and boundary layer structures in Beijing. J. Appl. Meteorol. Clim. 2009, 48, 484–501.
5. Pinho, O.S.; Manso Orgaz, M.D. The urban heat island in a small city in coastal Portugal. Int. J. Biometeorol. 2002, 44, 198–203.
7. Arnfield, A.J. Two decades of urban climate research: A review of turbulence, exchanges of energy and water, and the urban heat island. Int. J. Climatol. 2003, 23, 1–26.
8. Christen, A.; Vogt, R. Energy and radiation balance of a central European city. Int. J. Climatol. 2004, 24, 1395–1421.
9. Grimmond, C.S.B.; Oke, T.R. Comparison of heat fluxes from summertime observations in the suburbs of four North American cities. J. Appl. Meteorol. 1995, 34, 873–889.
10. Grimmond, C.S.B.; Oke, T.R. Aerodynamic properties of urban areas derived from analysis of surface form. J. Appl. Meteorol. 1999, 38, 1262–1292.
11. Asdrubali, F.; D’Alessandro, F.; Baldinelli, G.; Bianchi, F. Evaluating in situ thermal transmittance of green buildings masonries - A case study. Case Stud. Constr. Mater. 2014, 1, 53–59.
12. Asdrubali, F.; Buratti, C.; Cotana, F.; Baldinelli, G.; Goretti, M.; Moretti, E.; Baldassarri, C.; Belloni, E.; Bianchi, F.; Rotili, A.; et al. Evaluation of Green Buildings’ Overall Performance through in Situ Monitoring and Simulations. Energies 2013, 6, 6525–6547.
13. Bonamente, E.; Rossi, F.; Coccia, V.; Pisello, A.L.; Nicolini, A.; Castellani, B.; Cotana, F.; Filipponi, M.; Morini, E.; Santamouris, M. An energy-balanced analytic model for urban heat canyons: Comparison with experimental data. Adv. Build. Energy Res. 2013, 7, 222–234.
14. Kim, Y.; Baik, J. Maximum urban heat island intensity in Seoul. J. Appl. Meteorol. 2002, 41, 651–659.
15. Memon, R.A.; Leung, D.Y.C.; Liu, C.-H. An investigation of urban heat island intensity (UHII) as an indicator of urban heating. Atmos. Res. 2009, 94, 491–500.
16. Gaitani, N.; Mihalakakou, G.; Santamouris, M. On the use of bioclimatic architecture principles in order to improve thermal comfort conditions in outdoor spaces. Build Environ. 2007, 42, 317–324. 17. Oke, T.R. Initial Guidance to Obtain Representative Meteorological Observations at Urban Sites.
Instruments and Methods of Observation Program; IOM Report No. 81, WMO/TD 1250; World Meteorological Organization: Geneva, Switzerland, 2004.
18. Battista, G.; Evangelisti, L.; Guattari, C.; Basilicata, C.; de Lieto Vollaro, R. Buildings Energy Efficiency: Interventions Analysis under a Smart Cities Approach. Sustainability 2014, 6, 4694–4705. 19. Pisello, A.L.; Asdrubali, F. Human-based energy retrofits in residential buildings: A cost-effective
alternative to traditional physical strategies. Appl. Energy 2014, 133, 224–235.
20. Bianchi, F.; Pisello, A.L.; Baldinelli, G.; Asdrubali, F. Infrared thermography assessment of thermal bridges in building envelope: Experimental validation in a test room setup. Sustainability 2014, 6, 7107–7120.
21. Coppi, M.; Quintino, A.; Salata, F. Numerical study of a vertical channel heated from below to enhance natural ventilation in a residential building. Int. J. Vent. 2013, 12, 41–49.
22. Coppi, M.; Quintino, A.; Salata, F. Fluid dynamic feasibility study of solar chimney in residential buildings. Int. J. Heat Technol. 2011, 29, 1–5.
23. D’Orazio, A.; Fontana, L.; Salata, F. Experimental study of a semi-passive ventilation grille with a feedback control system. Rev. Sci. Instrum. 2011, 82, doi:10.1063/1.3626793.
24. Spagnolo, J.; de Dear, R. A field study of thermal comfort and semioutdoor environments in subtropical Sydney Australia. Build. Environ. 2003, 38, 721–738.
26. Akbari, H.; Pomerantz, M.; Taha, H. Cool surfaces and shade threes to reduce energy use and improve air quality in urban areas. Sol. Energy 2001, 70, 295–310.
27. Rosenfeld, A.; Akbari, H.; Romm, J.J.; Pomerantz, M. Cool communities: Strategies for heat island mitigation and smog reduction. Energy Build. 1998, 28, 51–62.
28. Pisello, A.L.; Rossi, F.; Cotana, F. Summer and winter effect of innovative cool roof tiles on the dynamic thermal behavior of buildings. Energies 2014, 7, 2343–2361.
29. Rosso, F.; Pisello, A.L.; Ferrante, M.; Cotana, F. Integrated Thermal Energy Analysis of Innovative Translucent White Marble for Building Envelope Application. Sustainability 2014, 6, 5439–5462.
30. Baldinelli, G.; Bonafoni, S.; Anniballe, R.; Presciutti, A.; Gioli, B.; Magliulo, V. Spaceborne detection of roof and impervius surface albedo: Potentilities and comparison with airborne thermography measuraments. Sol. Energy 2015, 113, 281–294.
31. He, J.; Hoyano, A. Experimental study of cooling effects of a passive evaporative cooling wall constructed of porous ceramics with high water soaking-up ability. Build Environ. 2010, 45, 461–472. 32. Wanphen, S.; Nagano, K. Experimental study of the performance of porous materials to moderate
the roof surface temperature by its evaporative cooling effect. Build. Environ. 2009, 44, 338–351. 33. Krüger, E.L.; Pearlmutter, D. The effect of urban evaporation on building energy demand in an
arid environment. Energy Build 2008, 40, 2090–2098.
34. Runsheng, T.; Etzion, Y.; Erell, E. Experimental studies on a novel roof pond configuration for the cooling of buildings. Renew Energy 2003, 28, 1513–1522.
35. Alexandri, E.; Jones, P. Temperature decreases in an urban canyon due to green walls and green roofs in diverse climates. Build. Environ. 2008, 43, 480–493.
36. Lui, K.K.Y. Energy efficiency and environmental benefits of rooftop gardens. Constr. Can. 2002, 44, 20–23.
37. Pisello, A.L.; Piselli, C.; Cotana, F. Influence of Human Behavior on Cool Roof Effect for Summer Cooling. Build. Environ. 2015, 88, 116–128.
38. Pisello, A.L.; Pignatta, G.; Castaldo, V.L.; Cotana, F. Experimental analysis of natural gravel covering as cool roofing and cool pavement. Sustainability 2014, 6, 4706–4722.
39. Pisello, A.L.; Santamouris, M.; Cotana, F. Active cool roof effect: Impact of cool roofs on cooling system efficiency. Adv. Build. Energy Res. 2013, 7, 209–221.
40. Ascione, F.; Bianco, N.; de’ Rossi, F.; Turni, G.; Vanoli, G.P. Green roofs in European climates. Are effective solutions for the energy savings in air-conditioning? Appl. Energy 2013, 104, 845–859. 41. Akbari, H. Shade trees reduce building energy use and CO2 emissions from power plants.
Environ. Pollut. 2002, 116, S119–S126.
42. Fanger, P.O. Thermal Comfort; McGraw-Hill: New York, NY, USA, 1972.
43. Jendritzky, G.; Nübler, W. A model analysing the urban thermal environment in physiologically significant terms. Meteorol. Atmos. Phys. 1981, 29, 313–326.
44. Petrarca, S.; Spinelli, F.; Cogliani, E.; Mancini, M. Profilo Climatico Dell’Italia; Edizioni ENEA: Montalcino, Italy, 1999.
46. Gugliermetti, F.; Passerini, G.; Bisegna, F. Climate Models for the Assessment of Office Building Energy Performance. Build. Environ. 2004, 39, 39–50.
47. Gugliermetti, F.; Bisegna, F. Meteorological Days for HVAC System Design in Mediterranean Climate. Build. Environ. 2003, 38, 1063–1074.
48. Köppen, W. Das Geographische System der Climate; Köppen, W., Geiger, R., Eds.; Handbuch der Klimatologie: Berlin, Germany, 1936.
49. Lalic, B.; Mihailovic, D.T. An Empirical relation describing Leaf Area Density inside the forest for environmental modeling. J. Appl. Meteorol. 2004, 43, 641–645.
50. Pisello, A.L.; Cotana, F.; Nicolini, A.; Brinchi, L. Development of clay tile coatings for steep-sloped cool roofs. Energies 2013, 6, 3637–3653.
51. ENVI-Met. 3.1 Manual Contents. Available online: http://www.envi-met.com/ (accessed on 18 February 2015).
52. Bruse, M.; Fleer, H. Simulating surface–plant–air interactions inside urban environments with a three dimensional numerical model. Environ. Model. Softw. 1998, 13, 373–384.
53. Wania, A.; Bruse, M.; Blond, N.; Weber, C. Analysing the influence of different street vegetation on traffic-induced particle dispersion using microscale simulations. J. Environ. Manag. 2012, 94, 91–101.
54. Samaali, M.; Courault, D.; Bruse, M.; Olioso, A.; Occelli, R. Analysis of a 3D boundary layer model at local scale: Validation on soybean surface radiative measurements. Atmos. Res. 2007, 85, 183–198.
55. ASHRAE. Thermal comfort. In ASHRAE Handbook; ASHRAE: Atlanta, GA, USA, 2009; ch. 9. 56. Beuth. Environmental Meteorology—Methods for the Human Biometeorological Evaluation of
Climate and Air Quality for Urban and Regional Planning at Regional Level; Part I: Climate; Beuth Verlag: Berlin, Germany, 2008.
57. ISO 7730. Ergonomics of the Thermal Environment—Analytical Determination and Interpretation of Thermal Comfort using Calculation of the PMV and PPD Indices and Local Thermal Comfort Criteria; International Organization for Standardization: Geneva, Switzerland, 2005.
58. ASHRAE. Thermal Environmental Conditions for Human Occupancy; ASHRAE: Atlanta, GA, USA, 2010.
59. Johansson, E.; Thorsson, S.; Emmanuel, R.; Krüger, E. Instruments and methods in outdoor thermal comfort studies—The need for standardization. Urban Clim. 2014, 10, 346–366.
60. Becker, S.; Potchter, O.; Yaacov, Y. Calculated and observed human thermal sensation in an extremely hot and dry climate. Energy Build. 2003, 35, 747–756.
61. Bouden, C.; Ghrab, N. An adaptive thermal comfort model for the Tunisian context: A field study results. Energy Build. 2005, 37, 952–963.
62. Cheng, V.; Ng, E.; Chan, C.; Givoni, B. Outdoor thermal comfort study in a sub-tropical climate: A longitudinal study based in Hong Kong. Int. J. Biometeorol. 2012, 56, 43–56.
63. Thorsson, S.; Lindqvist, M.; Lindqvist, S. Thermal bioclimatic conditions and patterns of behavior in an urban park in Göteborg, Sweden. Int. J. Biometeorol. 2004, 48, 149–156.
65. Höppe, P. The physiological equivalent temperature—A universal index for the biometeorological assessment of the thermal environment. Int. J. Biometeorol. 1999, 43, 71–75.
66. Oertel, A.; Emmanuel, R.; Drach, P. Assessment of predicted versus measured thermal comfort and optimal comfort ranges in the outdoor environment in the temperate climate of Glasgow, UK. Build. Serv. Eng. Res. Technol. 2015, 36, 482–499.
67. Nikolopoulou, M. Designing Open Spaces in the Urban Environment: A Bioclimatic Approach, Rediscovering the Urban Realm and Open Spaces. In Key Action 4 “City of Tomorrow and Cultural Heritage”; Centre for Renewable Energy Sources, Department of Buildings: Pikermi Attiki, Greece, 2004.
68. Evangelisti, L.; Battista, G.; Guattari, C.; Basilicata, C.; de Lieto Vollaro, R. Analysis of Two Models for Evaluating Energy Performance of Different Buildings. Sustainability 2014, 6, 5311–5321. 69. Evangelisti, L.; Battista, G.; Guattari, C.; Basilicata, C.; de Lieto Vollaro, R. Influence of the
Thermal Inertia in the European Simplified Procedures for the Assessment of Buildings. Sustainability 2014, 6, 4514–4524.
70. De Lieto Vollaro, R.; Evangelisti, L.; Carnielo, E.; Battista, G.; Gori, P.; Guattari, C.; Fanchiotti, A. An integrated approach for an historical buildings energy analysis in a smart cities perspective. Energy Procedia 2014, 45, 372–378.
71. De Lieto Vollaro, R.; Guattari, C.; Evangelisti, L.; Battista, G.; Carnielo, E.; Gori, P. Building energy performance analisys: A case study. Energy Build. 2015, 87, 87–94.
72. De Lieto Vollaro, R.; Calvesi, M.; Battista, G.; Evangelisti, L.; Botta, F. Calculation model for optimization design of the low impact energy systems for buildings. Energy Procedia 2014, 48, 1459–1467.
73. ASHRAE. HVAC Applications. In ASHRAE Handbook; ASHRAE: Atlanta, GA, USA, 2011. 74. Profile soil temperature. Journal of Engineering Geology and Hydrogeology. Available online:
http://qjegh.lyellcollection.org/content/42/3/295/F2.expansion.html (accessed on 18 February 2015). 75. ISO 7726. Ergonomics of the Thermal Environment—Instruments for Measuring Physical
Quantities; International Organization for Standardization: Geneva, Switzerland, 1998.
76. Bottillo, S.; de Lieto Vollaro, A.; Galli, G.; Vallati, A. CFD modeling of the impact of solar radiation in a tridimensional urban canyon at different wind conditions. Sol. Energy 2014, 102, 212–222.
77. Bottillo, S.; de Lieto Vollaro, A.; Galli, G.; Vallati, A. Fluid dynamic and heat transfer parameters in an urban canyon. Sol. Energy 2014, 99, 1–10.
78. Salata, F.; Golasi, I.; de Lieto Vollaro, A.; de Lieto Vollaro, R. How high albedo and traditional buildings’ materials and vegetation affect the quality of urban microclimate. A case study. Energy Build. 2015, 99, 32–49.