IMPACT OF IMMIGRATION ON THE JAPANESE ECONOMY:
A MULTI-COUNTRY SIMULATION MODEL
Abstract
To quantify the impacts of immigration and fiscal reconstruction on the Japanese economy, we present a dynamic computable general equilibrium OLG model with an over lapping generations structure. We use a total of 16 countries and regions, both including those that are industrialized, such as Japan, the US, and the EU, and developing countries, such as China, Brazil, the Philippines, and Peru.
Our simulation results show that a permanent immigration flows of 150,000 will improve the Japanese economy and the welfare of current and future generations. On the other hand, a standalone increase in the consumption tax will not improve long-run welfare. The results indicate that substantially increased inflows of working-age immigrants would alleviate the need for future fiscal reform and also help to dramatically reduce the public pension burden on the working generations.
JEL classification: C68; D9; E62; H5; H6; H55
Keywords: Computable general equilibrium (CGE) model; overlapping generations (OLG); aging; immigration
Manabu Shimasawa
Associate Professor, Akita University, Japan
mshimasawa#ed.akita-u.ac.jp ( # stands for @ )
Kazumasa Oguro
Consulting Fellow, Research Institute of Economy, Trade and Industry, Ministry of Economy, Trade and Industry
and
Senior Research Fellow, Institute for International Policy Studies, Japan
ZVU07057#nifty.com ( # stands for @ )
1. Introduction
Industrialized countries are now facing unprecedented demographic changes which require extensive reform in fiscal systems, social security systems, and other related programs. However, due to conflicting interests between younger and older generations, reform will be politically difficult. As an example from pay-as-you-go pension systems, in order to improve the sustainability of the system, the government has the option of either reducing the benefits to the elderly or increasing the burden on the working generation. Obtaining agreement on reform by both generations is often too difficult for the government to achieve. Some have suggested that immigration may ease these tradeoffs.
The ruling Liberal Democratic Party (LDP) in Japan recently proposed an explicit immigration policy to receive 10 million immigrants in the next 50 years (200,000 annual immigrant flows), a number significantly greater than the annual 68,054 net flow in 2007. The proposed policy increases immigration in order to improve the welfare of both current and future generations. Moreover, some economic organizations, including the largest of them, Nippon Keidanren (Japan Business Federation), also insist that receiving immigrants will maintain the sustainability of the social security system and avert the expected decline in economic growth. To date, however, the economic effects of these proposals have not been rigorously studied.
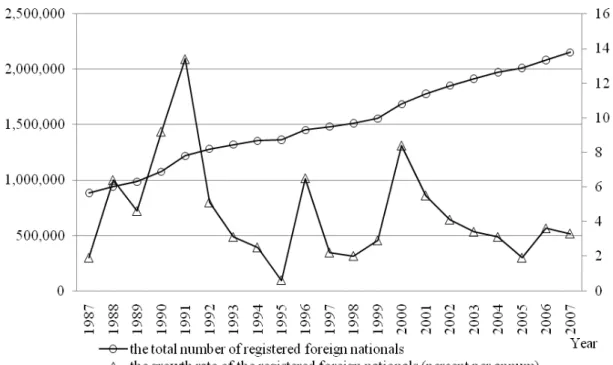
According to statistics published by the Ministry of Justice in 2008, the number of registered foreign nationals residing in Japan has increased every year since 1987 and totaled 2,152,973 as of the end of 2007 (See Figure 1)1. Registered foreign nationals share of the total Japanese population has also increased every year to 1.69% in 2007. By place of origin, China exceeded the Korean peninsula for the first time in 2007, to become the top source of immigrants, followed by the Korean peninsula, Brazil, the Philippines, and Peru.
The aim of this paper is to quantify the impacts of immigration on the Japanese economy. To this end, we use a large-scale dynamic computable general equilibrium model incorporating overlapping generations (OLG) and multiple countries or regions. The 16 countries observed include both industrialized countries and regions such as the US and EU as well as developing countries such as China, Brazil, the Philippines, and Peru.
The application of OLG models to fiscal impacts was pioneered by Auerbach and Kotlikoff (1987). Since then, OLG models have been used extensively to study the impact of population aging and to evaluate various policy changes including tax, pension, and public debt policy.
In the literature, we find only three A-K type OLG simulation models using multiple countries
1 According to the estimation by the Ministry of Economy, Trade and Industry, the number of foreign students
―studying‖ is about 100,000 and the number of trainees is about 90,000 as of the end of 2005. And the Ministry of Justice reported that the number of illegal immigrants is about 113,000 as of the beginning of 2009. Illegal immigrants comprise only 0.09% of the total population. Moreover, the number has decreased consistently from a high of 299,000 in 1993 by 186,000 to the 113,000 number in early 2009. The large majority are Asians, mostly from the Korean peninsula (21.4%), China (16.3%), the Philippines (15.3%), Thailand (5.3%), and Taiwan (4.4%).
to evaluate the effects of global aging on international capital flows and the worldwide economy. These are models by Fehr et al. (2004), Börsch-Supan et al. (2006), and Aglietta et al. (2007).
Fehr et al. (2004) and Börsch-Supan et al. (2006) incorporate only industrialized countries in their model. Although Aglietta et al. (2007) include both industrialized and developing countries, they cover only 19 generations in their model. Moreover, each of these models use the same values of structural parameters such as utility and production for every country.
This study, however, models a 16 industrialized and developing countries covering 65 generations with different values of structural parameters for countries, depending on their development status.
Storesletten (2000) calibrated a general equilibrium OLG model of the US economy, explicitly taking into account the differences between immigrants and natives, to estimate the long-run fiscal impact of immigrants. He found that the fiscal impact of immigration on the host country is positive, even when considering immigrant age and skill level. Meanwhile, Fehr et al. (2004) developed a three-region (US, Japan, and EU) dynamic general equilibrium OLG model to analyze whether immigration can mitigate the negative impacts of demographic transition on an economy. They concluded that immigration will not alter the major negative impacts regardless of the immigrants’ skill level.
However, our method is different from that of Fehr et al. (2004). Their model is based on immigrants coming from countries outside of the model, and does not include the effect that the demographic changes in the out-migration countries have on the in-migration regions (US, Japan, and EU) through the international capital flows. Capital flows are shifted in response to the change in the capital labor ratio within the out-migration countries. To illustrate, consider two cases with only countries A and B. In the first case, part of the working generation emigrates from country A to country B, and in the second case part of the working generation emigrates from outside of both countries to country B. In the first case, the capital labor ratio of A rises and that of B falls, all else equal. In the second case, the capital labor ratio of A does not change and the capital labor ratio of B falls again. It is possible that the post immigration capital labor ratio of B in the first case would be higher than in the second case. Even if the size of immigrant flows are the same in both cases, changes in the capital labor ratio in out-migration countries will be different, which will affect the local use of capital, and hence the worldwide cost of capital differently. If the post immigration worldwide cost of capital is lower in the first case, capital will be used more intensely in country B and the capital labor ratio be higher than the second case. It is also possible that the capital labor ratio of B after immigration could be close to that before immigration in the first case.
In addition, because the Government will consider different policy choices, it is important to analyze the difference between the effects of a temporary and a permanent increase in immigration as well as the difference between an immediate and a delayed increase in immigration. Fehr et al.
(2004) did not consider the effects of these policy variations.
A vast number of studies have applied the OLG model to the problem of aging in Japan, such as Homma et al. (1987), Kato (1998, 2002), Sadahiro and Shimasawa (2001, 2003), Okamoto (2005), and Ihori et al. (2006). In each of these models, the life-cycle hypothesis of consumption serves a crucial role, just as in the A-K type OLG model. These studies found that population aging leads to a sharp reduction in the savings rate, which affects capital formation and factor prices. Therefore, the national economy mirrors the shrinking of the size of the working-age population. Although policy reforms can alleviate the economic burden of an aging population, their simulations showed that there is no easy way to reduce the economic burden from an increase in the ratio of the retirement age to working age population (retiree age ratio).
Those studies consider various policy reforms to cope with aging—reduced pension benefits, increase in taxes, and public debt reduction—but, no research has yet quantified the effects of immigration on the Japanese economy using a general equilibrium model with an OLG structure. To date, immigration has not been studied as a policy instrument to cope with aging in Japan.
Therefore, in this paper, we use a dynamic general equilibrium OLG model calibrated to the Japanese economy in order to quantitatively evaluate the effects of immigration policies intended to cope with population aging in Japan. Multiple countries, including the immigrant suppliers China, South Korea, Philippines, and Peru, are included in the model. By doing this, we attempt to identify which immigration policy changes might result in significant positive effects on the Japanese economy, in terms of the government and public pension budget and citizens’ welfare.
The results show that substantial increased inflows of working-age immigrants would reduce the need for future fiscal reform. Further, findings indicate that immigration can also help to dramatically reduce the public pension burden on the working generations. Our results have several policy implications. In Japan, it is often argued that an increase in immigration would negatively affect the economy by causing a downward spiral of wages for the native workers. According to our findings, these concerns turn out to be largely unnecessary because an increase in immigration reduces the pension tax on wages, increasing the lifetime resources available to workers. Finally, the positive effects are greater if the immigration is permanent rather than temporary, larger in volume, and implemented sooner rather than later, as the LDP and Nippon Keidanren insist. Therefore, the Japanese government should discuss the introduction of an explicit permanent immigration policy as early as possible targeting a large volume of immigants.
In addition, the government is presently promoting Economic Partnership Agreements (EPAs) with East Asian countries in order to share in their dynamic growth. The EPAs include an increase in the entrance of foreign skilled workers (e.g. nurses for elderly assistance etc.). At the same time, the government is also promoting a program aimed at increasing the number of foreign students to 300,000 by around 2020. This foreign student program is being implemented as part of Japan's
global strategy to enhance the nation's international competitiveness in education and research, by attracting exceptional foreign students to study in Japan. The government has also been seeking to expand their employment opportunities in Japan, taking steps to match foreign graduates from Japanese universities with the recruitment needs of Japanese firms. Thus, if foreign graduates have a smooth transition from graduation to employment in Japan, Japanese companies can more easily recruit high quality foreign workers. Therefore, when an explicit immigration policy is discussed, it is important for the government to consider the relationship between immigration policy, EPAs, and the foreign students programs.
The structure of this paper is as follows: In Section 2, we describe the model structure. Section 3 presents the calibration strategy and the findings. Section 4 describes simulation results, and Section 5 contains concluding remarks and policy implications.
2. The Model Structure
In this section, we describe the demographic and economic structure of our model. The model used here is a dynamic computable general equilibrium OLG model with perfect foresight agents, multiple periods, and multiple countries. In our model, there is a representative individual for each generation in the household sector. Each individual at age 20 maximizes his/her intertemporal utility function with consumption and bequest. The representative competitive firm has a standard Cobb-Douglas production technology and is profit maximizing. In our model, not only the goods market but also factor markets are perfectly competitive. The model has five main parts: 1) demographic projection, 2) household behavior, 3) firm behavior, 4) the Government, and 5) the public pension. Details of each part are below. To limit notation, we suppress regional indices to the extent possible. Initial values and parameters for these building blocks will be described in Section 3.
(1) Demographic projection
In our model, the demographic projection is exogenous. In each region, the size of total population of age j in the period t,Nt,jis given recursively by:
j t j t j
t N M
N, 1,1 , for j0, t j
j tj
t f N
N 50 1,
16 ,
0
,
and MMt
jMt,j (1) where Mt,jdenotes the migration in j age-cohort at the time t, ft,jthe age-specific fertility rate, andMMt the aggregate net migration in the period t.
In addition, to simplify calculations in our model, we don’t distinguish between natives and immigrants in the model once the immigrants have entered the age specific group of the host country.
(2) Household behavior
There is a representative individual for each generation in the household sector. We assume that preferences are the same for all agents in all generations. Moreover, each individual lives for a fixed number of periods. In each period of the model, the oldest generation dies and a new one enters. The representative individuals maximize their intertemporal utility function with consumption and bequest dependent on to their lifetime income. They are rational, and possess perfect foresight.
In the m th region, each generation enters the labor market at age 21, retires at age Qm, is granted a pension at Qm+1, and dies at age Zm. In addition, each supplies labor inelastically. The within-period utility function exhibits constant relative risk aversion, and preferences are additive and separable over time. In each region, the utility functions of the i th generation are specified as:
- 1
q 1
1 -
1 c 1 U 1
- 1 i 21 - 20 Z
Z
1 j
- 1 j i, 1 - j
i
(2)
where j refers to the j th period of life, the rate of time preference, the inverse of the elasticity of intertemporal substitution, and the bequest motive. The arguments of the utility function are the consumption per period (ci,j) and the bequest at the death period (qi). Leisure does not enter the utility function since the individual’s labor supply is assumed to be exogenous.
The technological progress is exogenous and embodied in labor. We model age-specific labor productivity by assuming a hump-shaped age-earnings profile, i.e., a quadratic form of its age ( j+ 20), so its age-wage profile ej takes the following form:
0 and 0 , , j j
ej01 2 2 0 1 2 (3) The intertemporal budget equation of each generation may be described as follows:
Qj-201PDVi,j(1-wt-pt)wt(1)tejjZQ-20-19PDVi,jpi,jqi(Z21)/ii 20
- Z , i 20
- Z
1 j
t j , i j ,
i c (1 c) PDV (1 )q
PDV b
(4)
where PDVi,j
j
k1(1 rik1)
/
1 refers to the factor of the present discounted value, wt is the wage rate at time t≡i+ j-1, ej is the wage profile at age ( j+ 20), is the labor income tax rate at time t, wt
pt
is the public pension contribution rate at time t, measures the rate of technical progress, is i the population ratio of generation i to generation i-(Z-21), is the consumption tax rate at time t, ct
is the inheritance tax rate, and pb i,j stands for pension benefit of generation i at age ( j+ 20).
Each generation maximizes its utility function (2) under the budget constraint (4).
Maximizing utility, i.e. differentiating the household utility function (2) with respect to ci,jand
qi, subject to the individual’s life-time budget constraint (4), yields the following Euler equations concerning consumption per period.
Z-20
1 j
j , i 20 j , t t
1 - j , i 1
t 1 - t 1 t t j
,
i c , C N c
c 1
c 1 1
) r - 1 ( r c 1
(5)
where rt is the interest rate at time t, is the tax rate on interest income at time t, Nrt t,j measures the number of the people of age j at period t, and Ct is the aggregated consumption at time t. This Euler equation dictates, as in any life-cycle model, that the trade-off between current and future is determined by the ratio of the interest rate and the time preference rate, and by the degree of risk aversion.
We can also derive the following physical wealth accumulation equation:
Z-20
1 j
j i, 20 j t, t
j i, t j t t t t t
t 1 - j i, j
i, a 1 r(1- r) (1- w - p)w (1 )e -(1 c)c ,PA N a
a (6)
where ai,j is physical wealth asset of generation i at age ( j+ 20) and PAt is the aggregated private asset at period t.
(3) Firm behavior
The private sector production is represented by the Cobb-Douglas production function with constant return to scale. The firm decides the demand for physical capital and effective labor in order to maximize its profit with the given factor prices of wage and rent, which are determined in the perfect competitive markets.
L AK
Yt t 1e-, t (7)
1 - t t
t I (1- )K
K (8) where Y is output, stands for capital income share, A is a scale parameter, is the depreciation of physical capital, K is the physical capital stock, and Le is the effective labor.
We can derive two factor prices, the rate of return rt and the wage rate per unit of effective labor wt, by the first-order conditions for firm’s maximum profit:
t t -e, t
- 1 t , e 1 - t
t AK L - , w (1- )AK L
r (9)
(4) The Government
The government sector has revenue three types of taxes, wage tax, consumption tax and capital tax, as well as the public debt issuance income, and consumption, investment, and interest payments as expenditures.
Z-20
1 j
20 j t, j i, t 20
- Z
1 j
20 j t, j i, t 20
- Q
1 j
20 j t, j t t t
t w w (1 )e N c c N r a N
T (10)
We keep all tax rates constant.
The role of the government is to endogenously determine the rate of the public debt issue as a residual of government expenditure and revenue.
t 1
- t t
t t t
Bond )D
1 ( D
T - G Bond
rt
(11)
where Bondt is the public debt issue at time t, Gt stands government expenditure at time t, Tt denotes tax revenue at time t, Dt denotes public debt at time t. In addition, Dekle (2004) has clarified the fact that education and healthcare impacts to GDP with immigration are close to those with no immigration, but the impact of social security to GDP with immigration is dramatically changed. Therefore, we assume that the government expenditure, except government subsidies to public pension, in our model is proportional to GDP.
As mentioned above, the public debt issue is set endogenously due to the difference between expenditure and tax revenue. It should be noted that the public debt issue to GDP ratio will change over time as a result of possible imbalances between revenues and expenditures. Thus we do not know whether the fiscal policy of a country is sustainable and if the government’s intertemporal budget constraint must be satisfied.
(5) The public pension
The pension sector grants a pension to the retirement generations while pension contribution is collected from the working generations.
Q-20
1 j
20 j , t j t t t
t pw (1 )eN
P (12)
where P stands for the aggregated pension contribution.
The aggregated pension benefits at time t is given by the product of the population of retirement age, replacement rate, and average earnings during their working time Wj.
2 0 j , t j 2 0 - Z
1 9 - Q j
t WN
B
(13)
where denotes replacement rate and B is the aggregated pension benefit.
We explicitly model the public pension system as pay-as-you-go. The budget constraint of the pension sector can be shown as follows:
t
t (1 )
P sp B (14) where spdenotes public subsidy to pension, which is financed by government expenditure Gt.
Moreover, we assume that the public pension sector maintains a fixed replacement rate exogenously. As a result, in our model, the pension contribution rate is endogenously determined in order to keep the budget constraint (14).
(6) World equilibrium
Our model of an open economy in global equilibrium requires several conditions. We assume perfect capital mobility across regions. Therefore, the rate of return on financial investment is
equalized across all countries:
~ t m t m
t )r r
r - 1
( (15)
where m denotes the m th region. Second, the aggregate value of world assets equals the market value of the worldwide capital stocks plus the value of all outstanding regional government bonds:
mn1PAtm mn1Kmt mn1Dtm (16) where m denotes the m th region, and n the total number of regions which is 16 in our model. Third, the sum of the net migration across all 16 world regions equals zero:MM 0
1 m
m
t
n (17) Finally, in order to close the model structure logically, the good market must reach equilibrium. Aggregate worldwide supply be equal to aggregate worldwide demand.
mn1Ytm nm1Cmt GtmKtm1-(1-m)Kmt (18)3. The Data, Calibration, and Scenarios 3.1. Data and calibration
We distinguish 16 world countries/regions: Japan, United States of America, China, South Korea, India, Indonesia, Bangladesh, Philippines, Thailand, Vietnam, Brazil, Peru, Australia, Canada, Europe, and Rest of World. All regions except the United States, Europe, and Rest of World are net immigration suppliers to Japan according to the statistics of registered foreign nationals published by the Japanese Ministry of Justice.
Our demographic projection model for these regions is calibrated to fit the United Nations (UN) (2007) projections. The UN publishes data for each year over 1950–2050 for five-year age cohorts. However, the data such as age-specific fertility rates are given only at quinquennial frequency. Therefore, we interpolate between age groups and time intervals in order to fit our population model to the UN population data for 1950–2050. To simplify the calculation, we assume that age-specific fertility rates are constant at the current level.
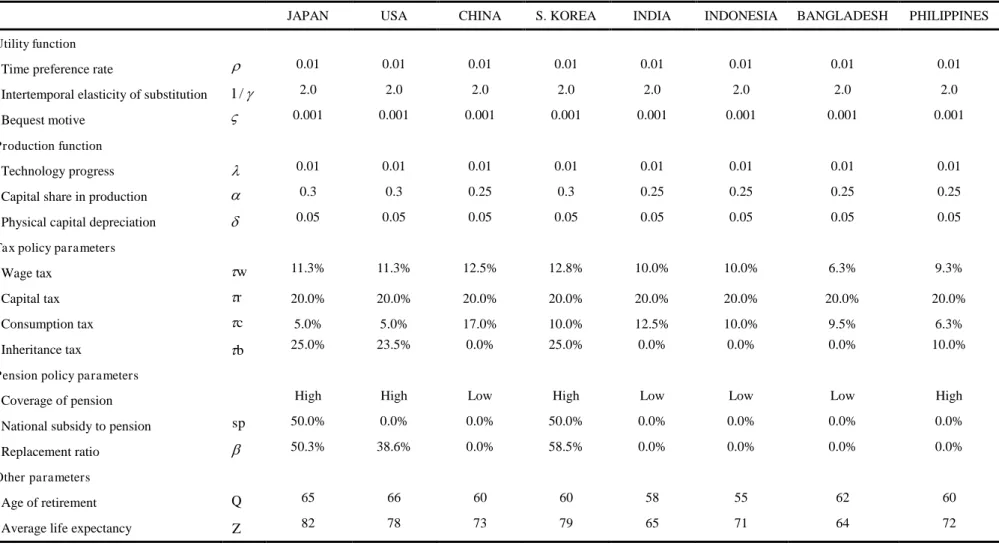
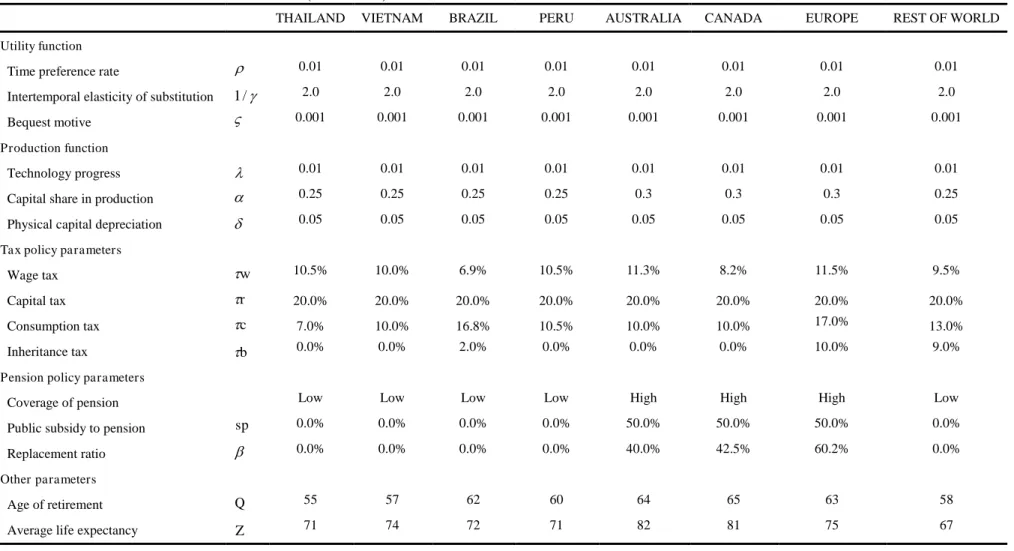
In addition, we present the values of the main parameters and exogenous variables of the model in Table 1. The structural parameters for the households’ and firms’ behaviors are derived from Auerbach and Kotlikoff (1987) and various early OLG simulation studies in Japan.2 These parameters, such as technological progress and preference parameters, are assumed to be constant and equal across all regions, except capital share parameters which are different in developed
2 See Homma et al. (1987), Kato (1998, 2002), Sadahiro and Shimasawa (2001, 2003), Uemura (2002), Okamoto (2005), Ihori et al. (2006).
regions and developing regions.
The exogenous variables such as the macroeconomic, fiscal and public pension variables, are mainly derived from OECD (2007) ―Tax Database,‖ ISSA (2006–2008) ―Social Security Programs Throughout the World,‖ and Whitehouse (2007) ―Pensions Panorama.‖3
We start our calculations with a phase-in period of about 100 years in order to relax the unrealistic assumption of a steady state in 2006, the base year of our simulation. Moreover, since the model is simulated over 500 periods, we ensure a sufficiently long period for a achieve steady state equilibrium.
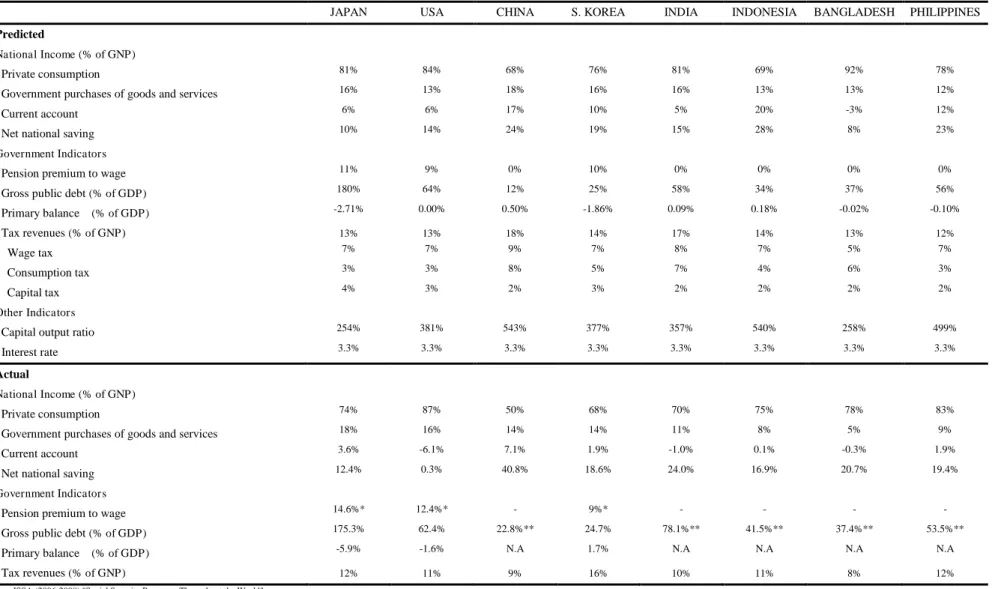
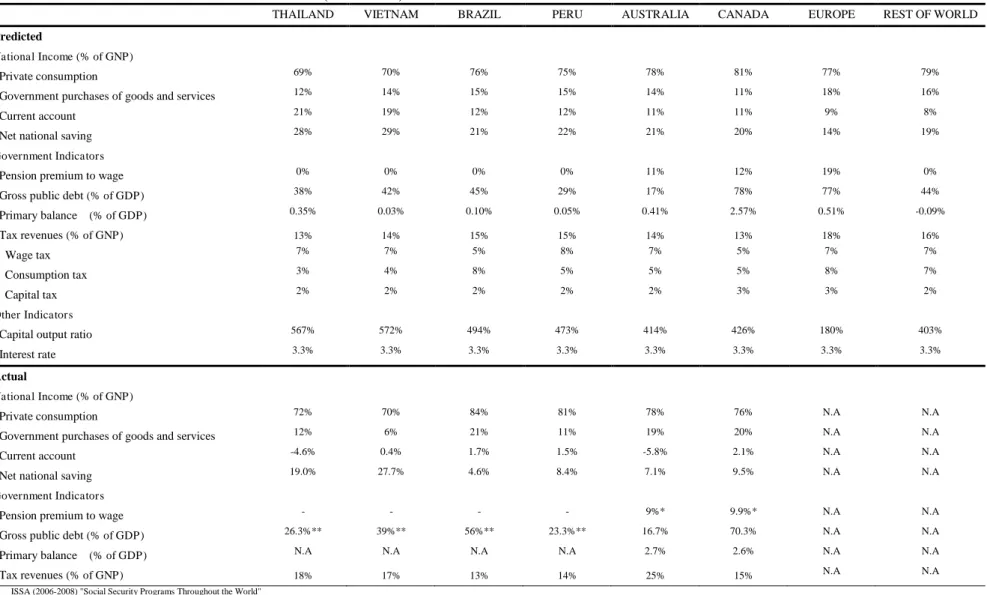
Table 2 reports the actual values of some key variables in 2005 and the predicted values from the model. Note that actual and predicted values closely correspond.
3.2. Scenarios
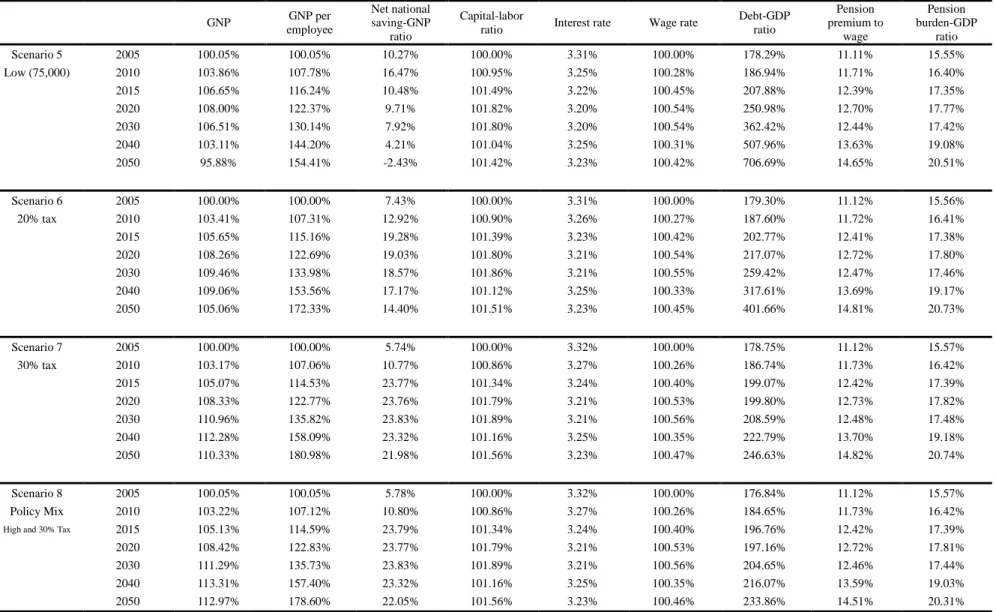
Next we present simulated policy scenarios. The scenarios are classified into four categories. Scenario 1 assumes a no immigration baseline case, and Scenarios 2 to 4 assume the arrival of 150,000 immigrants annually. Scenario 5 assumes arrival of 75,000 immigrants annually, after 2015. Scenarios 6 and 7 assume no immigration, but a permanent increase in the consumption tax to 20% and 30%, respectively, beginning in 2015. Finally, Scenario 8 is the policy-mix of Scenario 2 (permanent immigration) and Scenario 7 (30% consumption tax reform).
Scenarios with immigration, 1 to 5 and 8, assume that the age structure of new immigrants is the same as the age structure of the current immigration population registered with the Japanese Ministry of Justice. To evaluate variations in immigration policy, each scenario is slightly different.
In Scenarios 2, 5, and 8, the increase of immigration to Japan is permanent beginning in 2015. In Scenario 3, the increase of immigration is temporary, beginning in 2015 and ending in 2030. In Scenario 4, the permanent increase of 150,000 million is delayed, beginning in 2025. We do not distinguish between natives and immigrants once they have joined the native Japanese population.
4. Simulation results
We now turn to describe the simulation results reported in Figures 2 and 3 and Table 3. For this study, we focus on Japan rather than other developed regions facing the effects of severe population aging such as Germany and Italy. In contrast to other countries, Japan has a very low immigration rate, and has traditionally admitted few immigrants. We present the results of the immigration scenarios in comparison to the baseline,, consumption tax reform, and policy-mix (immigration and consumption tax reform) scenarios in Japan.
3 In our model, for the reason that detailed data of capital tax in some developing regions were unavailable, capital tax variables are assumed to be equal to 20% across all regions.
(1) Macroeconomic effects
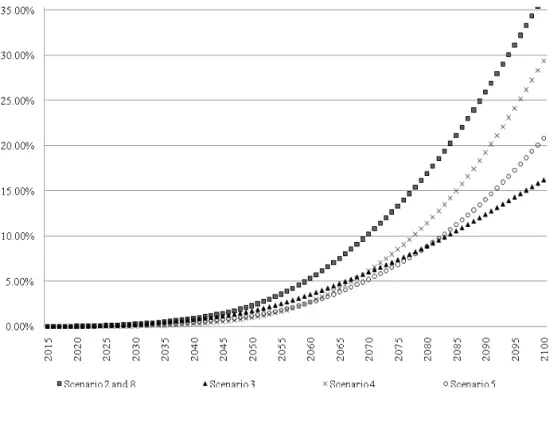
Immigration contributes to the rise in the working age population rate and to the reduction in the ratio of older people (65 years old and above). In Scenarios 2 to 4 and 8, we consider an annual flow of 150,000 immigrants. In 2100, the proportion of immigrants reaches 37% of the total population of Japan in Scenarios 2 and 8, 16% in Scenario 3, and 29% in Scenario 4 (Figure 2). In Scenario 5, with an annual flow of 75,000 immigrants, the proportion of immigrants reaches 21% in 2100. We conclude that increasing the size of annual immigration makes a substantial difference in the long-run demographic trend of Japan.
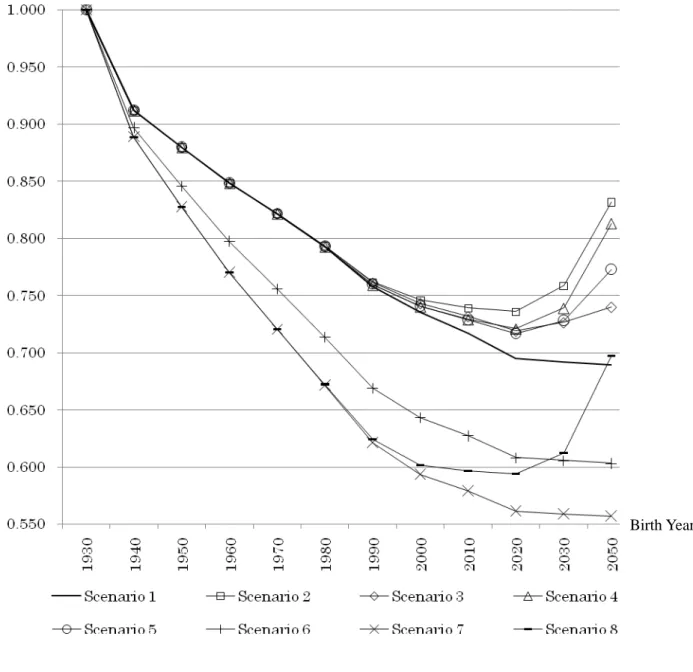
Figure 3 shows the retired population ratio. Because the age structure of immigrants is generally younger than that of the host population, immigration can increase the working-age population of the receiving country. This is true for our scenarios. While the ratio continues to increase to 37% in the long run without immigration (Scenarios 1, 6, 7), in each immigration scenario the retired population increases at a lower rate. Immigration lowers the retired population ratio by a several percentage points in 2100 relative to the no immigration scenario. High immigration Scenarios 2 and 8 lower the ratio by 10 percentage points. Temporary immigration (scenario 3) and delayed immigration (Scenario 4) lower the ratio by 3 and 9 points while low immigration (Scenario 5) lowers the ratio by 5 percentage points. Thus, the inflow of immigrants reverses the retired population ratio, implying that there are more current workers to support the retired population. Additionally, the effect of the delayed, high, and permanent policy is superior to temporary or the immediate, low policy.
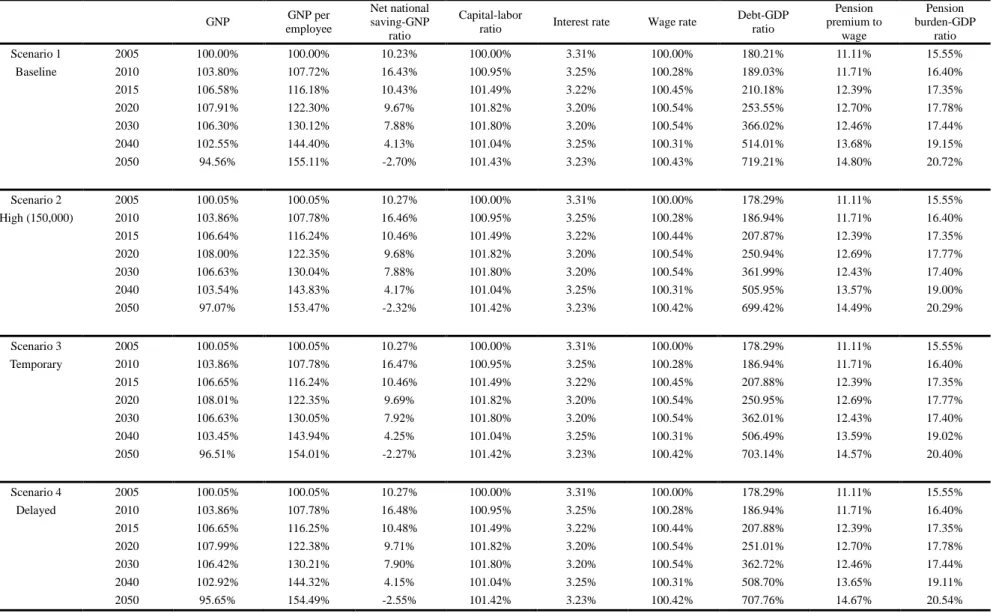
Because we adopt the lifecycle consumption hypothesis, the savings rate (net national savings to GNP) is severely affected by the rise of the elderly population, which is directly related to the retired population ratio. Immigration and baseline scenarios each have similar trend in the savings rate; national savings rates increases in 2010, then declines to about -2.4% in 2050. However, in every year, the savings rates are higher under the immigration scenarios. In 2010, the savings ratio under the full, permanent, immediate scenario 2 is 14% higher than the no immigration scenario. Hence, table 3 shows that the rejuvenation of the population structure caused by the inflow of immigration raises the savings ratio. In addition, Table 3 shows that, in scenarios with consumption tax reform (Scenarios 6, 7 and 8), the savings ratio is substantially higher. The ratio under these scenarios, however, also goes down in 2050. In order to achieve a higher level of savings, we require more fundamental fiscal reform such as a drastic cut of government debt or immigration. In fact, the savings ratio of Scenario 7 (30% consumption tax reform) or Scenario 8 (policy-mix) does not go more down in 2050 than that other scenarios.
Because of the technology and lifecycle hypothesis assumptions, the GNP is determined mainly by working-age population dynamics. In the baseline scenario, the GNP growth is stagnant, so the level varies little over 50 years. It rises slowly over the first two decades, 2010 to 2030, but then
declines markedly from 2030 to 2050, reflecting the declining labor force. By 2050, GNP declines to 94.56% of 2005 GNP. In all other scenarios, GNP in 2050 is higher because of the effects of immigration or fiscal reform with the rise of consumption tax. Therefore, we can confirm that immigration promotes expansion of the Japanese economy, because immigration increases the labor force, which fuels economic growth.
The immigration scenarios increase GNP due to three effects: 1) the continuous immigrant flows imply less population aging than under no immigration, 2) immigration increases the labor force, and 3) the children and the grandchildren of immigrants also contribute to decreased population aging and labor force increase in the long run. The impact of a larger labor force is especially noticeable comparing GNP per employee under immigration scenarios with the no immigration scenario. This is shown in Table 3. In Scenarios 6 to 8 (consumption tax reform or policy-mix), GNP per employee substantially increases each decade from 2020 to 2050, and by at least 20 percentage points between 2030 and 2040 and between 2040 and 2050. But in Scenarios 2 to 5, the increase is smaller because of a larger labor force. The increase in Scenario 2 (permanent immigration) is 153.47% over 2005 GNP, smaller than other immigration scenarios. Scenario 4 (delayed immigration), Scenario 3 (temporal immigration) and Scenario 5 (half immigration) have a comparable effect, raising GNP per employee just over 154% in 2050. Therefore, we can confirm that immigration promotes quantitative expansion of the Japanese economy, because immigration increases the labor force, which fuels economic growth.
Now, we briefly evaluate factor prices. In each scenario, due to the capital market equilibrium, the interest rate (wage rate) fluctuate within a narrow range over the century. Starting from 3.31% in 2005, the interest rate decreases until 2030, increases in 2040 and declines, reaching 3.23% in the year 2050. This is true partly because capital mobility equalizes world interest rates, despite changes in the Japanese national savings rate due to the aging population. The results of our simulation show that, surprisingly, factor prices are almost the same in all Scenarios.
(2) Fiscal and pension effects
Generally, immigration can be expected to give the fiscal balance and the public pension budgets ambiguous effects through several channels. An inflow of working age immigrants initially increases the tax base, and then changes the trend of government revenues and pension expenditures. As a result, government debt will be reduced initially, but dynamic long-run effects depend on the permanence and size of immigration.
The aging of the baby boomers increases the retiree ratio until 2050 in all scenarios. In order to balance the budget, the pension premium to wages rate must be increased. Table 3 shows that, in Scenario 2 (permanent immigration), compared to Scenario 1, the long run pension tax on wages is reduced by 0.31 percentage points in 2050. In Scenario 3 (temporal immigration), the long-run tax
rate is also reduced by 0.23%, in Scenario 4 (delayed immigration) by 0.13%, and in Scenario 5 (half immigration) by 0.15%. Consequently, the inflow of immigrants reduces, to a minor extent, the tax burden effects of the aging population in Japan.
In addition, though the public debt-GDP ratio gradually increases in each scenario over this century because of a fairly low consumption tax rate in Japan, the ratio is reduced by 19.79 percentage points in 20050 compared to no immigration. In Scenario 3 (temporary immigration), the public debt-GDP ratio is reduced by 16.07 percentage points, in Scenario 4 (delayed immigration) by 11.45, in Scenario 5 (half immigration) by 12.52, in Scenario 6 (20% consumption tax reform) by 317.55, Scenario 7 (30% consumption tax reform) by 472.58, and Scenario 8 (policy-mix) by 485.35percentage points. Scenario 3 shows the smallest reduction in the rate of pension tax on wages and public debt to GDP is because immigration increases are temporary. Hence, the impact is smaller relative to the others.
Government and pension budgets and the pension tax improve in the short run because of expansion of tax base. In the long run immigrants retire and leave the tax base, decreasing revenues and increasing expenditures. Retired immigrants do not contribute to revenues, and they do not replace themselves in the workforce (we assume immigrants have the same fertility rate as natives, below replacement). But, like the native population, retired immigrants collect pension and increase pension expenditures. Hence, the fiscal and pension balance will deteriorate in the long run. Our conclusions here are not pleasant. First, immigration alone cannot fully alleviate the fiscal and burden of the ageing population in the short run. Secondly, retired immigrants become a burden on the Japanese public pension in the long run.
(3) Welfare
Figure 4 shows generational welfare of Japanese cohorts under Scenarios 1 to 8. These are welfares of subsequent five year age cohorts measured in terms of lifetime utility relative to the 1930 cohort under the baseline scenario. The long run increase in the pension tax on wages caused by the progress of aging reduces the amount of resources available within their lifetime. The long run increase in the public debt to GDP ratio also reduces private capital stock available and possibly decreases future growth. Current and future generations suffer a severe welfare loss under all scenarios.
Younger generations realize large welfare gains from the immigration scenarios, but not from fiscal reconstruction scenarios (Scenarios 6 to 8) when compared with no immigration (Scenario 1). They gain from the reduction in the pension tax on wages. The welfares under Scenarios 1, 6 and 7 gradually decline and do not reach a minimum by 1950, but welfares under Scenarios 2 to 5 and 8 do reach a minimum for the cohort born in 2020.
In addition, under full immigration (Scenario 2), the generations of Japanese born after 1970
obtain a welfare gain because their share of the pension and public debt is reduced. In particular, the welfare of the generation born in 2050 dramatically increases by 14.2 percentage points. In Scenario 3, the welfare of the generation born in 2050 also increases by 0.5 percentage points, in Scenario 4 by 12.4, in Scenario 5 by 8.3, and in Scenario 8 by 0.8 percentage points.
On the other hand, in fiscal reconstruction scenarios (Scenarios 6, 7, and 8), the generations of Japanese born after 1940 suffer a welfare loss because the higher consumption tax reduces their lifetime disposable resources.
Therefore, based on the comparison between the immigration scenarios, the consumption tax reform scenario and the policy-mix scenario, we conclude that immigrants are expected to make large net contributions to the Japanese economy. Immigration is a good policy for Japan based on not only the macroeconomic, fiscal, and pension impacts but also welfare improvements. This policy (Scenarios 2-5) enlarges lifetime resources, which offer gains to the current and future generations, and reduces the fiscal burden on to the public pension system. In contrast, the policy that only increases the consumption tax reduces the fiscal pressure on the pension system much more, but also reduces citizen welfare through increases in the consumption tax. Therefore, we recommend a policy-mix such as Scenario 8 which will provide a large benefit to the pension system and still increase welfare.
5. Concluding remarks
In this paper, we presented an dynamic general equilibrium OLG simulation model using 16 countries and regions in order to quantify the economic impacts of immigration to Japan. Our simulation results show that immigration will improve the Japanese economy compared to a no immigration scenario. Specifically, annual immigrant flows of 150,000 will dramatically increase the welfare of current and future generations. On the other hand, we can’t expect a significant long-run welfare improvement solely from increasing the consumption tax. If both fiscal sustainability and welfare improvements for current and future generations are requirements, we will need to promote a policy which includes both immigration and additional fiscal reform, i.e. increasing the consumption tax.
Our study does not consider three points: 1) the additional costs of immigration such as the public education cost for immigrants’ children, 2) the difference between the impact of high skill and low skill immigrants, and 3) the scenario in which the birthrate of immigrants does not quickly decline to the level of the native population. As indicated earlier, other studies concluded the first two are not substantial. The last point would make immigration more favorable. These points require more research.
Finally, increasing immigration is not a simple matter. Even when the population is ageing and growth is stagnant, Japan will face enormous difficulties implementing immigration policy to
support sustained economic growth. From the Japan’s social perspective, can immigration flows of this order of magnitude be socially tolerated over an extended duration? From the immigrant’s perspective, is the Japanese immigration opportunity attractive enough to accept the language and cultural barriers? And, finally, would such an immigration policy exacerbate the brain drain that is already harming out-migration countries, and therefore be met with strong international resistance? Japan, like other industrialized countries, must confront these difficult obstacles and solve the related issues in order to chart a productive and viable future for its immigrant and native-born population.
References
Auerbach, A.J. and L.J. Kotlikoff. Dynamic Fiscal Policy. Cambridge University Press: Cambridge, 1987.
Cabinet Office. Kokumin Keizai Keisan Nenpo. Economic and Social Research Institute, Cabinet Office, Government of Japan, Tokyo, 2008.
Dekle, R. (2004). ―Financing Consumption In An Aging Japan: The Role Of Foreign Capital Inflows And Immigration,‖ Journal of the Japanese and International Economies, vol. 18, pp.506-527
Fehr, Hans, Sabine Jokisch, and Laurence J. Kotlikoff (2004). ―The Role of Immigration in Dealing with the Developed World’s Demographic Transition.‖ FinanzArchiv 60(3): pp. 296–324. Homma, M., N. Atoda, Y. Iwamoto and F. Otake (1987). Nenkin : KoureikaShakai to Nennkin Seido,
In Hamada, Horiuchi and Kuroda eds., Nihon Keizai no Macro Bunseki, Tokyo Daigaku Shuppankai, Jun, pp.149–175 [in Japanese]
Ihori, T., Ryuta Ray Kato, M Kawade and Shun-ichiro Bessho (2006). ―Public debt and economic growth in an aging Japan,‖ In K. Kaizuka and Ann O. Krueger, eds., Tackling Japan's Fiscal Challenges: Strategies to Cope with High Public Debt and Population Aging. [in Japanese] Kato, Ryuta R. (1998). ―Transition to an Aging Japan: Public Pension, Savings, and Capital
Taxation,‖ Journal of the Japanese and International Economies vol. 12, pp. 204–231 Kato, Ryuta R. (2002). ―Government Deficit, Public Investment, and Public Capital in the Transition
to an Aging Japan,‖ Journal of the Japanese and International Economies vol. 16, pp.462–491.
Okamoto, A. (2005). ―Simulating Progressive Expenditure Taxation in an Aging Japan,‖ Journal of Policy Modeling 27 (3), 309–325.
OECD. Tax Database, Paris, 2007.
Sadahiro, A., and M. Shimasawa (2001). ―Fiscal Sustainability and the Primary Surplus: A Simulation Analysis with OLG Model,‖ JCER Economic Journal. No. 43. pp. 117–132. [in Japanese]
________ and ________ (2003). ―The computable overlapping generations model with an endogenous growth mechanism,‖ Economic Modeling vol. 20 No. 1 pp. 1–24.
Storesletten, K. (2000). ―Sustaining Fiscal Policy Through Immigration,‖ Journal of Political Economy, vol. 108 (2), pp. 300-23.
________, (2003). ―Fiscal Implications of Immigration—A Net Present Value Calculation,‖ Scandinavian Journal of Economics., vol. 105 (3), pp. 487–506.
The International Social Security Association (ISSA). Social Security Programs Throughout the World: Asia and the Pacific, 2006.
________. Social Security Programs Throughout the World: The Americas, 2007.
________. Social Security Programs Throughout the World: Europe, 2008.
Uemura, S. (2002). ―Lifecycle General Equilibrium Analysis on Social Security,‖ Keizaironshu vol. 28, No. 1. [in Japanese]
United Nations. World Population Prospects: The 2006 Revision, New York, 2007.
Whitehouse, Edward. Pensions Panorama: Retirement-Income Systems in 53 Countries, The World Bank, 2007.
Figure 1 The Total Number of Immigrants (registered foreign nationals) (1987-2007)
Figure 2 Ratio of Immigrants to Total Population
Figure 3 Retired Population Ratio
Figure 4 Simulation Results – WELFARE WITH EQUIVALENT VARIATION
Birth Year
Table 1 Parameter Values of the Model
JAPAN USA CHINA S. KOREA INDIA INDONESIA BANGLADESH PHILIPPINES
Utility function
Time preference rate 0.01 0.01 0.01 0.01 0.01 0.01 0.01 0.01
Intertemporal elasticity of substitution 1/ 2.0 2.0 2.0 2.0 2.0 2.0 2.0 2.0
Bequest motive 0.001 0.001 0.001 0.001 0.001 0.001 0.001 0.001
Production function
Technology progress 0.01 0.01 0.01 0.01 0.01 0.01 0.01 0.01
Capital share in production 0.3 0.3 0.25 0.3 0.25 0.25 0.25 0.25
Physical capital depreciation 0.05 0.05 0.05 0.05 0.05 0.05 0.05 0.05
Tax policy parameters
Wage tax w 11.3% 11.3% 12.5% 12.8% 10.0% 10.0% 6.3% 9.3%
Capital tax r 20.0% 20.0% 20.0% 20.0% 20.0% 20.0% 20.0% 20.0%
Consumption tax c 5.0% 5.0% 17.0% 10.0% 12.5% 10.0% 9.5% 6.3%
Inheritance tax b 25.0% 23.5% 0.0% 25.0% 0.0% 0.0% 0.0% 10.0%
Pension policy parameters
Coverage of pension High High Low High Low Low Low High
National subsidy to pension sp 50.0% 0.0% 0.0% 50.0% 0.0% 0.0% 0.0% 0.0%
Replacement ratio 50.3% 38.6% 0.0% 58.5% 0.0% 0.0% 0.0% 0.0%
Other parameters
Age of retirement Q 65 66 60 60 58 55 62 60
Average life expectancy Z 82 78 73 79 65 71 64 72
Table 1 Parameter Values of the Model (continued)
THAILAND VIETNAM BRAZIL PERU AUSTRALIA CANADA EUROPE REST OF WORLD
Utility function
Time preference rate 0.01 0.01 0.01 0.01 0.01 0.01 0.01 0.01
Intertemporal elasticity of substitution 1/ 2.0 2.0 2.0 2.0 2.0 2.0 2.0 2.0
Bequest motive 0.001 0.001 0.001 0.001 0.001 0.001 0.001 0.001
Production function
Technology progress 0.01 0.01 0.01 0.01 0.01 0.01 0.01 0.01
Capital share in production 0.25 0.25 0.25 0.25 0.3 0.3 0.3 0.25
Physical capital depreciation 0.05 0.05 0.05 0.05 0.05 0.05 0.05 0.05
Tax policy parameters
Wage tax w 10.5% 10.0% 6.9% 10.5% 11.3% 8.2% 11.5% 9.5%
Capital tax r 20.0% 20.0% 20.0% 20.0% 20.0% 20.0% 20.0% 20.0%
Consumption tax c 7.0% 10.0% 16.8% 10.5% 10.0% 10.0% 17.0% 13.0%
Inheritance tax b 0.0% 0.0% 2.0% 0.0% 0.0% 0.0% 10.0% 9.0%
Pension policy parameters
Coverage of pension Low Low Low Low High High High Low
Public subsidy to pension sp 0.0% 0.0% 0.0% 0.0% 50.0% 50.0% 50.0% 0.0%
Replacement ratio 0.0% 0.0% 0.0% 0.0% 40.0% 42.5% 60.2% 0.0%
Other parameters
Age of retirement Q 55 57 62 60 64 65 63 58
Average life expectancy Z 71 74 72 71 82 81 75 67
Table 2 Year 2005 of the Baseline Scenario
JAPAN USA CHINA S. KOREA INDIA INDONESIA BANGLADESH PHILIPPINES
Predicted
National Income (% of GNP)
Private consumption 81% 84% 68% 76% 81% 69% 92% 78%
Government purchases of goods and services 16% 13% 18% 16% 16% 13% 13% 12%
Current account 6% 6% 17% 10% 5% 20% -3% 12%
Net national saving 10% 14% 24% 19% 15% 28% 8% 23%
Government Indicators
Pension premium to wage 11% 9% 0% 10% 0% 0% 0% 0%
Gross public debt (% of GDP) 180% 64% 12% 25% 58% 34% 37% 56%
Primary balance (% of GDP) -2.71% 0.00% 0.50% -1.86% 0.09% 0.18% -0.02% -0.10%
Tax revenues (% of GNP) 13% 13% 18% 14% 17% 14% 13% 12%
Wage tax 7% 7% 9% 7% 8% 7% 5% 7%
Consumption tax 3% 3% 8% 5% 7% 4% 6% 3%
Capital tax 4% 3% 2% 3% 2% 2% 2% 2%
Other Indicators
Capital output ratio 254% 381% 543% 377% 357% 540% 258% 499%
Interest rate 3.3% 3.3% 3.3% 3.3% 3.3% 3.3% 3.3% 3.3%
Actual
National Income (% of GNP)
Private consumption 74% 87% 50% 68% 70% 75% 78% 83%
Government purchases of goods and services 18% 16% 14% 14% 11% 8% 5% 9%
Current account 3.6% -6.1% 7.1% 1.9% -1.0% 0.1% -0.3% 1.9%
Net national saving 12.4% 0.3% 40.8% 18.6% 24.0% 16.9% 20.7% 19.4%
Government Indicators
Pension premium to wage 14.6%* 12.4%* - 9%* - - - -
Gross public debt (% of GDP) 175.3% 62.4% 22.8%** 24.7% 78.1%** 41.5%** 37.4%** 53.5%**
Primary balance (% of GDP) -5.9% -1.6% N.A 1.7% N.A N.A N.A N.A
Tax revenues (% of GNP) 12% 11% 9% 16% 10% 11% 8% 12%
* ISSA (2006-2008) "Social Security Programs Throughout the World"
** S&P (2009) "Sovereign Risk Indicators"