Astrometry of 6.7 GHz Methanol Maser Sources
and the Bar Structure of the Milky Way Galaxy
Naoko MATSUMOTO
Doctor of Philosophy
Department of Astronomical Science School of Physical Science
The Graduate University for Advanced Studies
2010
Abstract
The goal of this thesis is to kinematically establish the existence of the bar struc- ture in the Milky Way Galaxy based on VLBI astrometry of masers in star-forming regions. To achieve this goal, the thesis consists of three parts described below.
First, we measured annual parallax and absolute proper motions of the 6.7 GHz methanol maser source W3(OH) with the JVN/VERA (Japanese VLBI Network / VLBI Exploration of Radio Astrometry). We derived the trigonometric annual par- allax to be 0.633 ± 0.112 mas, corresponding to a distance of 1.58+0.34−0.24 kpc. This is the first detection of a parallax for 6.7 GHz methanol maser with the JVN/VERA, and demonstrates that the JVN/VERA is capable of conducting VLBI astrometry for 6.7 GHz methanol maser sources within a few kpc from the Sun. We also measured the internal proper motions of 6.7 GHz methanol maser of W3(OH) for the first time. The internal proper motions basically show north-south expansion with velocities of few km s−1, being similar to OH masers. The global distributions and the internal proper motions of 6.7 GHz methanol masers suggest a rotating and expanding torus structure surrounding ultracompact HII region. We also obtained averaged absolute proper motions for all six spots of W3(OH), which is µαcos δ = −1.10±0.30 mas yr−1 and µδ = −0.16 ± 0.38 mas yr−1. The accuracy of the absolute proper motion obtained here indicates that we will be able to detect the non-circular motion caused by the Galactic bar, which is expected to be an order of sub-mas yr−1.
Next, we conducted the fringe check observations to select observable target sources toward the Galactic bar. We selected sources from the 6.7 GHz methanol maser catalog of Pestalozzi et al. (2005). In our sources selection, we used four criteria as follows: First, sources must have the galactic longitude |l| < 40◦ and Dec> −37 deg. Second, the sources must have a galacto-centric radius less than 5 kpc, which is estimated from the kinematic distance. Third, we chose strong sources with the flux are 15 Jy or more at single dish observations except some sources that were specially included to investigate the detection limit for the flux under the 15 Jy. Fourth, the maser sources must have one or more detectable reference sources with the JVN or the VERA within 4 degree separations from the maser sources. In this
selection, we chose the reference sources with the peak flux about 100 mJy beam−1 or more at 8 GHz (X-band) in the VLBA Calibrator Survey. The fringe check ob- servations were conducted with six sessions from October 2008 to June 2009 with the JVN/VERA. In total, 75 maser sources were observed. 26 maser sources were detected with signal to noise ratio of more than 5σ at the baseline of about 1,000 km or longer in the 75 sources, corresponding to the detection rate of about 35%.
For astrometric observations, out of the 26 sources detected in the fringe check observations, we chose ten maser sources, which are easy to observe with phase refer- encing because of high flux at longer than 1,000 km VERA baselines and suitable ref- erence sources. These ten sources were G 353.4−0.36, G 351.41+0.64, G 30.76−0.05, G 29.95−0.02, G 28.14+0.00, G 25.70−0.04, G 25.65+1.04, G 24.78+0.08, G 23.01−0.41 and G 9.98−0.02. We obtained the three dimensional velocities with VLBI phase- reference observations. With these data sets for 2, 3 or 4 epochs, we fitted linear proper motions with least-square fittings without a parameter of annual parallax. Finally, we obtained the suitable proper motions for nine sources.
By combining our data with previous results from the VERA/VLBA, we compared the 3-D data of star forming regions with the flat/non-flat circular rotation models and a dynamical model proposed by Wada (1994) and Sakamoto et al. (1999). We find clearly a deviation from the flat/non-flat circular rotation models in the absolute proper motions at the three dimension of (l, µlcos b, VLSR). Around the maximum region of VLSR, the absolute proper motions are smaller than the flat rotation model for the five sources out of eight. From the dynamical models and VLBI data, an acceptable parameter of the inclination angle of the Galactic bar are derived as ∼ 30◦ - 50◦, which is consistent with previous studies. Thus, with the existence of the Galactic bar, observed proper motions with VLBI can be explained better.
Acknowledgements
I am deeply grateful to my supervisor, associate professor Mareki HONMA for his useful advices and fruitful discussions. I would like to express my gratitude to my second supervisor, associate professor Katsunori SHIBATA for his support of ob- servations for this study and helpful advices. I would also like to thank my third supervisor, assistant professor Tomoya HIROTA for his useful advice for data reduc- tions and scientific discussions for the star formation and astrometry.
I would like to appreciate to professor Kenta FUJISAWA, Dr. Satoko SAWADA- SATOH, Dr. Akihiro DOI, student Koichiro SUGIYAMA and Yasuko ISONO for their supports of observations, data reductions and useful discussions about this study especially for W3(OH). I also thank assistant professor Takaaki JIKE and research engineer Takeshi BUSHIMATA for correlations of VLBI data for this study, and Dr. Tomoharu KURYAMA for helpful support of UVW recalculation in the data reduc- tion of this study. I also thank student Kouhei MATSUMOTO for his support for 6.7 GHz receiver and photo credit of VERA receivers. I would like to thank Dr. Nanako MOCHIZUKI for antenna operations of Usuda 64 m telescope. I would also like to thank Dr. Tomoaki OYAMA for his useful advice of data reduction and sci- entific planning. I would also like to appreciate to student Kazuyoshi YAMASHITA for his advice of data reduction and his useful tool. I also thank Dr. Tomofumi UMEMOTO for his helpful advice about star forming region. I also thank student Kazuhiro HADA, Kenta SUZUKI for advice about data reductions. I would like to thank professor Hiroyuki NAKANISHI for his figure of longitude-velocity maps of HI
and CO emissions. I also thank professor Keiichi WADA for his useful comments for this study and introducing his bar model. I also appreciate to associate professor Shuji DEGUCHI for his useful advisor about discussion of kinematics with bar model in this study. I also thank student Kazunori AKIYAMA for his support of observa- tional data obtaining, Mayumi SATOH for her useful advice for data reduction. I want to thank student Mikyong KIM for her helps in my research life. I also thank engineers, scientists and students in Mizusawa VLBI observatory (NAOJ) and staffs and students in Kagoshima University for their help. Finally, I would like to thank
my parents, my sisters, my grandparents, my uncles, my aunt and my dears. This study is supported by Grant-in-Aid for JSPS Fellows.
Contents
Abstract ii
Acknowledgements iv
1 Introduction 1
1.1 The Bar of the Milky Way Galaxy . . . 1
1.2 VLBI Astrometry . . . 8
1.3 Aim of This Thesis . . . 16
2 6.7 GHz Methanol Maser Toward W3(OH) Ultracompact H II Re- gion 17 2.1 Introduction . . . 17
2.2 Observations and Data Analysis . . . 19
2.2.1 Observations . . . 19
2.2.2 In-beam and Phase-referencing Mappings . . . 20
2.2.3 Derivation of Internal Proper Motions . . . 22
2.2.4 Derivation of Annual Parallax and Absolute Proper Motion . . 22
2.3 Results . . . 25
2.3.1 Spatial Distribution and Internal Proper Motion . . . 25
2.3.2 Parallax and Absolute Proper Motion . . . 28
2.4 Discussion . . . 32
2.4.1 Astrometry with the VERA/JVN . . . 32
2.4.2 Structure of Maser Emitting Region . . . 33
2.4.3 Conclusion . . . 36
3 Fringe Check Observations of 6.7 GHz Methanol Maser with the VERA/JVN 39 3.1 Introduction . . . 39
3.2 Source Selection . . . 40
3.2.1 Criteria for Source Selection . . . 40
3.2.2 Fringe Check Observations . . . 44
3.3 Data Analysis . . . 45
3.4 Results and Discussion of Fringe Check Observations . . . 46
4 The Molecular Gas Motion with the Bar Structure of the Milky Way Galaxy 56 4.1 Introduction . . . 56
4.2 Observations . . . 56
4.3 Data Analysis . . . 60
4.4 Results . . . 61
4.5 Discussion . . . 62
4.5.1 Flat Circular Rotation Model . . . 68
4.5.2 Non-flat Circular Rotation Model . . . 71
4.5.3 Damped Oval Orbit Model . . . 79
4.6 Summary . . . 88
5 Conclusions 94 5.1 Conclusions . . . 94
5.2 Future Works . . . 95
Bibliography 97
A Spectra and Maps of the 6.7 GHz Methanol Maser Sources in Chap-
ter 4 107
Chapter 1
Introduction
1.1 The Bar of the Milky Way Galaxy
The Milky Way Galaxy is believed to be a barred spiral galaxy from various obser- vational and theoretical studies like figure 1.1. de Vaucouleurs (1964) first proposed that the Milky Way Galaxy is a barred galaxy from the large positive and negative velocities in the HI profiles near the galactic center and the spiral pattern of other SAB(r) or SAB(rs) galaxies. Since then, there have been many studies on the Galac- tic bar. They can be mainly categorized as those based on photometry, based on motions of gases and stars, and here we briefly review them to summarize what has been done in the research of the Galactic bar.
Photometric structure: The Galactic bar is strong supported by direct ev- idences of a large scale stellar asymmetry in the central a few kpc of the Milky Way. For instance, discrete source counts of AGB sources were performed by Wein- berg (1992a), and IRAS sources were performed by Nakada et al. (1991), Weinberg (1992b) and Nikolaev & Weinberg (1997). In these studies, the size and shape of den- sity contour suggested a bar semi-major axis of ≈3 kpc and position angle of 18◦± 2◦ at the outer edge of the bar. Whitelock (1992) conducted the source counts of Miras, and estimated the tilt angle of the bulge-bar at roughly 45◦. Blitz (1993a) showed the elongate distribution of the globular clusters within a 4 kpc centered on the Galactic Center with a tilt angle of 25◦ ± 8◦. Hammersley et al. (2000) first claimed a ”long
Figure 1.1: An artist’s conception of Milky Way (R. Hurt: NASA/JPL-Caltech/SSC) viewed from the north Galactic pole from which the Galaxy rotates clock wise.
bar” based-on star counts and color-magnitude map of K giant stars, suggesting a bar with half-length of around 4 kpc and a position angle of about 43◦ ± 7◦. The non-axisymmetry in the number of OH/IR stars along the line-of-sight as a function of galactic longitude was investigated by Sevenster (1996). Deguchi et al. (2002) es- timated a tilt angle of 22◦± 8◦ with near-infrared color-magnitude map of IRAS/SiO sources. The large microlensing optical depths towards the bulge were investigated with the OGLE/MACHO data (Paczynski et al. (1994); Zhao & Mao (1996); Zhao et al. (1996); Bissantz et al. (1997); Gyuk (1999)).
The COBE/DIRBE near-infrared surface photometry also supported the total image for the distribution of old stars in the inner Galaxy. The near side of the bar is in the first Galactic quadrant and the bulge-bar is tilted with respect to the Galactic plane (Blitz & Spergel (1991b)). The scale height of bulge minor axis is found to be 2◦.2 ± 0◦.2 (Weiland et al. (1994)). The tilt angle of the bulge-bar was estimated by Dwek et al. (1995) at 20◦ ± 10◦ between its major axis and the line of sight to the Galactic center, with typical axis ratios of x0 : y0 : z0 = 1 : 0.33 ± 0.11 : 0.23 ± 0.08. Fux (1997) also estimated the inclination angle of the Galactic bar relative to the Sun- Galactic center line is 28◦±7◦. Binney et al. (1997) also estimated the axis ratios with non-parametrical light distribution as x0 : y0 : z0 = 1 : 0.6 : 0.4 with semi-major axis length∼2 kpc. In their models, based on identification of the Lagrange point L4 and the length of the bulge-bar, they inferred a pattern speed Ωb ≃ 60-70 km s−1 kpc−1 for the bar.
Recently, the GLIMPSE survey data also revealed the bar structure of the Milky Way Galaxy (e.g. Churchwell et al. (2009); Benjamin et al. (2005)). For instance, Benjamin et al. (2005) showed a linear bar with half-length Rbar = 4.4 ± 0.5 kpc, tilted by 44◦± 10◦ to the Sun-Galactic center line.
The linear distributions of red-clump stars were also discovered within a few kpc from the Galactic center along the Galactic plane, which strongly suggested the exis- tence of bar structure (Stanek et al. (1997); Babusiaux & Gilmore (2005); Nishiyama et al. (2005); Rattenbury et al. (2007a); Rattenbury et al. (2007b)). With OGLE data, Stanek et al. (1997) suggested a bar model which has the major axis inclined to
the line of sight from 20◦-30◦, with axial ratio corresponding to x0 : y0 : z0 = 7 : 3 : 2. With OGLE-II data, Rattenbury et al. (2007a) found the bar major-axis is oriented at an angle of 24◦-27◦ to the Sun-Galactic Center line-of-sight, with the axis ratio x0 : y0 : z0 = 10 : 3.5 : 2.6. Babusiaux & Gilmore (2005) also estimated the angle of 22 ± 5◦.5 and the bar length of 5.0-6 kpc. Nishiyama et al. (2005) found that a mag- nitude peak changes continuously along the Galactic plane in the color-magnitude diagrams of red clump stars, and claimed an additional inner structure at |l| . 4◦ with the bar length of ≈2 kpc. Cabrera-Lavers et al. (2007) showed that there are two very different large-scale triaxial structures coexist in the inner Galaxy with the samples of ranges −5◦ < l < 30◦ and |b| < 10◦. One is a long thin stellar bar con- strained to the Galactic pane (|b| < 2◦) with a position angle of 43.0◦ ± 1.8◦, and other is a distinct triaxial bulge that extends to at least |b| ≤ 7.5◦ with a position angle of 12.6◦± 3.2◦. On the other hand, McWilliam & Zoccali (2010) found two red clump populations co-existing in the same fields toward the Galactic bulge at higher latitudes |b| > 5.5◦, instead of a body of a bar. They estimated a tilt angle of a line connecting the maxima of the foreground and background populations to the line of sight at ∼ 20◦± 4◦. The photometric observations have all suggested the existence of the Galactic bar, and the length of the bar is approximately 2-6 kpc, and the tilt angle is approximately 10◦-50◦.
Kinematic structure from line-of-sight velocity of gasses: There have been many studies dealing with the l-v diagrams of HI (e.g., Hartman & Burton (1997); Kerr et al. (1986); Burton & Listz (1983); Rodriguez-Fernandez & Combes (2008); McClure-Griffiths et al. (2005)), CO (e.g., Dame et al. (2001); Clemens (1985)) and CS (e.g., Bally et al. (1988)). By several gas flow models or simple assumption (flat rotation or rotation curve), the produced l-v diagrams may be qualitatively understood, such as the bar, the 3 kpc arm, the non-circular velocities around the end of the bar, x1/x2-orbits, the molecular ring and the spiral arm tangent locations (e.g., Englmaier & Gerhard (2006); Englmaier & Gerhard (1999); Bissanz et al. (2003); Nakanishi et al. (2003); Fux (1999); Weiner & Sellwood (1999); Wada et al. (1994); Blitz & Spergel (1991b); Blitz et al. (1993b); Binney et al. (1991); Liszt & Burton
(1978); Manabe & Miyamoto (1975); Simonson & Mader (1973)), although above previous models did not provides a satisfactory account quantitative of the entire observed l-v diagrams. Recently, Baba et al. (2010) modeled the gas dynamics of barred galaxies using a 3-D, high-resolution, N body+hydrodynamical simulation, and reproduced both the large-scale structure and the clumpy morphology observed in the Galactic HIand CO l-v diagrams with the parameters of Ωb∼ 27 km s−1kpc−1, RILR≈ 1 kpc, v0 = 163 km s−1, RCR≈ 5 kpc, ROLR ≈ 10 kpc, and inclination angle of the long axis of the bar 25◦. They also showed transience of the various galactic structures.
The diagonal structure called Galactic Molecular Ring (GMR) is one of the most prominent structures in the l-v diagram. The orbit of the GMR in l-v diagram could be explained by circular motion. If the GMR was a real ring, it could be associated with a resonance. Binney et al. (1991) proposed that the GMR is probably associated with the Outer Lindblad Resonance. On the other hand, Combes (1996) suggested that the GMR could be better explained by the Ultra Harmonic Resonance, just inside the corotaion. However, the real spatial distribution of the GMR is not known and it could be composed of imbricated spiral arms instead of being an actual ring. Englmaier & Gerhard (1999) identified the GMR as one of the bars emanating from the ends of the bar. Nakanishi & Sofue (2006) found that the GMR seems to be the inner part of the two spiral arms (the Scutum-Crux arm and the Sagittarius-Carina arm), which are also reproduced by Rodriguez-Fernandez & Combes (2008) and Baba et al. (2010) based on simulation of the gas dynamics.
Frequently, the pattern speed and inclination angle of the bar have been estimated from comparing the gas flow in hydrodynamic simulations with the observed Galac- tic HI and CO l-v diagrams. These simulations generally reproduced a number of characteristic features in the l-v plot very well, but none of them reproduced all the observed features, like multiple complicated arms and/or small expansion structures. Thus the derived pattern speeds vary somewhat depending on studies. (Following values are based on standard values of R0 = 8 kpc and v0 = 220 km s−1.) Binney et al. (1991) obtained RCR = 2.4 ± 0.5 kpc and a bar angle of 16◦ ± 2◦ from its
major axis from HI and CO l-v diagrams with the region l ≤ 12◦. Blitz & Spergel (1991a) obtained a position angle of the long axis of 45◦± 20◦ from HI l-v diagrams. Wada et al. (1994) obtained Ωb = 20 ± 5 km s−1 kpc−1 and a bar angle of less than 20◦. Combes (1996) obtained Ωb = 40-50 km s−1 kpc−1 (RCR = 4-5 kpc) and the bar length ∼ 4-5 kpc in radius. Weiner & Sellwood (1999) obtained Ωb ≈ 42 km s−1kpc−1 (RCR = 5.0 kpc) and the inclination angle of 34◦ with a semi-major axis of the bar of 3.6 kpc from matching the terminal velocity of HI l-v diagrams. Englmaier & Gerhard (1999) obtained Ωb ≃60km s−1 kpc−1 (RCR≃ 3.5 ± 0.5 kpc) and inclination angle of ≈ 20◦-25◦ by placing the corotation radius RCR outside the 3 kpc arm and inside the molecular ring, and by matching mainly to the spiral arm tangents. Fux (1999) obtained Ωb∼ 50 km s−1 kpc−1 (RCR= 4.0-4.5 kpc) and an inclination angle of 25◦ ± 4◦ from a comparison to several reference features in the CO l-v diagrams with a COBE-like bar. Bissanz et al. (2003) obtained Ωb = 60±5 km s−1 kpc−1, cor- responding to corotation at 3.4±0.3 kpc with 20◦ . φbar . 25◦ from comparing with the 12CO l-v diagrams. Rodriguez-Fernandez & Combes (2008) obtained Ωb = 30- 40 km s−1 kpc−1 (RCR= 5-7 kpc) and a bar tilt angle of 20◦-35◦ with respect to the Sun-Galactic Center line. The previous studies about the kinematic structure derived from the l-v diagrams of gasses also indicated a existence of the Galactic bar, and the pattern speed of the bar is approximately 40-60 km s−1 kpc−1, the inclination angle of the bar is approximately 10◦-30◦, and the half length of the bar is approximately 2-5 kpc.
Kinematic structure from radial velocities of stars: Most recent study of the streaming motions of the AGB stars in the Milky Way Galaxy was that by Deguchi et al. (2010) at the Galactic longitude between 20◦ and 40◦ based on the systemic velocities of the SiO masers and the distances derived from the magnitudes of K-band. They showed that deviant motions of > 100 km s−1 of maser stars are created by periodic gravitational perturbations of the bar, and that the effect appears most strongly at radii between the corotation and the Outer Lindblad Resonance.
Since Nakada et al. (1993), large SiO/H2O maser surveys for bulge IRAS sources observed with Nobeyama 45 m telescope were conducted. Izumiura et al. estimated
tilt angles (φ) and rotation rates of the Galactic bulge from l-v diagrams of SiO maser samples in several regions of |l| ≤ 15◦ and 3◦ ≤ |b| ≤ 15◦, −15◦ < l < 15◦ and 7◦ < |b| < 8◦, |l| < 15◦ and 4◦ < |b| < 5◦, |l| < 15◦ and 3◦ < |b| < 15◦ (exclude 4◦ < |b| < 5◦ and 7◦ < |b| < 8◦), which are 9.3±1.4 km s−1 (l deg−1) (corresponding to the bulge rotation velocity (Vrot) of 66.4±10.0 km s−1 kpc−1 assuming R0 = 8 kpc, Izumiura et al. (1993)), φ ≈ 18+18−14 deg and 10.4 ± 2.6 km s−1 (l deg−1) (corresponding to Vrot = 74.3 km s−1 kpc−1, Izumiura et al. (1994)), φ = 8+27−31 deg and 10.8 ± 2.7 km s−1 (l deg−1) (corresponding to Vrot = 77.1 km s−1 kpc−1, Izumiura et al. (1995a)), φ = 6.9+31.5−6.7 deg and 10.8 ± 1.2 km s−1 (l deg−1) (corresponding to Vrot = 77.1 km s−1 kpc−1, Izumiura et al. (1995b)), respectively. They have also surveyed SiO maser sources of the galactic central region. Fujii et al. (2006) suggested that l-v diagrams of the galactocentric SiO maser sources explained by x1/x2 orbital motions with distance modulus of K-band. For the SiO maser surveys in the galactic disk, Deguchi et al. (2000a) and Deguchi et al. (2000b) also estimated similar rotation rate of 10.7±1.4 km s−1 (l deg−1), corresponding to Vrot=76.4 km s−1 kpc−1 assuming R0 = 8.0 kpc and a tilt angle of 19+31−20 deg of the bulge.
For the OH maser sources, with Tremeine & Weinberg method, Debattista et al. (2002) estimated a pattern speed of the non-axisymmtertric feature as 59 ± 5 ± 10 (sys) km s−1 kpc−1 assuming R0 = 8 kpc and v0 = 220 km s−1, and the corotation radius is 3.7 ± 0.3+0.8−0.5 kpc. Habing et al. (2006) discussed about the distribution of OH/IR and SiO-maser stars in the l-v diagrams with CO and model orbits in a galactic potential. They found a strong effect of the corotation resonance at r =3.3 kpc, a small effect of the outer lindblad resonance at 5 kpc and no effect of the inner lindblad resonance at 0.8 kpc. The stellar orbits are almost circular at r & 3.5 kpc and the orbits become more and more elongated toward the Galactic Center in their model. The stellar kinematics of the Galactic bulge obtained with optical spectroscopy were also estimated, for instance, giants (e.g., Minniti (1996)), planetary nebulae (e.g., Beaulieu et al. (2000)) and so on.
Kinematic structure from proper motions of stars: Stellar proper motions in the Galactic bar region have been observed in some cases, for instance, in Baade’s
window (e.g., Koz lowski et al. (2006) with HST; Spaenhauer et al. (1992)), Plaut’s window (e.g., Vieira et al. (2007); Mendez et al. (1996)), Sgr I (Kuijken & Rich (2002) with HST), NGC 6558 (Soto et al. (2007)). Kuijken & Rich (2002) concluded that the bulge population is rotating from observed proper-motion anisotropy in bulge fields, and the bulge is dominated by old stars. Dehnen (1999) and Dehnen (2000) argued the bimodal (OLR and LSR modes) distributions of stellar velocities of late-type star in the solar neighborhood, as observed by HST, and estimated the pattern speed of the bar as 53±3 km s−1 kpc−1with an assumption of Ω0 ≈ 28.5 km s−1 kpc−1. In their studies, they also suggested that the Sun is situated slightly outside the radius ROLR
and bar angles between about 10◦ and 70◦. Soto et al. (2007) reported the progress in their measurement of the 3-D kinematics of the stars of the Galactic Bulge obtained with HST (proper-motions) and VLT (radial velocities) data. They showed that a significant vertex deviation close to the galactic minor axis field, and suggested the signature of triaxial structure of the stellar bar in the galactic bulge.
As above description, there are many studies and approaches for the bar structure of the Milky Way Galaxy, and it is widely accepted that the Galaxy has a bar in its central region. However, there are no studies of ”3-D” kinematics of gases around the bar by simultaneously obtaining accurate proper-motions and systemic velocities of gases. For the stellar 3-D motions, there is only one case of Soto et al. (2007) which is still preliminary result. Others, Sjouwerman et al. (2003) only proposed a study of the Galactic central region around few degrees with stellar 3-D motions of SiO maser. However, the high-accurate VLBI astrometry is able to provide 3-D motions of gasses around the Galactic bar, and this is a new approach to the bar studies.
1.2 VLBI Astrometry
Since Kurayama et al. (2005), VLBI (Very Long Baseline Interferometry) astromet- ric measurements have been providing highly-accurate annual parallax and absolute proper motions of individual maser sources toward star forming regions and AGB stars with typical error of ≈ 10 - 50 µas (microarcsecond) for parallaxes and ≈ a few
10 - 100 µas yr−1 for proper motions, respectively. In these measurements, the po- sition reference sources of distant QSOs are supposed as fixed coordinates. As an example, Honma et al. (2007) showed the flatness of the outer rotation curve of the Galaxy with S269 which is located at 13.1 kpc away from the Galactic center.
The highly-accuate measurements have been extensively conducted by three VLBI arrays in the world. The american VLBI array called the VLBA (Very Long Baseline Array) have ten telescopes with 25 m dish, and maximum baseline length is more than 8,000 km between Mauna Kea on the Big Island of Hawaii and St. Croix in the U.S. Virgin Islands. In Europe, the EVN (European VLBI Network) is being operated. The EVN have 20 telescopes include 305 m telescope of Arecibo in the U.S and the most sensitive VLBI array in the world. On the other hand, the only array dedicated to astrometry is the VERA (VLBI Exploration of Radio Astrometry) in Japan (figure 1.2). The VERA have four telescopes with 20 m dish, and the maximum baseline length is about 2,270 km (see table 1.1). The VERA telescopes are marked by having dual-beam system, which effectively correct for atmospheric fluctuations. The VERA is also used as part of the JVN (Japanese VLBI Network, figure 1.3) as its expansion. The JVN have large telescopes (Yamaguchi 32 m, Usuda 64 m) and shorter baselines below ∼1,000 km (see table 1.1).
The VERA telescopes have 6.7/22/43 GHz receivers to observe maser sources (figure 1.4-(b-e)). Especially, the 6.7 GHz receivers are newly installed in the VERA antennas in May 2009 (figure 1.4-(a)). The 6.7 GHz receivers in the VERA are used at room temperature and system temperature is about 110 K. As the first results of 6.7 GHz observation with the JVN including the VERA, Sugiyama et al. (2008a) presented VLBI image of 13 methanol sources at 6.7 GHz with the JVN (W3(OH), Mon R2, W 33A, IRAS 18151−1208, G 24.78+0.08, G 29.95−0.02, IRAS 18556+0136, W 48, OH 43.8−0.1, ON 1, Cep A and NGC 7538), and they demonstrated the possi- bility of VLBI observation of 6.7GHz methanol maser with long baseline of ∼50 Mλ. The EVN also observe the 6.7 GHz methanol maser sources (e.g., Rygl et al. (2010)). However, their observation schedules are limited only three sessions per one year. The VLBA currently do not have 6.7 GHz receiver, and they will install it as described
Table 1.1: Baseline length of the VERA and the Japanese VLBI Network at 6.7 GHz observation.
Array Baseline∗ Baseline†
[m] [Mλ]
Iriki-Yamaguchi (RY) 292,955 6.516428 Usuda-Yamaguchi (UY) 655,019 14.57010 Usuda-Iriki (UR) 878,168 19.53378 Iriki-Ishigaki (RS) 1,018,524 27.82780 Ogasawara-Usuda (OU) 1,065,666 23.70444 Iriki-Ogasawara (RO) 1,251,037 27.82780 Mizusawa-Iriki (MR) 1,266,754 28.17740 Ogasawara-Yamaguchi (OY) 1,287,848 28.64661 Ishigaki-Yamaguchi (SY) 1,298,939 28.89332 Mizusawa-Ogasawara (MO) 1,336,885 29.73738 Ogasawara-Ishigaki (OS) 1,826,711 40.63296 Usuda-Ishigaki (US) 1,874,175 41.68874 Mizusawa-Ishigaki (MS) 2,270,416 50.50264
∗: Baseline length on the earth.
†: f = 6.668518 GHz or λ = 4.495638 × 10² m
The JVN web page (http://www.astro.sci.yamaguchi-u.ac.jp/ kenta/jvnhp/)
IRIKI (Kagoshima)
ISHIGAKI
(Okinawa) OGASAWARA(Tokyo)
MIZUSAWA (Iwate)
Figure 1.2: The VERA array
in the astro2010 science white paper (Reid et al. (2009c)). On the other hand, the VERA can operate monthly observations at 6.7 GHz. Thus the VERA would play a big role in the VLBI astrometry with 6.7 GHz methanol maser now.
In the previous studies, 22 GHz H2O maser sources are dominant targets in VLBI astrometry. H2O masers are emitted from high/low mass star forming regions and circumstellar envelopes of AGB stars. There are many strong H2O maser sources and listed in Arcetri H2O Maser catalog (Comoretto et al. (1990); Brand et al. (1994); Valdettaro et al. (2001)). Currently, parallaxes and absolute proper motions of about 30 H2O maser sources have been already obtained (e.g., Hirota et al. (2008); Nakagawa et al. (2008); Reid et al. (2009b); Sato et al. (2010)).
43 GHz SiO maser sources are also observed for VLBI astrometry. SiO masers are mostly emitted from circumstellar envelopes of AGB stars and from a few star forming regions (Orion, W51, Sgr B2). Many SiO maser sources were discovered in previous surveys (c.f. Deguchi et al. (2010); Feast & Whitelock (2000)). SiO maser also provided high accuracy measurements of trigonometric parallaxes for a star forming
USUDA 64m
IRIKI 20m (VERA)
ISHIGAKI 20m (VERA)
MIZUSAWA 20m (VERA)
OGASAWARA 20m (VERA) YAMAGUCHI 32m
GIFU 11m
TOMAKOMAI 11m
TSUKUBA 32m TAKAHAGI 32m HITACHI 32m KASHIMA 34m
Figure 1.3: Arrays of the Japanese VLBI Network. The pictures show the telescopes having 6.7 GHz receiver.
DC Local
BBC Local ADAM
6066 6.7 GHz Receiver
22 GHz Receiver
43 GHz Receiver
A/D Converter ARD10012
Terminator (R)
Changer
Terminator
LHCP RHCP
(a) (b)
(c)
(e)
(d) (e)
Figure 1.4: Pictures of the VERA receivers.
region (Orion KL by Kim et al. (2008)) and a AGB stars (R Aqr by Kamohara et al. (2010)). The lifetime of SiO masers toward evolved stars are generally several months or less than one year (e.g., Diamond & Kemball (2003); Matsumoto et al. (2008)), which is shorter than H2O masers. There have been only two studies about parallax measurements of SiO maser sources now.
Recently, 6.7/12 GHz methanol maser sources are receiving more attentions as new targets of VLBI observations (e.g., Sugiyama et al. (2008a); Sugiyama et al. (2008b); Goedhart et al. (2005)). 6.7/12 GHz maser lines of methanol are categorized in ClassII (Menten et al. (1991a); Menten et al. (1991b)), and compact to be observed with VLBI (Menten et al. (1992)). These methanol maser sources are currently considered to be emitted only from massive star forming regions (Xu et al. (2008)). The number of detected sources is above 1,000, and still increasing by various surveys (e.g., Caswell (2009); Pandian et al. (2007); Pestalozzi et al. (2005); Pestalozzi et al. (2007); Szymczak et al. (2002)). Astrometric observations with the methanol masers has just been started recently (Sanna et al. (2009); Rygl et al. (2010)).
Reid et al. (2009a) combined results obtained by VLBI astrometries, and provided accurate galactic parameters, demonstrating that the VLBI astrometry is a powerful tool to explore the structure of the Milky Way Galaxy. They estimated the distance of the Galactic center R0 = 8.4 ± 0.6 kpc and a circular rotation speed Θ0 = 254 ± 16 km s−1. On the other hand, the current IAU values for the LSR motion are R0 = 8.5 kpc and Θ0 = 220 km s−1. Further more, combining positions, distances, proper motions, and radial velocities, Reid et al. (2009a) yielded complete three- dimensional kinematic informations, and found that star-forming regions are orbiting the Galaxy about 15 km s−1 slower than expected rotation speed for circular orbits. This trend is theoretically supported by Baba et al. (2009), which represent the results of the high-resolution, self-consistent N -body+hydrodynamical simulation of the Milky Way Galaxy. They found that arms are not quasi-stationary but transient and recurrent, as suggested in alternative theories of spiral structures. Because of this transient nature of the spiral arms, star-forming regions exhibit a trend of large and complex non-circular motions, which is qualitatively consistent with the VLBI
observations.
Recent years, four sources around the Galactic bar were observed with 12 GHz methanol maser (Bartkiewicz et al. (2008); Brunthaler et al. (2009); Sanna et al. (2009)). The large peculiar motions are found in these sources. These peculiar mo- tions are considered to be the results of gravitational perturbations from the Galactic bar. Baba et al. (2009) also showed larger peculiar motions around the bar structure than the motions around spiral arms. However, it is difficult to judge whether they are tracing the effect of the bar based on only four sources. Thus we need more sample sources to investigate the effect of the bar based on the 3-D motions of the sources. Around the bar, there are many 6.7 GHz methanol maser sources tracing massive star forming regions. In fact, the 6.7 GHz methanol maser sources are concentrated in the molecular ring on the longitude-velocity maps in Pestalozzi et al. (2007).
−180
−160
−140
−120
−100
−80
−60
−40
−20 0 20 40 60 80 100 120 140 160
−10180 0 10
Galactic longitude [deg]
b [deg]
−180
−160
−140
−120
−100
−80
−60
−40
−20 0 20 40 60 80 100 120 140 160 180
−100 0 100
Galactic longitude [deg] VLSR [km s−1 ]
Figure 1.5: 6.7 GHz methanol maser sources and the CO contours from Dame et al. (1987) (Pestalozzi et al. (2007)).
The 6.7 GHz methanol maser sources are attractive sources in investigations of dis- tant galactic structures. The 6.7 GHz methanol maser sources have second-strongest next to H2O maser and stronger than 12 GHz methanol maser (Menten et al. (1991b)). In addition, in higher frequencies such as 12 to 43 GHz the phase-reference sources become weak because the QSOs as the phase-reference sources usually become fainter at higher frequency (e.g., 22/43 GHz). Also, the 6.7 GHz methanol maser sources
generally have stable space distributions with flux time variations (e.g., Goedhart et al. (2004)), and small internal proper motions compared to the Galactic rotations (the velocity widths typically less than 10 km s−1, see Szymczak & Kus (2000)). Although lifetimes of H2O and SiO maser are month or one year scale, that of the methanol maser is decade scale (e.g., Moscadelli et al. (2010)). Therefore, the methanol maser sources are suitable for astrometric observations, which track same maser spot for one year or more.
Thus, with VLBI observations of 6.7 GHz methanol maser sources, we will be able to trace 3-D gas motions (systemic velocities and proper motions) to investigate the Galactic structure around the bar.
1.3 Aim of This Thesis
The aim of this thesis is an investigation of peculiar motions affected by the galactic bar structure and kinematically establish of the bar structure based on the 3-D gas motions. For this purpose, the present thesis consists of three steps as below. First, in order to test the astrometric performance of the VERA/JVN at 6.7 GHz, we measured the annual parallax and absolute proper motions of the 6.7 GHz methanol maser sources for the test source, W3(OH) (section 2). Second, we conduct the fringe check observations to select observable sources which can be used to trace the effect of the bar (section 3). Finally, we measure the three dimensional velocities for the sources considered to exist around the galactic bar structure, and discuss the bar effect seen in the 3-D gas motions (section 4).
Chapter 2
6.7 GHz Methanol Maser Toward
W3(OH) Ultracompact H II
Region
2.1 Introduction
6.7 GHz methanol maser sources are potential targets for VLBI astrometry to trace the 3-D structure of the Galaxy. The 6.7 GHz methanol maser line is the bright- est line among methanol maser emissions (Menten et al. (1991b)). Nearly 1,000 of 6.7 GHz methanol maser sources are already discovered in the Galactic plane (e.g., Green et al. (2009)). In addition, internal proper motions of the 6.7 GHz methanol masers are generally smaller than that of H2O masers, and structures of maser spots are stable for a period required by astrometric monitorings (1 year or more). Re- cently Rygl et al. (2010) reported first parallax measurements of 6.7 GHz methanol maser sources with the European VLBI Network (EVN). They show that the 6.7 GHz methanol maser sources can be used for VLBI astrometry. In order to conduct the VLBI astrometry of 6.7 GHz methanol masers, we have installed C-band receivers to the VERA (VLBI Exploration of Radio Astrometry). Test observations have al- ready started with the VERA or the Japanese VLBI Network (JVN) at 6.7 GHz
observation mode. The VERA is also included in the JVN Network. As one of the test observations, we conducted phase-referencing observations of W3(OH) to eval- uate the astrometric capability of the JVN/VERA. W3(OH) is one of the brightest sources in the 6.7 GHz methanol maser sources, and have been extensively studied. Accurate distances toward W3(OH) have been already reported by Xu et al. (2006) and Hachisuka et al. (2006). Hence W3(OH) is one of the best targets to investigate the astrometric capability of the JVN/VERA array.
W3(OH) is a massive star forming region located in the Perseus arm at 1.95 ± 0.04 kpc far from the Sun (Xu et al. (2006)). W3(OH) is famous as an UC HII region asso- ciated with a far-infrared source. A total luminosity of the far-infrared source was estimated to be 105 L⊙ (Campbell et al. (1989); Harper (1974)), which corresponds to a luminosity of a main-sequence star with spectral class O7 (Dreher & Welch (1981)). This exciting star is also detected by X-Ray observation with the Chandra (Feigel- son & Townsley (2008)). And a coordinate is determined as αJ2000.0=02h27m03.84s, δJ2000.0=+61d52’24”.9 with a position error of 0.4”. For the UC HII region itself, it is a limb-brightened shell with diameter about 103 AU measured at 15 GHz (Dreher & Welch (1981)). The expansion of the UC HIIregion was detected with typical speeds of 3 - 5 km s−1 by Kawamura & Masson (1998). In the western part of the UC HII
region, various maser emissions were detected: 12 GHz methanol maser (Moscadelli et al. (1999), (2002), (2010); Xu et al. (2006)), 6.7 GHz methanol maser (Menten et al. (1992); Harvey-Smith & Cohen (2006); Etoka et al. (2005)), 1.6/1.7/4.7/6/13 GHz OH masers (Norris et al. (1982); Bloemhof et al. (1992); Wright et al. (2004a, b); Fish et al. (2006); Harvey-Smith & Cohen (2006); Desmurs et al. (1998); Fish & Sjouwerman (2007); Baudry et al. (1998)). In addition to maser emissions, thermal lines of OH emissions/absorptions (Baudry et al. (1993)) and NH3 absorptions (Reid et al. (1987); Guilloteau et al. (1983)) were also detected in the western part of the UC HII region. In contrast to the western part, only few maser spots were found in the eastern part of the UC HII region (Fish & Sjouwerman (2007)). From these observations, several pictures were proposed by previous studies, for instance, a torus (Fish & Sjouwerman (2007); Dickel & Goss (1987); Guilloteau et al. (1983)), a disk
(Moscadelli et al. (2010); Wright et al. (2004b)), an expansion or a cometary bow- shock (Bloemhof et al. (1992)), an collapsing envelope (Reid et al. (1980)). To test these pictures, high resolution images and three-dimensional velocity structures are needed.
In this paper, we report two kinds of results about the 6.7 GHz methanol maser toward W3(OH) observed with JVN/VERA. The first results are about distributions and internal motions obtained with in-beam VLBI imaging and the second results are about phase-referencing astrometry.
2.2 Observations and Data Analysis
2.2.1 Observations
We observed a 6.7 GHz methanol maser emission toward W3(OH) (αJ2000.0=02h27m 03.81920s, δJ2000.0=+61d52’25.2300”, Xu et al. (2006)) from May 2008 to April 2010 with the JVN including the VERA. Table 2.1 summarizes these observations. For the phase-referencing, we conducted one-beam switching observations because all 6.7 GHz receiving systems are single-beam in the JVN as well as the VERA. W3(OH) and a phase-reference source of J0244+6228 were alternately observed with five-minute cycles (typically 2 and 1.8 min on-source integration times for the target maser and the reference source, and rest for slewing). The coordinate of J0244+6228 is αJ2000.0=02h44m57.69667s, δJ2000.0 = +62d28’06.5155” from ICRF, which is 2.17◦ separating from W3(OH). 3C 84 was also observed once one hour as a calibrator. Radio frequency of 6.668518 GHz are adopted in this observations as the rest fre- quency of CH3OH 51 → 60A+ transition. Left-handed circular polarization was received except at Iriki and Ogasawara stations at epochs 1 and 2, in which linearly polarized receivers were used. The received signals were filtered in a 16 MHz band- width channel (epoch 1 - 3), or 16 channels with 16 MHz bandwidth each (epoch 4 - 6). The filtered signals were recorded with SONY DIR1000 recorder at a rate of 128 Mbit s−1 (epoch 1 - 3) or DIR2000 recorder at a rate of 1024 Mbit s−1 (epoch 4 - 6). The recorded signals were correlated with the Mitaka FX correlator (Chikada
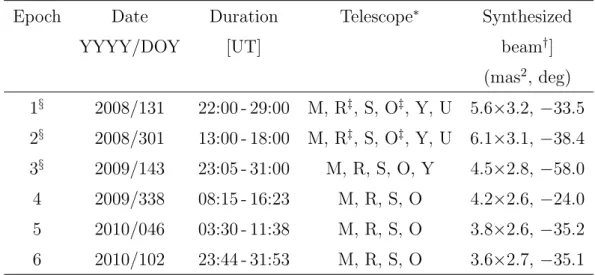
Table 2.1: Summary of the JVN observations.
Epoch Date Duration Telescope∗ Synthesized
YYYY/DOY [UT] beam†]
(mas2, deg) 1§ 2008/131 22:00 - 29:00 M, R‡, S, O‡, Y, U 5.6×3.2, −33.5 2§ 2008/301 13:00 - 18:00 M, R‡, S, O‡, Y, U 6.1×3.1, −38.4 3§ 2009/143 23:05 - 31:00 M, R, S, O, Y 4.5×2.8, −58.0 4 2009/338 08:15 - 16:23 M, R, S, O 4.2×2.6, −24.0 5 2010/046 03:30 - 11:38 M, R, S, O 3.8×2.6, −35.2 6 2010/102 23:44 - 31:53 M, R, S, O 3.6×2.7, −35.1
∗: Telescope code. M: VERA telescope at Mizusawa station, R: Iriki (VERA), S: Ishigaki (VERA), O: Ogasawara (VERA), Y: Yamaguchi, U: Usuda.
†: Synthesized beam size and position angle.
‡: The received signal was linear polarization.
§: The resolution of each velocity channel in the visibility data is 3.91kHz in marked epochs, and 15.63 kHz in other epochs.
et al. (1991)). Since the maser line is narrow and since the phase-reference calibrator is bright enough, we selected a small portion of bandwidth (4 MHz for epoch 1 - 3 or 8 MHz for epoch 4 - 6) in the correlation process. The selected band was centered at the maser line to obtain high spectral resolution. This produced auto-correlation and cross-correlation spectra consisting of 1024 spectral channels with a frequency spacing of 3.91 kHz (∼ 0.18 km s−1) for epoch 1 - 3, or 512 spectral channels with a frequency spacing 15.63 kHz (∼ 0.70 km s−1) for epoch 4 - 6.
2.2.2 In-beam and Phase-referencing Mappings
In this paper, we produced two types of maser maps: one is in-beam map for re- searching internal maser proper motions with respect to a reference maser spot, and the other is phase-referencing map for measuring absolute positions with respect to
the position reference source.
In both mappings, data reductions were performed using the NRAO AIPS package basically in a standard manner. The delay and delay-rate offset were calibrated using 3C 84. Bandpass responses were also calibrated using 3C 84. Amplitude calibrations were performed by template method with the total-power spectra of W3(OH). For data of Iriki and Ogasawara stations in epochs 1 and 2, we also applied special calibrations to correct amplitudes for the polarization difference (linear/circular) by using the method described in Sugiyama et al. (2008b).
For the in-beam mapping, fringe-fitting was conducted for a reference maser spot of vLSR = −45.4 km s−1 in W3(OH), which is the brightest spot in a W3(OH) methanol maser. In self calibration of the reference maser spot, models of clean components were made by the DIFMAP software package provided by Caltech, to obtain faint components of the continuum emission from the reference maser spot. The solutions of self-calibration were applied to other velocity channels of maser.
For the phase-referencing mapping, instead of the reference maser spot, fringe solutions were estimated for J0244+6228 with solution intervals of one minute. In self calibration of J0244+6228, models of clean components were also made with the DIFMAP, to obtain faint components of the continuum emission from J0244+6228, if exists. However, the source had no distinct structure in any epoch, and peak flux of J0244+6228 was about 600 - 1,000 mJy beam−1. The self-calibration solutions of J0244+6228 were applied to the data of W3(OH). Since the apriori delay model used in the correlator was not accurate enough for VLBI astrometry, we recalculated more precise delays and we corrected for the differences between them. The difference in optical path length was ∼ 2 mm or less between our recalculated model and the CALC9 model developed by the NASA/GSFC VLBI group. In this correction, the visibility phase errors caused by tropospheric delay were calibrated based on GPS measurements (Honma et al. (2008)). The ionospheric delay was also calibrated based on the data of the total vertical electron content produced by JPL.
Synthesis imaging and deconvolution were performed using the AIPS task IMAGR with uniform weighting. The results of synthesized beam size (FWHM) and position
angle are listed in table 2.1. Both kinds of maps were made with 4086 pix × 4086 pix, and a pixel size of 0.5 mas pix−1). When we made the phase-referencing maps, for epochs 1 - 3, every four velocity channels were combined into one to make a velocity resolution equal through all the epochs. For in-beam maps, there was no need to combine channels as above because we used the data with the same velocity resolution in epochs 1 - 3. Finally, the maser positions were derived by gaussian fitting using the AIPS task JMFIT for the in-beam maps.
2.2.3 Derivation of Internal Proper Motions
To investigate maser distribution and internal proper motion, we used the in-beam maps of epochs 1 - 3. This is because epochs 4 - 6 did not include antennas with large apertures such as Yamaguchi 32 m and Usuda 64 m, and hence the number of detected spots were decreased drastically compared to epochs 1 - 3. All maser spots whose signal-to-noise ratios are larger than 10 were considered for maser identification to derive proper motions. We identified maser spots with the same velocity within a beam size (θbeam) between epochs, because the proper motions of the methanol maser were expected to be small. In fact, most of the spots were identified within a separation of one mas. For maser spots identified at all three epochs, we conducted least-square fitting of the linear proper motion to position-time data sets. In the present study, minimum proper motions which we can detect are roughly estimated by 0.1θbeam/ ∆tobs, which are ∼ 0.58 mas yr−1 or ∼ 5.4 km s−1 using the distance of 1.95 kpc. ∆tobs is a maximum time-span between observations, which is 378 days between epochs 1 and 3. The value of 0.1 corresponds to the lowest signal-to-noise ration of 10 in our map. Signal-to-noise ratio ranged typically about 10 - 150.
2.2.4 Derivation of Annual Parallax and Absolute Proper
Motion
Using spot positions in the phase-referenced maps, we obtained absolute proper mo- tions of 6.7 GHz maser spots toward W3(OH) with respect to the extragalactic source
of J0244+6228. Finally, six maser spots were selected to derive an annual parallax and absolute proper motions on the following conditions. Each maser spot has the same systemic velocity, apparently similar structure and been living throughout all epochs. These six maser spots have signal-to-noise rations greater than 10. The abso- lute motion of each maser spot can be modeled by the sum of a linear proper motion and an annual parallax. In this astrometric analysis, we assumed that all maser spots have a same annual parallax, and we simultaneously determined the proper motions and the initial positions in right ascension and declination along with the common annual parallax by a least-squares analysis of the six maser spots. When the common annual parallax and the absolute proper motion of each spot were estimated, these six maser spots were assumed to have the same error bars which were determined so that the reduced χ2 becomes unity. In error estimations of the values from the fitting, the degrees of freedom were recalculated after the fitting because spots in a same feature were supposed not to be independent. We adopted the most conservative approach of assuming 100% correlation and the errors of the parallax and proper motions of each spots are enlarged by a factor of 1.23 (=√47/31) compared to the error from the least-square fitting. This is because degree of freedom of independent six spots data is 47 [= 6 (spots) × 6 (epochs) × 2 (positions of RA and Dec) − 25 (parameters of one π and each spots of RA position, Dec position, µlcos b, and µb)], in spite of a degree of freedom of independent four spots data is 31 [= 4 (spots) × 6 (epochs)
× 2 (positions of RA and Dec) − 17 (parameters of one π and each spots of RA position, Dec position, µlcos b, and µb)]. With the fitting results, averaged proper motions of the six spots were also estimated. A deviation of the proper motions was also estimated with a degree of freedom (ν) of 3 = [6 (spots) − 2 (same feature) − 1] in a equation of σ =
√
{∑6i=1(xi− ¯x)2}/ν.
1000Jy 100Jy 10Jy 1Jy
R.A. Offset [mas] Dec Offset [mas] 0-1000-2000
2000 1000 0 -1000
-49.0 -46.1 -41.8 VLSR [km s-1]
1000Jy 100Jy 10Jy 1Jy
R.A. Offset [mas]
150 100 50 0
Dec Offset [mas] 0-50-100-150
-50
50 (C)
A
B C
D
E F G
2000AU at D=1.95 kpc
Figure 2.1: Left : The distribution of 6.7 GHz methanol maser spots. The sizes of the plotted circles are proportional to the integral flux intensity of the spots which was observed on DOY 301 in 2008 (epoch 2), on the logarithm scale. The errors in the positions of the features are smaller than the circle sizes. Color-codes rep- resent the LSR velocity. The dashed line is a 15 GHz radio continuum map of the UC HII region (Bloemhof et al. (1992)). The position of the ionizing star is shown by brown cross with error bar (Feigelson & Townsley (2008)). The origin of this map is αJ2000.0=02h27m03.818s, δJ2000.0=61d52’25.248”. Right: Zoom-in view of the left panel around the map origin.
2.3 Results
2.3.1 Spatial Distribution and Internal Proper Motion
The number of spots detected in the in-beam map was 129 in epoch 1, 135 in epoch 2 and 149 in epoch 3. Figure 2.1 shows the spatial and velocity distribu- tion of 6.7 GHz methanol maser spots with the integral flux intensity at epoch 2. The absolute position of the maser spot with vLSR = −45.4 km s−1 at (0, 0) co- ordinate in figure 2.1 (301 doy in 2008) is αJ2000.0 =02h27m03.8178s ± 0.0080s, δJ2000.0 = +61d52’25.24824” ± 0.00049” which is obtained from the absolute as- trometry with respect to J0244+6228 (see section 2.3.2). This error is dominated by the position accuracy of phase-reference source J0244+6228 in the ICRF catalog. In figure 2.1, 15 GHz radio continuum in Bloemhof et al. (1992) is superimposed by using methanol and OH maser coordinates in figure 6 in Bloemhof et al. (1992). The ionizing star position from Feigelson & Townsley (2008) is also plotted.
We found seven clusters denoted as clusters A - G in figure 2.1. The radial velocity of spots ranges from vLSR= −41.5 to −48.9 km s−1. The red-shifted components are in the south part (clusters D - G), and the blue-shifted components are in the north part (clusters B, C). These seven clusters of maser spots extended over an area of about 1.3” × 2.3” area. This distribution indicates that 6.7 GHz methanol masers spread much wider than the UC HII region in the south-north direction. These methanol masers are mainly distributed in the western part of the UC HII region on the sky plane. Maser distribution of the 6.7 GHz methanol maser is similar to OH maser distribution, but 6.7 GHz methanol maser has a more patchy than the distribution of the 6035 MHz OH maser (see figure 1 of Fish & Sjouwerman (2007)).
The most complicated velocity/spatial distribution was seen in cluster C in fig- ure 2.1. Only cluster C have a wide velocity range of about 6.7 km s−1 (vLSR is from
−42.2 to −48.9 km s−1). On the other hand, the other maser clusters have narrower velocity range, being 1.2 km s−1 or less. These trends have basically been maintained for more than 16 years between our results and Menten et al. (1992). However, the velocity range of the cluster C is about 2.4 km s−1 wider than the results of Menten
et al. (1992), and there are some velocity shifts less than 1 km s−1 for the other clusters.
Figure 2.2 shows internal proper motions of 107 maser spots in the in-beam map. These motions are relative to the reference maser spot with vLSR = −45.4 km s−1. We note that measured internal proper motions are fairly small. In fact, only 14 maser spots were detected their proper motions with 3σ or larger value in the least-square fitting. Nearly half (56 spots) have only 1σ detection. Therefore, most of proper motions of individual spots did not have high accuracies and hence, motions of each spot may not be reliable. In addition, variations of maser spots structures could also have an influence on the proper motion measurements of spots. Thus, to obtain more reliable motions, we averaged the maser proper motions with equal-weighting in each maser cluster with that of A to G, and derived relative motions of each maser cluster (A, B, D - F) to cluster C. These motions are also plotted in bottom-left panel of figure 2.2 with thick black vector. The global motions for South-North direction were larger than for East-West direction. Southern maser clusters E - G show motions toward the south, and moving away from cluster C.
In the bottom-left panel in figure 2.2, internal proper motions of 1665 MHz OH maser and 15 GHz radio continuum of Bloemhof et al. (1992) were superposed to our re- sults. Note that the reference spot of vLSR = −43.88 km s−1 was used to derive internal proper motions in Bloemhof et al. (1992) while we used the reference spot of vLSR = −45.4 km s−1 for methanol masers. Therefore, there could be an unknown proper motion offsets between our results and Bloemhof et al. (1992). However, since these reference spots are in the same region of cluster C and the difference in sys- temic velocities is only 1.5 km s−1, the proper motion offset is expected to be small. Actually, most of the derived internal proper motions are about 3 to 5 km s−1, and proper motions of OH and methanol masers show a similar trend of expansions in figure 2.2, implying that the proper motion offset is fairly small. Detailed discussion on the proper motions of the maser spots are given in section 4.2
R.A. Offset [mas]
10005000-500-1000-1500-2000-2500
1500 1000 500 0 -500 -1000 -1500
Dec Offset [mas] Dec Offset [mas]
Dec Offset [mas]
R.A. Offset [mas] -49-48-47-46-45-44-43-42
Vlsr [km s-1] 5 km s-1 at D=1.95 kpc
(0.54 mas yr-1)
5 km s-1 at D=1.95 kpc (0.54 mas yr-1)
10005000-500-1000-1500-2000-2500
150 100 50 0
500-50-100
-50
5 km s-1 at D=1.95 kpc (0.54 mas yr-1)
-150
A
B C
D
E F G
(C)
A
C B
D
E F G
Figure 2.2: Left: The internal proper motion for 6.7 GHz methanol maser spots toward W3(OH). Color-codes represent the LSR velocity. The colored vectors show directions and amplitudes of relative proper motions on the sky plane to the reference spot with −45.4 km s−1 LSR velocity. The scale of vector is presented by a black colored thin vector. Right: Zoom-in view of top-left panel around origin. Bottom- left: The colored vectors are the same as the top-left one. The thick black vectors show averaged relative proper motion at each A - G cluster to the C cluster around the origin. The proper motion vectors of 1665 MHz OH maser and the contour map of 15 GHz radio continuum emission of the UC HII region taken from figure 7 of Bloemhof et al. (1992) are also shown as outlined black vectors and broken lines, respectively.
2.3.2 Parallax and Absolute Proper Motion
We detected the absolute proper motions of six maser spots in the cluster C based on the method described in section 2.2.4. These motions are presented in figure 2.3. The fitting results with the annual parallax and the absolute proper motions are also shown in figures 2.3 and 2.4, and listed in tables 2.2 and 2.3. The fitting yielded the annual parallax π = 0.633 ± 0.112 (err: 18%) mas for 6.7 GHz methanol maser toward W3(OH). This parallax corresponds to a distance of 1.58+0.34−0.24kpc from the Sun. This result is almost consistent with the previous results (Xu et al. (2006); Hachisuka et al. (2006)), as will be discussed in detail in section 2.4. The fitting error of the absolute proper motion of each maser spot is 0.39 toward the east and 0.25 toward the north. The average proper motion also estimated as −1.10 ± 0.30 mas yr−1 toward the east and −0.16 ± 0.38 mas yr−1toward the north. Each error in the average proper motion is standard deviation of the averaged proper motions of six maser spots in table 2.2. The standard deviations of the post-fit residuals, which are determined so that reduced χ2 becomes unity, was obtained as σα = 0.53 mas and σδ= 0.33 mas in right ascension and declination, respectively. These residuals are likely to represent the positional uncertainties in the present astrometric observations. These residuals are larger than the errors derived from the dynamic ranges of the phase-referencing maps for each maser spot, which can be estimated as 0.5θbeam/SNR (Reid et al. (1988)), corresponding to 0.02 - 0.18 mas in our data. These residuals are most likely originate in atmospheric zenith delay residuals and/or structural variations of the maser spots (for examples of detailed discussions, see Honma et al. (2007) and Hirota et al. (2008)). In our results, it is unusual that the residual value of right ascension is larger than the value of declination. This result could be attributed to a large position offsets in the third epoch (2009/143) as can be seen in figure 2.4. If we fit the data excluding the third epoch, the resultant distance value is consistent within the mutual error (17%; π = 0.626 ± 0.105 mas, corresponding to D = 1.60+0.32−0.23 kpc) and the residual become comparable between right ascension and declination (σα = 0.30, σδ = 0.30). Thus, the large residual in right ascension is probably affected by the outliers in the third epoch. However, to be conservative, we take the results including the 3rd epoch
as the final astrometric results in the present paper.
-20 -15 -10 -5 0 5 10 15 20
0 200 400 600 800 1000
DEC offset [mas]
DOY [day] -10
-5 0 5 10
0 200 400 600 800 1000
RA offset [mas]
DOY [day]
1 2
3
4a 4b
1
2 3 4a
4b
4c
4c
Figure 2.3: Results of fitting the parallax with absolute proper motion. Labels of 1, 2, 3, 4a, 4b, 4c correspond to the LSR velocity vLSR = −43.10, −43.80, −44.50,
−45.91, −45.20, −46.60 km s−1, respectively. Left : The movement in right ascension as a function of time. The first day is New Year’s day, 2008. Black circles and vertical vars represent the position offset of the spots and fitting weight, respectively. Black
×-marks represent the ideal position offset of the spots on the least-square fitting. Solid lines and broken lines represent the results of the least-square fitting of absolute proper motion for the spots, and the absolute proper motion modulated by the annual parallax, respectively. Right : The same as the left in declination.
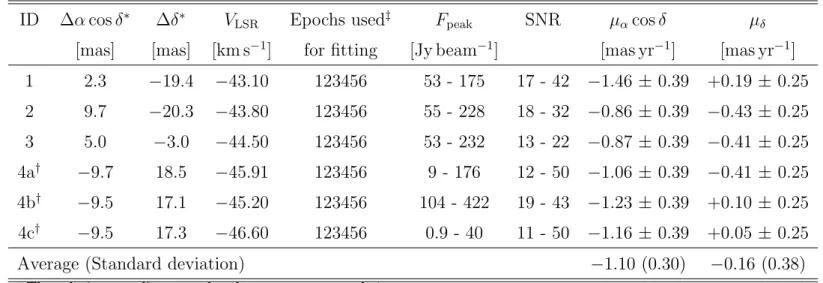
Table 2.2: Parallax and absolute proper motion fitting.
ID ∆α cos δ∗ ∆δ∗ VLSR Epochs used‡ Fpeak SNR µαcos δ µδ
[mas] [mas] [km s−1] for fitting [Jy beam−1] [mas yr−1] [mas yr−1] 1 2.3 −19.4 −43.10 123456 53 - 175 17 - 42 −1.46 ± 0.39 +0.19 ± 0.25 2 9.7 −20.3 −43.80 123456 55 - 228 18 - 32 −0.86 ± 0.39 −0.43 ± 0.25 3 5.0 −3.0 −44.50 123456 53 - 232 13 - 22 −0.87 ± 0.39 −0.41 ± 0.25 4a† −9.7 18.5 −45.91 123456 9 - 176 12 - 50 −1.06 ± 0.39 −0.41 ± 0.25 4b† −9.5 17.1 −45.20 123456 104 - 422 19 - 43 −1.23 ± 0.39 +0.10 ± 0.25 4c† −9.5 17.3 −46.60 123456 0.9 - 40 11 - 50 −1.16 ± 0.39 +0.05 ± 0.25
Average (Standard deviation) −1.10 (0.30) −0.16 (0.38)
∗: The relative coordinate to the phase center at epoch 1.
†: Spots in the same maser feature. Each data in this feature is supposed to be not independence when we estimated the fitting errors.
30