A dynamical systems approach for estimating
phase interactions between rhythms of
different frequencies from experimental data
Takayuki Onojima*, Takahiro Goto, Hiroaki Mizuhara, Toshio Aoyagi*
Graduate School of Informatics, Kyoto University, Kyoto, Japan
*[email protected](TO);[email protected](TA)
Abstract
Synchronization of neural oscillations as a mechanism of brain function is attracting increas-ing attention. Neural oscillation is a rhythmic neural activity that can be easily observed by noninvasive electroencephalography (EEG). Neural oscillations show the same frequency and cross-frequency synchronization for various cognitive and perceptual functions. How-ever, it is unclear how this neural synchronization is achieved by a dynamical system. If neu-ral oscillations are weakly coupled oscillators, the dynamics of neuneu-ral synchronization can be described theoretically using a phase oscillator model. We propose an estimation method to identify the phase oscillator model from real data of cross-frequency synchro-nized activities. The proposed method can estimate the coupling function governing the properties of synchronization. Furthermore, we examine the reliability of the proposed method using time-series data obtained from numerical simulation and an electronic circuit experiment, and show that our method can estimate the coupling function correctly. Finally, we estimate the coupling function between EEG oscillation and the speech sound envelope, and discuss the validity of these results.
Author summary
In this paper, we propose an estimation method to identify a dynamical system from rhythmic time-series data. Rhythmic activities have been observed frequently and are syn-chronized in various fields, and synchronization is an important topic in nonlinear sci-ence. It is well known that such synchronization can be described theoretically by a phase oscillator model under the condition that the rhythmic activities can be considered weakly coupled limit-cycle oscillators. Based on this theory, we propose a method to identify the interaction between rhythmic activities as a network of phase oscillators. A practical advantage of the proposed method is that, without detailed modeling, we can extract the phase oscillator model directly from time-series data. For the above theoretical and practi-cal reasons, this method can be applied to rhythmic data from a wide range of fields. In this study, we have focused on human brain activities in which electroencephalography (EEG) signals are often synchronized with each other and with external periodic stimuli. We demonstrate that the proposed method can successfully estimate the interaction a1111111111
a1111111111 a1111111111 a1111111111 a1111111111
OPEN ACCESS
Citation:Onojima T, Goto T, Mizuhara H, Aoyagi T (2018) A dynamical systems approach for estimating phase interactions between rhythms of different frequencies from experimental data. PLoS Comput Biol 14(1): e1005928.https://doi.org/ 10.1371/journal.pcbi.1005928
Editor:Bard Ermentrout, University of Pittsburgh, UNITED STATES
Received:August 10, 2017
Accepted:December 14, 2017
Published:January 16, 2018
Copyright:©2018 Onojima et al. This is an open access article distributed under the terms of the Creative Commons Attribution License, which permits unrestricted use, distribution, and reproduction in any medium, provided the original author and source are credited.
Data Availability Statement:All relevant data are within the paper and its Supporting Information files.
between EEG activity and speech rhythm. Consequently, the proposed method can reveal the role of neural synchronization.
Introduction
Synchronization of neural oscillations is considered an important activity that can help reveal the mechanisms underlying various cognitive functions. Neural oscillation is a rhythmic neu-ral activity and is usually observed by electroencephalography (EEG). Neuneu-ral oscillations are classified into a few frequency bands (e.g. delta, theta and alpha frequency bands) and are syn-chronized within the same-frequency band between different brain areas during various cog-nitive tasks [1–4]. Synchronization of oscillations of the same frequency is considered to integrate distributed brain activities [5] and regulate communication between distant neural groups [6,7].
Synchronization between slow and fast oscillations (cross-frequency synchronization) also appears during a few cognitive tasks [8–11]. In particular, 1:pphase synchronizations (pis an integer) can be observed in the resting state, mental arithmetic tasks, and working memory tasks [12–17], and may integrate activities over different time scales [18]. 1:pphase synchroni-zation refers to phase locking of a single cycle of one oscillation topcycles of the other oscilla-tion. Although 1:pphase synchronization is considered important from the perspective of brain function, to the best of our knowledge, there is no effective and practical method to ana-lyze the 1:pphase synchronization mechanism.
Various methods to identify this synchronization have been used in EEG studies. For exam-ple, the phase locking index is used frequently to identify phase synchronization. This index measures the temporal consistency or intertrial variability of the phase difference between dif-ferent brain areas or cross-frequency oscillations [2,19–22]. In addition, the directional con-nectivity between neural oscillations has been evaluated in terms of transfer entropy [23,24]. Transfer entropy evaluates the directed transfer of information between two random pro-cesses. Many previous studies have examined the roles of neural oscillation using these meth-ods. However, these methods could not reveal how neural synchronization is achieved by a dynamical system. Therefore, we have developed a method to identify a dynamical system for synchronization.
It is widely believed that the dynamical system of EEG activity can be described by the neurophysiological model of a cortical column [25,26]. If this dynamical system can be explained by a weakly coupled oscillator, the corresponding neurophysiological model can be described using the phase oscillator model in which each oscillator is described by only one variable, i.e., the phase [27]. Some previous studies have provided estimation methods to derive the phase oscillator model directly from time-series data without detailed modeling [28–34]. However, such methods cannot be applied to cross-frequency synchronization data. Therefore, we extend previous methods to make them applicable to 1:pphase synchronization.
In this paper, we describe an extended method to explain 1:pphase synchronization based on the phase oscillator model and verify the reliability of the estimation method through numerical simulation and an electronic circuit experiment. Then, we apply the proposed method to EEG oscillation and speech sound. Speech rhythms are synchronized with neural activity in a listener’s brain [35], and speech rhythm consists of a few important linguistic com-ponents (e.g., syllable and prosody). It is believed that synchronization between neural oscilla-tion and linguistic rhythm contributes to parsing continuous speech [36] and predicting the timing of linguistic component production [35] [37]. Furthermore, the causality between EEG
Grant Numbers 16KT0019, and 15587273. The funders had no role in study design, data collection and analysis, decision to publish, or preparation of the manuscript.
activity and speech sound is clear, whereas the causality among neural activities is generally unknown in advance. Therefore, we estimate interactions between EEG activity and speech sound to confirm the validity of the estimation results and demonstrate that the proposed method can successfully estimate the dynamical system based on EEG data.
Materials and methods
Ethics statement
The scalp EEG experiment was approved by the ethics committee of the Unit of the Integrated Studies of the Human Mind, Kyoto University (24-p-19). Participants provided written informed consent according to the Declaration of Helsinki and were paid for their participation.
Estimation of phase coupling functions for cross-frequency
synchronization
Neural oscillations can be observed easily from EEG data, and many EEG studies have reported various types of synchronization [8,38], which can be roughly divided into same- and cross-fre-quency synchronization. A few experimental results suggest that same-frecross-fre-quency phase-phase synchronization plays a role in modulating neuronal interaction [6,7]. In contrast, cross-fre-quency synchronization is considered to play a role in the integration of activities over different time scales [18]. However, it is unclear how these synchronizations, particularly 1:pphase syn-chronization, are achieved by a dynamical system. Therefore, we developed an effective method to identify the dynamical system that performs these synchronizations.
In general, synchronization of neural oscillation is thought to be described by a network of limit-cycle oscillators, which can be described generally by the multidimensional differential equationdX
i
dt ¼Fið Þ þXi PN
j6¼iGijðXi;XjÞ, whereXidenotes the multidimensional state of thei
-th oscillator, such as membrane voltages and gate variables of ionic channel. We assume -that a systemXican generate a limit-cycle oscillation by itself without external interaction. An EEG signal is thought to be generated by some neuronal system consisting of many interacting neu-rons. In this context, it is plausible that the neuronal system of an EEG signal can be repre-sented by theXisystem. According to the phase reduction method, the limit-cycle oscillator can be characterized theoretically by a phaseϕas a simple dynamical system with one degree of freedom. If the oscillators are weakly coupled, the dynamics of the networks amongN oscil-latory systems can be described by [27,39]:
di
dt ¼oiþ PN
j6¼iGi;jðj iÞ; ð1Þ
whereωiis the natural frequency of the oscillator andΓi,jis a phase coupling function
repre-senting the influence from thej-th oscillator to thei-th oscillator. It is known theoretically that the phase coupling function depends only on the phase differenceϕj−ϕi. When the phase dif-ference is constant over time, these oscillators are said to be synchronized. Specifically, the syn-chronization of same-frequency oscillators is referred to as 1:1 phase locking. Eq (1) can describe the 1:1 phase-locking state between rhythms in real systems.
model expressed by Eq (1). Therefore, we consider the 1:pphase-locking state among slow and fast oscillators. If 1:pphase locking occurs, the value of the phase differenceϕ2−pϕ1is constant
over time, whereϕ1andϕ2are slow and fast phases, respectively. Using the phase reduction
theory, we found that 1:pphase locking can be described as follows [39–41]:
o1 :o2ffi1 :p; ð2Þ
d1
dt ¼o1þG1;2ð2 p1Þ; ð3Þ
d2
dt ¼o2þG2;1ðp1 2Þ: ð4Þ
Here, we explain a simple case of two coupled oscillators described by Eqs (2)–(4). Note that many real rhythmic systems generally consist of many oscillators. We assume that the ratio of the natural frequencies of the two oscillators is close to some integerp. Note that, in this situa-tion, the coupling functionΓ1,2depends on only the phase differenceϕ2−pϕ1.
In our approach, to investigate the nature of interactions between neuronal rhythms, we directly estimate both the natural frequenciesωiand the phase coupling functionsΓi,jfrom
experimental time-series data. In addition, considering unavoidable sources of uncertainty (e.g., observational error or additional unknown disturbance to the system), we introduce independent Gaussian white noiseηi(t) into the phase oscillator model as follows:
oi:o
jffipi:pj; ð5Þ
di
dt ¼oiþ PN
j6¼iGi;jðpij pjiÞ þZið Þt : ð6Þ
Here, we assume that the independent Gaussian white noiseηi(t) satisfieshηi(t)i= 0,hηi(t)
ηj(t0)i= 2Diδijδ(t−t0), whereδijandδ(t) are the Kronecker delta and the Dirac delta functions,
respectively.Diindicates the noise strength andpiϕj−pjϕidenotes the phase difference, where thepvalues are integers. Note that this phase oscillator model can explainpi:pjsynchronization (e.g., 2:3 phase synchronization and 2:7 phase synchronization). We estimate the phase oscilla-tor model (Eq (6)) using almost periodic time-series data. In the following, we employ a straightforward extended version of a previously proposed method [28] and explain the out-line of our method.
First, we transformed the experimentally-recorded signals(t) into the phase time-seriesθ(t) by computing the analytic signal as follows:
AðtÞeiyiðtÞ¼s
iðtÞ þis H
i ðtÞ; ð7Þ
wheresH
i ðtÞdenotes the Hilbert transformation of the recorded signalsi(t) [42], andθ(t) is the phase of the analytic signal. However, the variableθis generally different from the phaseϕin Eq (1) because, according to phase reduction theory,ϕevolves linearly over time without inter-action and noise. It is therefore necessary to transformθintoϕ, as follows [30,31]:
ðyÞ ¼2pRy
0fðy
0Þdy0; ð8Þ
wheref(θ) denotes the probability density distribution ofθ.
Fourier series expansion of the coupling function as:
GijðcijðttÞÞ ¼a
ð0Þ
ij þ PMij
m¼1fa
ðmÞ
ij cosðmcijðttÞÞ þb
ðmÞ
ij sinðmcijðttÞÞg; ð9Þ
whereψi,j(tτ) is the extended version of the phase differencepiϕj(tτ)−pjϕi(tτ) at timetτ. The
timestτare discrete points,tτ=t1+ (τ−1)Δtforτ= 1,2, ,T, andΔtis the sampling interval.
In this expansion,Mijdenotes the Fourier series order for each coupling function, and the parametersMijcontrol the complexity of the coupling function. The parametersMijcan be
determined by a model selection method based on logarithmic evidence, as explained later. Finally, the proposed method estimates the model as follows:
di
dt ð Þ ¼tt o^iþ PN
j6¼i PMij
m¼1fa
ðmÞ
ij cosðmcijðttÞÞ þb
ðmÞ
ij sinðmcijðttÞÞg þZið Þtt ; ð10Þ
whereo^
i ¼oiþ PN
j6¼ia ð0Þ
ij . Thus, the unknown model parameters arefo^i; a ðmÞ ij ;b
ðmÞ
ij giandDi. Here,fo^
i; a ðmÞ ij ;b
ðmÞ
ij gidenotesfo^i; a ðmÞ ij ;b
ðmÞ
ij jj¼1;2; ;N;m¼1;2; ;Mijg. The phase velocitydi
dt is a dependent variable in a standard linear regression problem that is computed from phase time-series data as {(ϕi(tτ+1)−ϕi(tτ))/Δt}. Furthermore, an independent variable is
computed by the phase difference as {cos(mψij(tτ)),sin(mψij(tτ))}i. Here,ηiis an independent
and identically distributed random variable. This linear regression problem corresponds to maximizing the following likelihood function:
LðfiðttÞgjfo^i;a ðmÞ ij ;b
ðmÞ
ij gi;DiÞ ¼ QT
t¼1N _
iðttÞjo^iþ PN
j6¼i ^
Gi;j ci;jðttÞ
;2Di Dt
; ð11Þ
whereG^i;jequalsGij a ð0Þ
ij , andN(x|μ,σ2) denotes Gaussian distribution, whereμandσ2are the mean and variance ofx, respectively. Using Bayesian theory, the product of the likelihood function and the prior distributionpðfo^
i;a ðmÞ ij ;b
ðmÞ
ij gi;DiÞis proportional to the posterior dis-tributionpðfo^
i;a
ðmÞ
ij ;b
ðmÞ
ij gi;DijfiðttÞgÞ:
pðfo^ i;a
ðmÞ ij ;b
ðmÞ
ij gi;DijfiðttÞgÞ /LðfiðttÞgjfo^i;a ðmÞ ij ;b
ðmÞ
ij gi;DiÞpðfo^i;a ðmÞ ij ;b
ðmÞ
ij gi;DiÞ: ð12Þ
Here, we adopt a Gaussian inverse gamma distribution for the prior distribution
pðfo^ i;a
ðmÞ ij ;b
ðmÞ
ij gi;DiÞ. This prior distribution is a conjugate to the likelihood function (the so-called conjugate prior):
pfo^ i;a
ðmÞ ij ;b
ðmÞ ij gi;Di
¼N
fo^
i;a ðmÞ ij ;b
ðmÞ ij gijwoldi ;
2D i Dt S old i
IG 2Di
Dt ja
old i ;b
old i
; ð13Þ
whereIG(x|α,β) denotes the inverse gamma distribution with shape parameterαand scale param-eterβ.wold
i and
2Di
DtS old
i are the mean and covariance of model parameterso;^ a
ðmÞ, andb(m),
respec-tively. Note that the prior parameterswold i ; S
old i ; a
old i , andb
old
i are referred to as hyperparameters. We can easily calculate the posterior distribution parameters from the conjugate prior distribution and the likelihood function in Eq (12) (S3 File). The posterior distribution with the updated parameters takes the form of a Gaussian inverse gamma distribution:wnew
i ; S new i ; a
new i , andb
new i . The estimated model parameters are the mean ofNðfo^
i;a ðmÞ ij ;b
ðmÞ ij gijw
new i ;
2Di
DtS new
i Þ. The estimated noise level is the mean ofIG 2Di
Dtja new i ;b
new i
we can compute the logarithmic evidence logp({ϕi(tτ)}):
log pðfiðttÞgÞ ¼log
LðfiðttÞgjfo^i;a ðmÞ ij ;b
ðmÞ
ij gi;DiÞpðfo^i;a ðmÞ ij ;b
ðmÞ ij gi;DiÞ
pðfo^ i;a
ðmÞ ij ;b
ðmÞ
ij gi;DijfiðttÞgÞ
: ð14Þ
Thus, we findMijwith the largest logarithmic evidence among all models.
Electronic circuit of van der Pol oscillator
To test the proposed method, we conducted an experiment in which an electronic circuit was used to implement two coupled van der Pol oscillators [45]. The coupling functionΓi,jbetween
the oscillators can be obtained theoretically from the corresponding differential equations. In this experiment, we recorded the rhythmic signals of the electronic circuit. Each os-cillator consisted of two multipliers U1(AD633, Low Cost Analog Multiplier) and three
operational amplifiers U2(TL082,½Dual BiFET Op Amp) (Fig 1A). We conducted two
exper-iments under different conditions. In the first experiment, two same-frequency oscillators were coupled directly. In this experiment, 1:1 phase locking was expected to occur. The param-eters of the electronic component were set toR1= 100kO,R2= 1kO,Rcoupling= 1MO,C1=C2=
0.01μF,V1= 0.115V, andV2= 0.12V. Rkand Ciare the parameters of the resistor and
capaci-tor, respectively. VoltagesViwere monitored using a digital voltmeter. In the second experi-ment, a slow oscillator was coupled to a fast oscillator. In this experiexperi-ment, 1:2 phase locking was expected to occur. The natural frequencies of the slow and fast oscillators were set to sat-isfy a nearly 1:2 ratio. The parameters of the electronic components were the same as those in the first experiment, except thatC1was changed toC1= 0.02μF to reduce the natural frequency
by one-half. In both cases, the electric potentials xiand yiwere recorded using an I/O device
(NI SCB-68, National Instruments, US). The sampling rate of the electric potential was 15,000 Hz, and the data size was 180 s.
The corresponding theoretical equation of the electronic circuit is given as:
dx1
dt ¼
1
R1C1y1; ð15Þ
dy1
dt ¼
1
100R2C1 10V1 x
2 1
y1 1
R1C1x1; ð16Þ
dx2
dt ¼
1 R1C2y2 1 10R couplingC2 x2
1; ð17Þ
dy2
dt ¼
1
100R2C2 10V2 x
2 2
y2 1
R1C2x2þ
1
R1C2b; ð18Þ
wherexiandyiare the corresponding theoretical electric potentials of thei-th oscillator. The trajectories of the van der Pol oscillator are shown by thexiandyisignals inFig 1B–1E. Note that onlyxiwas used to estimate the coupling function. The experimental parameters (Rkand
uneven quality of the electronic components. By introducing parameterb(b= 0.4), the simu-lated trajectory can be adjusted to the experimental data (Fig 1B–1E).
The corresponding theoretical coupling functions were calculated based on Eqs (15–18) using the adjoint method [46]. In this method, the zero phase is defined as the peak point ofxi
(green crosses inFig 1B–1Erepresent the zero-phase reference points on the theoretical orbits). From the experimental data, the zero-phase reference points were determined based on electric potentialsxiusing Hilbert transformation (blue dots denote the point of zero-phase reference on the experimental data). As shown inFig 1B–1E, a small gap exists between the zero-phase reference points of the theoretical and experimental orbits. In principle, an arbi-trary point on the limit-cycle orbit can be defined as the zero-phase point. However, to com-pare theoretical and estimated results, the zero-phase reference point of the theoretical model
Fig 1. Electronic circuit of a pair of van der Pol oscillators and recorded electric potential.(a) Schematic of electronic circuit of two coupled van der Pol
oscillators, wherexiandyiare positions for recording electric potential,Rkdenotes resistors, andCidenotes condensers. Electronic units U1and U2
represent the multiplier and operational amplifiers, respectively.Rcouplingis a resistor whose resistance is the parameter of the strength of connectivity. (b)
Experimental data of electric potentialsx1andy1show the limit-cycle oscillator under the same-frequency (129.1 Hz) coupling condition (gray dots and
line). The black trajectory shows the theoretical value computed by the van der Pol oscillator Eqs (15–18). Here, the frequency is 142.1 Hz. Blue dots
represent the zero-phase reference points on the experimental data, which were determined automatically via Hilbert transformation. Green crosses
represent the theoretical zero-phase reference points defined as the peak points ofxi. Red dots denote the adjusted zero-phase reference points. (c)x2andy2
show the oscillators under the same-frequency oscillator condition. The frequency of the experimental data is 132.5 Hz and that of the theoretical trajectory is 146.4 Hz. (d) Recorded electric potentials show the slow limit-cycle oscillator under cross-frequency coupling conditions (experimental frequency, 64.1
Hz; theoretical frequency, 71.1 Hz). (e)x2andy2denote the fast oscillator (experimental frequency, 131.1 Hz; theoretical frequency, 146.4 Hz).
should be consistent with that of the experimental data. Therefore, the zero-phase reference points of the experimental orbits were adjusted to coincide with those of the theoretical model by shifting the experimental reference points to the theoretical points as1¼1þ
p
6; 2¼
2þ
p
10(red dots denote the revised zero-phase reference points), whereϕ1is the experimental
phase based on the electric potentialx1(Fig 1B and 1D) andϕ2is the experimental phase
based on the electric potentialx2(Fig 1C and 1E). We estimated the coupling function from
the shifted phase data and compared the theoretical coupling function with the estimated function.
Scalp EEG experiment
We applied the proposed method to scalp EEG data. The method can estimate the coupling functions for same-frequency and cross-frequency synchronization assuming that EEG activi-ties can be considered weakly coupled oscillators. However, it is unclear whether EEG activity can be considered a weakly coupled oscillator system. Thus, we must confirm that the pro-posed method can estimate the dynamical system from the EEG data successfully.
We used EEG data recorded during a speech recognition task. Note that detailed informa-tion is provided in our previous paper [37]. The participants categorized what they heard as a target or distractor as soon and as accurately as possible. Four-letter Japanese words were used as speech sounds, and the words were uttered within approximately 1 s. The sampling rate of the speech sound was 48,000 Hz. The speech envelopes on each frequency were high-pass fil-tered with a cutoff frequency of 3 Hz to avoid phase-resetting. Furthermore, the speech sounds were masked with pink noise. The noise volume was increased linearly over 0.5 s after onset to avoid the phase-resetting effect by noise onset. The speech sound always started 2 s after the onset of noise and lasted approximately 1 s. The noise sound was terminated 1.5 s after speech onset. The EEG experiment consisted of four sessions for each participant. Each session con-sisted of 100 trials.
A 32-channel EEG amplifier (Brain Amp MR, Brain Products, Germany) with an interna-tional 10% standard electrode cap with a sintered Ag/AgCl ring electrode (Easy Cap, Falk Minow Services, Germany) was used for the EEG recording (sample rate, 5 kHz). Four elec-trodes were used for the vertical and horizontal electrooculogram (VEOG and HEOG) chan-nels. The VEOG and HEOG were used to remove ocular artifacts. The measurement reference was linked earlobes, and the ground was on the inion. The EEG signal was filtered using a 1-Hz high-pass software filter, a 250-Hz low-pass hardware filter, and a 60-Hz notch filter. In a preprocessing step, ocular artifacts were corrected using EEG analysis software (Brain Vision Analyzer, Brain Products, Germany) and the VEOG/HEOG signals [47]. The reference was changed to the average of all electrodes, except VEOG and HEOG. The preprocessed EEG data were then downsampled to 500 Hz.
The participants were 16 healthy adults (five females; 11 males; 21–32 years; mean age, 25 years). One participant was excluded due to a low response rate, and another participant was excluded due to an excessive artifact that could not be removed during preprocessing. Note that these participants were also excluded in our previous study [37].
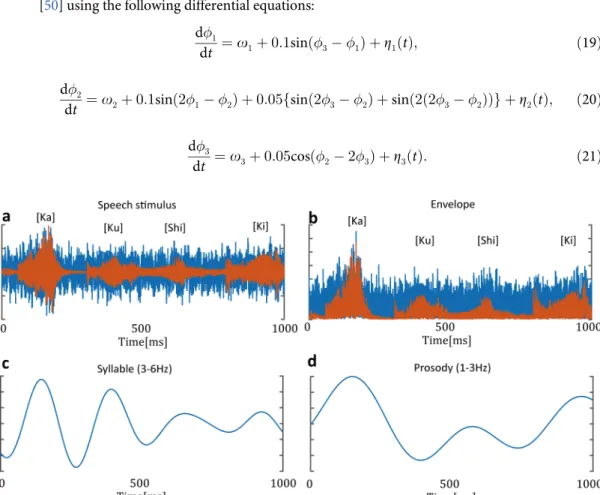
patterns of an utterance. The envelope of prosodic rhythms appears in the 1–3 Hz frequency range. We estimated the coupling function between the EEG oscillation and these speech rhythms. To obtain the theta oscillations, the preprocessed EEG signals were bandpass filtered within 3–6 Hz. The syllabic and prosodic rhythms were computed from the sound stimulus consisting of the noise and speech sounds (Fig 2A). The sound envelope was computed as the absolute value of the Hilbert-transformed sound data (Fig 2B). To compute the syllabic and prosodic rhythms, the envelope signal was bandpass filtered within 3–6 Hz and 1–3 Hz, respectively (Fig 2C and 2D). The syllabic and prosodic signals were downsampled to 500 Hz. The instantaneous phases of these rhythms were computed using both Hilbert transformation and correction (Eq 8). We estimated the coupling functions of 1:1 phase locking (syllable and theta oscillation) and 1:2 phase locking (prosody and theta oscillation).
Results
Numerical simulation of phase oscillator model
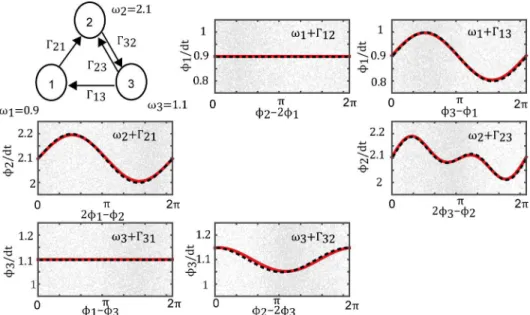
First, we applied our Bayesian method to numerical simulation data which was generated from three cross-frequency oscillators with somewhat complicated connections, to evaluate the validity of the proposed method. Simulation data were generated from a network compris-ing one fast oscillator and two slow oscillators (Fig 3) based on the Euler–Maruyama method [50] using the following differential equations:
d1
dt ¼o1þ0:1sinð3 1Þ þZ1ð Þt ; ð19Þ
d2
dt ¼o2þ0:1sinð21 2Þ þ0:05fsinð23 2Þ þsinð2ð23 2ÞÞg þZ2ð Þt ; ð20Þ
d3
dt ¼o3þ0:05cosð2 23Þ þZ3ð Þt : ð21Þ
Fig 2. Syllable and prosody rhythms in speech sound.(a) Example of speech stimulus. The stimulus consisted of noise and a four-syllable Japanese word. The red line represents a speech wave. The blue line represents the presented sound wave, which consists of speech plus noise sounds. (b) Speech envelope was computed as the absolute value of Hilbert-transformed speech sound. (c) Syllabic rhythms were computed from the speech envelope through the bandpass filter within 3–6 Hz. (d) Prosodic rhythms were computed from the speech envelope through the bandpass filter within 1–3 Hz.
We set the natural frequencies toω1= 0.9,ω2= 2.1, andω3= 1.1. Here,ϕ2is the phase of
the fast oscillator, andϕ1andϕ3are the phases of the slow oscillators.ηis independent
Gauss-ian white noise with zero mean and a standard deviation of 0.1. Using the proposed method, we estimated the coupling functions and the natural frequencies from the phase time-series data generated in the experiment.
Fig 3shows the estimated coupling functions and the correct coupling functions. In this case, the correct coupling functions were defined explicitly by Eqs (19)–(21). Despite the com-plicated connections, the results indicate that the estimated and correct coupling functions agree fairly well. Furthermore, the complexity parameter of the coupling function was selected correctly by optimizing the logarithmic evidence. Therefore, the proposed method works quite well at estimating a nontrivial network of phase oscillators comprising oscillators with differ-ent natural frequencies.
Electronic circuit experiment
Before applying the proposed method to EEG data, we recorded the electric potential of the van der Pol electronic circuit and tested the ability of the estimation method using the experi-mental data. Since the electronic circuit can be explained by the corresponding theoretical dif-ferential equations (Eqs15–18), we can derive the correct coupling function theoretically using the adjoint method. We conducted two experiments. One involved coupling oscillators of the same frequency (Fig 4A), and the other involved coupling slow and fast oscillators (Fig 4E). We transformed thex1andx2electric potentials of the first and second oscillators,
respec-tively, to phase time-series data and estimated the coupling functions from these data. The estimated coupling functions with no interaction from the second to first oscillator were identically zero in the experiments involving oscillators of the same frequency (Fig 4B) and cross frequency (Fig 4F). When coupling existed, the estimated coupling function was the same as the theoretical function under the same-frequency (Fig 4C) and cross-frequency con-ditions (Fig 4G). Furthermore, to confirm whether the estimated phase oscillator model can
Fig 3. Estimated coupling function for numerical simulation data.Upper-left diagram shows the network structure. The estimated coupling functions (red lines) were nearly identical to the correct functions (dashed black line). The gray dots represent the phase time-series data. When the interaction did not exist, the estimated coupling function was identically zero. The proposed method estimated all coupling functions correctly for the simulation data.
explain the experimental data, we compared the phase difference histograms for the experi-mental phase data and the two types of simulated phase data. The experiexperi-mental phase data were computed from electric potentials by both Hilbert transformation and Eq (8). One set of simulated phase data was computed in the phase oscillator model based on the estimated parameters using the Euler–Maruyama method. The other was computed based on the theo-retical coupling functions and natural frequency, which were determined by Eqs (15)–(18). We computed the experimental, estimated, and theoretical histograms from these phase time-series data. The experimental and estimated histograms of the phase difference were nearly the same under each condition (Fig 4D and 4H). However, the theoretical histograms differed. The difference among these histograms was caused by the difference of the natural frequency between the theoretical and experimental oscillators (Fig 1B–1E) due to uncontrollable experi-mental conditions. In other words, the electronic circuit experiexperi-mental data did not follow the theoretical equations exactly; however, the coupling functions between the experimental van der Pol oscillators were the same as the theoretical coupling functions. In fact, when the theo-retical histograms were computed based on the theotheo-retical coupling functions and the esti-mated natural frequencies rather than the theoretical natural frequencies, the experimental and estimated histograms coincided relatively well with the theoretical histograms. These results indicate that the proposed method works well with real data, even if the data contain observational errors or additional unknown disturbances.
Human EEG experiment
Finally, we applied the proposed method to the EEG data. We estimated the coupling func-tions between the theta oscillation and the envelope of speech stimulus. The theta oscillation
Fig 4. Estimated coupling function of electronic circuit.(a) The diagram shows the coupling direction between oscillators of the same frequency. The first oscillator was coupled to the second oscillator. (b) The red line shows the estimated phase coupling function with the natural frequency in the same-frequency
coupling case. The dashed black line shows the theoretical coupling function. The coupling function from the second to first oscillatorΓ12is identically zero.
When there is no interaction, the coupling function is nearly zero. The gray dots show the experimental data points. (c) The coupling functions from the first
to second oscillatorΓ21. (d) The blue line shows the phase difference histogram of the experimental data in the case of 1:1 phase locking (experimental
histogram). The red line shows the simulated histogram calculated in the phase oscillator model estimated from the experimental data (estimated histogram). The dashed black line shows the simulated histogram calculated in the phase oscillator model using the theoretical natural frequencies and coupling functions (theoretical histogram). (e) In the cross-frequency coupling case, the slow oscillator was coupled to the fast oscillator. (f) The coupling function from the fast to slow oscillator is identically zero. (g) The coupling function from the slow to fast oscillator. (h) The experimental, estimated, and theoretical histogram in the 1:2 phase-locking case.
was observed to be synchronized with the speech envelope [35] and is considered to play an important role in speech perception. Generally, the speech envelope consists of syllabic (3–6 Hz) and prosodic (1–3 Hz) rhythms. Thus, we estimated the phase oscillator model under the same-frequency and cross-frequency conditions, i.e., theta oscillation and syllabic rhythm (Fig 5), and theta oscillation and prosodic rhythm (Fig 6). In these experiments, the phase-differ-ence histograms between the EEG and the speech sound showed 1:1 and 1:2 phase locking (Figs5Aand6A). Note that there is obviously no interaction from EEG activity to speech sound. Therefore, we can use this fact to confirm the validity of the estimation results.
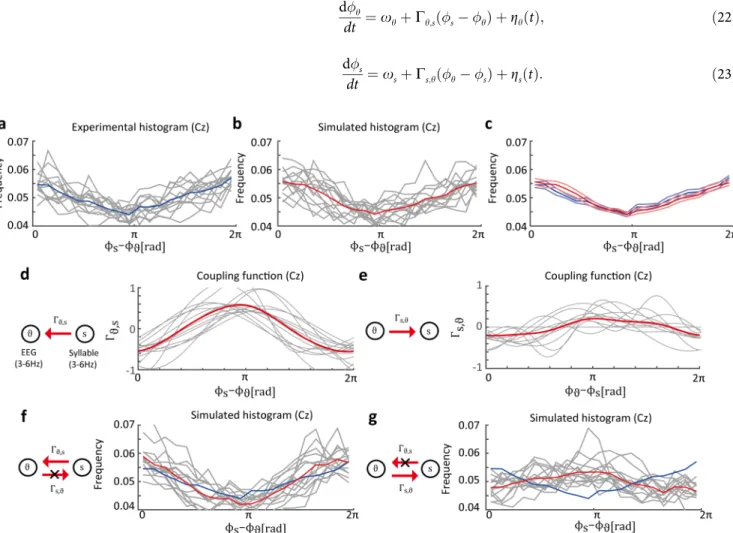
In the theta oscillation and syllable data, we assumed that the syllabic rhythm modulated the theta oscillation. The instantaneous phase of the theta oscillation is denotedϕθ, and the phase of the syllable is denotedϕs. The phase difference between the theta oscillation and the syllable is defined asϕs−ϕθ. The phase-difference histogram of each participant showed 1:1 phase locking (Fig 5A). We estimated the phase oscillator models of 1:1 phase locking as fol-lows:
dy
dt ¼oyþGy;sðs yÞ þZyð Þt ; ð22Þ
ds
dt ¼osþGs;yðy sÞ þZsð Þt : ð23Þ
Fig 5. Estimated distribution of phase difference between EEG data and syllable envelope.(a) Experimental histogram of phase difference between the theta oscillation on the Cz electrode and the syllabic rhythm (the histograms show phase locking). The gray lines represent histograms of individual participants and the blue line represents the histogram averaged over all participants. (b) Histograms obtained from the simulated data in the estimated phase oscillator model. The averaged histogram is similar to the experimental histogram. The gray lines represent the phase difference histograms of individual participants. The red line represents the average of the simulated histograms. (c) Blue lines represent the averaged experimental histogram and the
standard error of mean (SEM). Red lines represent the averaged simulated histograms and the SEM. (d) Estimated coupling functionsΓθ,sfrom syllabic
rhythm to theta oscillation. The gray and red lines represent the results of individual participants and the average results of all participants, respectively. (e)
Estimated coupling functionsΓs,θare considerably smaller than the opposite directional coupling functions. (f) Simulated histograms where the coupling
To confirm that the estimated dynamical system can explain the experimental data, we simu-lated phase synchronization based on the estimated phase oscillator model.Fig 5Bshows the phase difference histograms obtained from the simulated data. Note that, for the simulated data, phase differences were calculated by numerical simulation performed using the estimated phase oscillator model (Eqs (22and23)). The histograms of the simulation data were similar to those of the experimental data (Fig 5C), which indicates that the estimated phase oscillator model can explain the experimental data. Furthermore, the estimated coupling functionsΓθ,s
were consistent among all participants (Fig 5D). In contrast, the estimated coupling functions Γs,θhad smaller amplitudes thanΓθ,s(Fig 5E) and were not consistent among all participants.
These results are reasonable in terms of the relationship between EEG and speech sound because direct interaction from theta oscillation to speech sound never exists. To examine the effects of each coupling function on the dynamics, we computed the simulated histogram under the condition that eitherΓs,θorΓθ,swas set to identically zero. In the case ofΓs,θ= 0 (Fig
5F), the resultant histogram shows that, compared to the original dynamics inFig 5B, the syn-chronized state is almost maintained. This implies that the coupling functionΓs,θdoes not
con-tribute to the realization of 1:1 phase locking. In the case ofΓθ,s= 0, the synchronized state
disappeared, as shown in the flatter histograms (Fig 5G). Consequently, the results indicate that the coupling functionΓθ,sprimarily contributed to 1:1 phase locking.
In the theta oscillation and prosody data, we assumed that the prosodic rhythms modulated the theta oscillation. Here, letϕpdenote the prosody phase. Considering the 1:2 phase-locking state, the phase difference between theta oscillation and prosody is reasonably defined as 2ϕp−
ϕθ. The phase difference histograms of each participant showed 1:2 phase locking (Fig 6A). Next, we considered the phase oscillator model for 1:2 phase locking as follows:
dy
dt ¼oyþGy;p 2p y
þZyð Þt ; ð24Þ
dp
dt ¼opþGp;y y 2p
þZpð Þt : ð25Þ
We confirmed that the estimation result can explain the experimental data by calculating the simulated phase difference histograms under the 1:2 phase-locking condition (Fig 6B). The simulated histograms were similar to the experimental histograms (Fig 6C). The results indi-cate that the estimation phase interaction functions can explain the experimental data, as well as the 1:1 phase-locking condition. The estimated coupling functions of all participants were consistent (Fig 6D and 6E). Furthermore, the estimated coupling functionsΓp,θshowed small
amplitude or were identically zero (Fig 6E). These results clearly show that there were no cou-pling function from EEG to speech sound, which is reasonable given the relationship between EEG and speech sounds in the experiments. In the case ofΓp,θ= 0, the simulated phase
differ-ence histograms also showed phase locking (Fig 6F), as well asFig 6B. In contrast, phase lock-ing disappeared forΓθ,p= 0 (Fig 6G). These results indicate that the coupling functionΓθ,p
contributed to 1:2 phase locking.
In both cases, our method could estimate whether there was a relationship between the EEG activity and speech sound even though there was some variance due to estimation inaccu-racies. In the case of the theta oscillation and prosody data, the estimated coupling functions Γp,θshowed small amplitudes or were identically zero, clearly demonstrating the asymmetry of
the relationship between the EEG activity and speech sound. In contrast, for the theta oscilla-tion and syllable data, the estimated coupling funcoscilla-tionsΓs,θshowed somewhat larger
ampli-tudes thanΓp,θ, giving no clear indication of an asymmetric relationship. Therefore, in order
using surrogate data (S1 Fig). The surrogate data consisted of randomly time-shifted speech-sound phase data and original EEG data that had not been time-shifted. Note that there was no temporal relationship between the time-series, speech-sound phase data and the original EEG signals. This random shifting process was repeated 100 times for each of the 14 partici-pants. Then, we estimated the coupling functions using these 1,400 surrogate datasets and computed histograms of the model selection results for the appropriate Fourier modes based on the logarithmic evidence and the coupling function powersR2p
0 jGðcÞj
2
dc. For the coupling functionsΓθ,sandΓθ,p, the model selection histograms showed that the M = 0 model was
selected more often than the other models (S1A and S1E Fig), while the original data results showed that none of the participants selected the M = 0 model. Furthermore, the integrated values of coupling function power showed that the original data results did not follow the same histograms as the surrogate data results (S1B and S1F Fig). For the coupling functionsΓs,
θandΓp,θ, the model selection results for the original data were not largely different from those
that for the surrogate data (S1C and S1G Fig), and the integrated coupling function values were relatively small (S1D and S1H Fig). Consequently, these results suggest that the coupling functions,Γs,θandΓp,θ, showed no relationship between the EEGs and speech sounds.
Discussion
We have proposed an estimation method to identify the phase dynamics of cross-frequency synchronization using rhythmic time-series data. By identifying the dynamics, we can reveal
Fig 6. Estimated distribution of phase difference between EEG data and prosody envelope.(a) Experimental phase difference histograms for 1:2 phase locking. (b) Simulated histograms based on the estimated phase oscillator model. (c) Blue lines represent the average and SEM of experimental phase
difference histograms. Red lines represent the average and SEM of simulated histograms. (d) Estimated coupling functionsΓθ,p. (e) Estimated coupling
functionsΓp,θ. (f) Simulated histograms where coupling functionsΓp,θare removed. (g) Simulated histograms whereΓθ,pis removed are uniform.
the direction of coupling and the role of each coupling function in synchronization. To con-firm the reliability of the proposed method, we estimated a dynamical system from time-series data obtained by numerical simulation and experimentation using an electronic circuit, and we showed that these results were estimated successfully. In addition, we applied the proposed method to scalp EEG data and evaluated its validity based on the estimation results.
Validity of estimation method for cross-frequency synchronization
We can obtain the theoretical coupling function from the numerical simulation and data from the electronic circuit experiment. To confirm the reliability of the proposed method, we com-pared the estimated results to theoretical results. In the simulation, time-series data were gen-erated by numerial simulation used in the given phase oscillator model. In this case, we knew the true instantaneous phase of the time-series data and the correct coupling functions. The proposed method worked well with the simulation data (Fig 3), and the complexity parameter for the coupling function Mijwas selected correctly.
We also estimated a dynamical system using electric potential data, i.e., real time-series data. In this situation, the corresponding theoretical coupling function was computed using the adjoint method from which we constructed a theoretical model of real electronic circuits. The results demonstrated that the proposed method can correctly estimate the coupling func-tions (Fig 4). Furthermore, to confirm that the estimated phase oscillator model can reproduce real time-series data, we compared the phase difference histogram of real time-series data with those of the simulated data. The results demonstrate that the estimated coupling functions and the noise strengths can explain the real data, including any additional disturbance imposed on the system.
In the EEG data, the correct coupling function to be compared to the estimated function is unknown. Therefore, we must consider an alternative procedure to examine the validity of the estimation results. To this end, we considered the following three steps. In the first step, we focused on the coupling functions from the EEG activity to the speech stimulus (Figs5Eand
6E). Under this EEG experimental condition, EEG activity did not influence speech sound because the timing of the external speech sound was given by a recorded sound. Our estimated dynamics showed that the coupling function from EEG to speech sound had smaller amplitude than the coupling function in the opposite direction (Figs5Dand6D) and did not influence the phase difference histograms (Figs5Fand6F). Therefore, the estimated network structure is consistent with the real EEG and speech system under this experimental condition. In the second step, we confirmed whether the simulated phase difference histograms were similar to the experimental histograms. Our estimation results and the experimental data both showed phase locking (Figs5A,5B,6A and 6B). In addition to results of the first step, these results sug-gest that the phase oscillator model can explain the EEG and speech sound data. In the final step, we confirmed that the estimated coupling functions were consistent across all partici-pants to check whether the above results occurred by chance. Our results indicated that the coupling functions and phase difference histograms were similar across all participants on the Cz electrode (Figs5and6). Furthermore, the estimation results for neighbor electrodes (e.g., FCz, Pz, CP, and CP2) showed results similar to those obtained on the Cz electrode. Based on the results obtained by performing these three steps, the mechanism between EEG and speech sound can be explained by the dynamical phase oscillator system.
Remarks on estimation method
phases are often locked by external input among trials [51,52]. In addition, it is possible that phase locking is generated by phase-resetting through strong external inputs. If phase-resetting depends on the timing of external inputs rather than the phase difference, the interaction between the EEG phase and the stimulus cannot be explained by the phase oscillator model. Therefore, it is necessary to avoid phase resetting caused by sudden and strong external inputs. Event related phase locking is often induced at stimulus onset. Therefore, to prevent such phase-resetting, we presented noise (increased linearly over 0.5 s) prior to presenting speech sound. Furthermore, to avoid a situation where a strong external input induces phase-resetting at speech onset, we employed a bandpass filter to decrease the strong periodic speech sound signals.
Note that the proposed method cannot estimate the coupling function if the EEG phase is completely synchronized. Under such synchronization conditions, each phase difference between the two oscillators takes only a specific value. Therefore, except for this specific value, there is no information about the coupling function on the other phase difference value. To obtain the full range of the coupling function, the phase differences in the data must be distrib-uted in the range 0 to 2π, as shown inFig 3.
This study focused primarily on 1:pphase synchronization; however, other types of cross-frequency synchronization exist [8,10], e.g., phase-amplitude, amplitude-amplitude, and phase-frequency synchronization. These synchronizations are also important from a cognitive function perspective; however, the proposed method cannot be applied to such dynamical sys-tems. In future, we plan to construct a method that is applicable to the experimental data of these synchronizations.
Methods to quantify the causality between different frequency rhythms [53–56] have been proposed. Such methods, including transfer entropy and Granger causality, may reveal more general causality than the proposed method, which can only estimate the coupling function related to thepi:pjphase synchronization. However, the proposed method can reveal causality and quantify the phase interaction function; thus, it can examine the role of connection in phase synchronization from a dynamical system perspective.
The proposed method can estimate the coupling functions of simulation data and experi-mental electronic circuit data accurately. In the EEG experiment, we estimated the dynamical system of EEG and speech sound. Note that we examined the dynamics of phase synchroniza-tion between a single EEG activity and speech sound rather than between two EEG activities. We applied the proposed method to synchronization between EEG and speech because the direction of causality between EEG and speech sound is clear, whereas that of EEG phases is unknown. Therefore, EEG and speech data were used to verify the estimation results. It is expected that the proposed method can serve as a useful tool to reveal the role of connectivity and causality in neural oscillations.
Supporting information
S1 File. Estimated resultant data of theta oscillation and syllabic rhythm.
(ZIP)
S2 File. Estimated resultant data of theta oscillation and prosodic rhythm.
(ZIP)
S3 File. Hyperparameters of prior distribution and updating rule.
(PDF)
the EEGs and speech sounds for comparing the estimated results with the original data. The surrogate data consisted of the original EEG phases and time-shifted speech sound phases. The speech sound phases were randomly time-shifted for each trial so that there would be no tem-poral relationship between the EEG and speech sound phases. This random shifting process was repeated 100 times for each of the 14 participants. We then estimated the coupling func-tions using these 1,400 surrogate datasets and computed histograms of the model selecfunc-tions for the appropriate Fourier modes based on the logarithmic evidence and the coupling func-tion powersR2p
0 jGðcÞj
2
dc. If the coupling function did indeed exist, these coupling function properties would be different between the original and surrogate data. All the surrogate data histograms showed that the M = 0 andR2p
0 jGðcÞj
2
dc= 0 cases were the high frequent. The original coupling functions from speech sound to EEG activity,Γθ,sandΓθ,p, could not explain
the surrogate data histograms. In contrast, the coupling functions from EEG activity to speech sound,Γs,θandΓp,θ, were similar to the surrogate data results.
(a) Histograms of the M values which were selected based on logarithmic evidence for the coupling functionsΓθ,s. The blue line represents the model selection histogram for the 1,400
surrogate datasets, while the red line represents the model selection histogram for the 14 par-ticipants’ original data. (b) Histogram of all coupling function powers for the surrogate data (including M = 0,1,2,3). The red stars represent the coupling function powers for the original data. (c) Model selection histograms for the coupling functionsΓs,θ. (d) Histogram of powers
of the coupling functionsΓs,θ. (e) Model selection histograms for the coupling functionsΓθ,p.
(f) Histogram of powers of the coupling functionsΓθ,p. (g) Model selection histograms for the
coupling functionsΓp,θ. (h) Histogram of powers of the coupling functionsΓp,θ.
(TIF)
Acknowledgments
We would like to thank Kaiichiro Ota for fruitful discussions.
Author Contributions
Conceptualization:Hiroaki Mizuhara, Toshio Aoyagi.
Data curation:Takayuki Onojima, Takahiro Goto, Hiroaki Mizuhara.
Formal analysis:Takayuki Onojima, Takahiro Goto.
Funding acquisition:Takayuki Onojima, Hiroaki Mizuhara, Toshio Aoyagi.
Investigation:Takayuki Onojima, Takahiro Goto, Hiroaki Mizuhara, Toshio Aoyagi.
Methodology:Takayuki Onojima, Takahiro Goto, Toshio Aoyagi.
Project administration:Toshio Aoyagi.
Resources:Takayuki Onojima, Hiroaki Mizuhara.
Software:Takayuki Onojima, Takahiro Goto.
Supervision:Hiroaki Mizuhara, Toshio Aoyagi.
Visualization:Takayuki Onojima.
Writing – original draft:Takayuki Onojima, Hiroaki Mizuhara, Toshio Aoyagi.
References
1. Roelfsema PR, Engel AK, Konig P, Singer W. Visuomotor integration is associated with zero time-lag synchronization among cortical areas. Nature. 1997; 385(6612):157–61.https://doi.org/10.1038/ 385157a0PMID:8990118.
2. Rodriguez E, George N, Lachaux JP, Martinerie J, Renault B, Varela FJ. Perception’s shadow: long-dis-tance synchronization of human brain activity. Nature. 1999; 397(6718):430–3.https://doi.org/10.1038/ 17120PMID:9989408.
3. von Stein A. Synchronization Between Temporal and Parietal Cortex During Multimodal Object Pro-cessing in Man. Cerebral Cortex. 1999; 9(2):137–50.https://doi.org/10.1093/cercor/9.2.137PubMed PMID: WOS:000079495300004. PMID:10220226
4. Srinivasan R, Russell DP, Edelman GM, Tononi G. Increased synchronization of neuromagnetic responses during conscious perception. J Neurosci. 1999; 19(13):5435–48. PMID:10377353. 5. Varela F, Lachaux JP, Rodriguez E, Martinerie J. The brainweb: phase synchronization and large-scale
integration. Nat Rev Neurosci. 2001; 2(4):229–39.https://doi.org/10.1038/35067550PMID:11283746. 6. Fries P. A mechanism for cognitive dynamics: neuronal communication through neuronal coherence.
Trends Cogn Sci. 2005; 9(10):474–80.https://doi.org/10.1016/j.tics.2005.08.011PMID:16150631. 7. Womelsdorf T, Schoffelen JM, Oostenveld R, Singer W, Desimone R, Engel AK, et al. Modulation of
neuronal interactions through neuronal synchronization. Science. 2007; 316(5831):1609–12.https:// doi.org/10.1126/science.1139597PMID:17569862.
8. Canolty RT, Knight RT. The functional role of cross-frequency coupling. Trends Cogn Sci. 2010; 14 (11):506–15.https://doi.org/10.1016/j.tics.2010.09.001PMID:20932795; PubMed Central PMCID: PMCPMC3359652.
9. Canolty RT, Edwards E, Dalal SS, Soltani M, Nagarajan SS, Kirsch HE, et al. High gamma power is phase-locked to theta oscillations in human neocortex. Science. 2006; 313(5793):1626–8.https://doi. org/10.1126/science.1128115PMID:16973878; PubMed Central PMCID: PMCPMC2628289. 10. Jensen O, Colgin LL. Cross-frequency coupling between neuronal oscillations. Trends Cogn Sci. 2007;
11(7):267–9.https://doi.org/10.1016/j.tics.2007.05.003PMID:17548233.
11. Lisman JE, Jensen O. The theta-gamma neural code. Neuron. 2013; 77(6):1002–16.https://doi.org/10. 1016/j.neuron.2013.03.007PMID:23522038; PubMed Central PMCID: PMCPMC3648857.
12. Nikulin VV, Brismar T. Phase synchronization between alpha and beta oscillations in the human electro-encephalogram. Neuroscience. 2006; 137(2):647–57.https://doi.org/10.1016/j.neuroscience.2005.10. 031PMID:16338092.
13. Nikulin VV, Nolte G, Curio G. A novel method for reliable and fast extraction of neuronal EEG/MEG oscillations on the basis of spatio-spectral decomposition. Neuroimage. 2011; 55(4):1528–35.https:// doi.org/10.1016/j.neuroimage.2011.01.057PMID:21276858.
14. Palva JM, Palva S, Kaila K. Phase synchrony among neuronal oscillations in the human cortex. J Neu-rosci. 2005; 25(15):3962–72.https://doi.org/10.1523/JNEUROSCI.4250-04.2005PMID:15829648. 15. Palva JM, Monto S, Kulashekhar S, Palva S. Neuronal synchrony reveals working memory networks
and predicts individual memory capacity. Proc Natl Acad Sci U S A. 2010; 107(16):7580–5.https://doi. org/10.1073/pnas.0913113107PMID:20368447; PubMed Central PMCID: PMCPMC2867688. 16. Sauseng P, Klimesch W, Gruber WR, Birbaumer N. Cross-frequency phase synchronization: a brain
mechanism of memory matching and attention. Neuroimage. 2008; 40(1):308–17.https://doi.org/10. 1016/j.neuroimage.2007.11.032PMID:18178105.
17. Schack B, Klimesch W, Sauseng P. Phase synchronization between theta and upper alpha oscillations in a working memory task. Int J Psychophysiol. 2005; 57(2):105–14.https://doi.org/10.1016/j.ijpsycho. 2005.03.016PMID:15949859.
18. Siebenhuhner F, Wang SH, Palva JM, Palva S. Cross-frequency synchronization connects networks of fast and slow oscillations during visual working memory maintenance. Elife. 2016; 5.https://doi.org/10. 7554/eLife.13451PMID:27669146; PubMed Central PMCID: PMCPMC5070951.
19. Lachaux JP, Rodriguez E, Martinerie J, Varela FJ. Measuring phase synchrony in brain signals. Hum Brain Mapp. 1999; 8(4):194–208. PMID:10619414.
20. Tass P, Rosenblum MG, Weule J, Kurths J, Pikovsky A, Volkmann J, et al. Detection of n: m phase lock-ing from noisy data: Application to magnetoencephalography. Phys Rev Lett. 1998; 81(15):3291–4.
https://doi.org/10.1103/PhysRevLett.81.3291PubMed PMID: WOS:000076369400061. 21. Tass PA. Transmission of stimulus-locked responses in two oscillators with bistable coupling. Biol
22. Tass PA. Stimulus-locked transient phase dynamics, synchronization and desynchronization of two oscillators. Europhys Lett. 2002; 59(2):199–205.https://doi.org/10.1209/epl/i2002-00226-8PubMed PMID: WOS:000176877200007.
23. Lobier M, Siebenhuhner F, Palva S, Palva JM. Phase transfer entropy: a novel phase-based measure for directed connectivity in networks coupled by oscillatory interactions. Neuroimage. 2014; 85 Pt 2:853–72.https://doi.org/10.1016/j.neuroimage.2013.08.056PMID:24007803.
24. Park H, Ince RA, Schyns PG, Thut G, Gross J. Frontal top-down signals increase coupling of auditory low-frequency oscillations to continuous speech in human listeners. Curr Biol. 2015; 25(12):1649–53.
https://doi.org/10.1016/j.cub.2015.04.049PMID:26028433; PubMed Central PMCID: PMCPMC4503802.
25. Jansen BH, Rit VG. Electroencephalogram and visual evoked potential generation in a mathematical model of coupled cortical columns. Biol Cybern. 1995; 73(4):357–66. PMID:7578475.
26. David O, Friston KJ. A neural mass model for MEG/EEG: coupling and neuronal dynamics. Neuro-image. 2003; 20(3):1743–55.https://doi.org/10.1016/S1053-8119(03)00457-9PMID:14642484. 27. Kuramoto Y. Chemical oscillations, waves, and turbulence: Springer Science & Business Media; 2012.
28. Ota K, Aoyagi T. Direct extraction of phase dynamics from fluctuating rhythmic data based on a Bayes-ian approach. ArXiv e-prints [Internet]. 2014 May 1, 2014; 1405. Available from:http://adsabs.harvard. edu/abs/2014arXiv1405.4126O.
29. Penny WD, Litvak V, Fuentemilla L, Duzel E, Friston K. Dynamic Causal Models for phase coupling. J Neurosci Methods. 2009; 183(1):19–30.https://doi.org/10.1016/j.jneumeth.2009.06.029PMID:
19576931; PubMed Central PMCID: PMCPMC2751835.
30. Kralemann B, Cimponeriu L, Rosenblum M, Pikovsky A, Mrowka R. Uncovering interaction of coupled oscillators from data. Phys Rev E. 2007; 76(5 Pt 2):055201.https://doi.org/10.1103/PhysRevE.76. 055201PMID:18233706.
31. Kralemann B, Cimponeriu L, Rosenblum M, Pikovsky A, Mrowka R. Phase dynamics of coupled oscilla-tors reconstructed from data. Phys Rev E. 2008; 77(6 Pt 2):066205.https://doi.org/10.1103/PhysRevE. 77.066205PMID:18643348.
32. Kralemann B, Pikovsky A, Rosenblum M. Reconstructing phase dynamics of oscillator networks. Chaos. 2011; 21(2):025104.https://doi.org/10.1063/1.3597647PMID:21721782.
33. Tokuda IT, Jain S, Kiss IZ, Hudson JL. Inferring phase equations from multivariate time series. Phys Rev Lett. 2007; 99(6):064101.https://doi.org/10.1103/PhysRevLett.99.064101PMID:17930830. 34. Rosenblum MG, Pikovsky AS. Detecting direction of coupling in interacting oscillators. Phys Rev E Stat
Nonlin Soft Matter Phys. 2001; 64(4 Pt 2):045202.https://doi.org/10.1103/PhysRevE.64.045202PMID:
11690077.
35. Schroeder CE, Lakatos P, Kajikawa Y, Partan S, Puce A. Neuronal oscillations and visual amplification of speech. Trends Cogn Sci. 2008; 12(3):106–13.https://doi.org/10.1016/j.tics.2008.01.002PMID:
18280772; PubMed Central PMCID: PMCPMC3987824.
36. Giraud AL, Kleinschmidt A, Poeppel D, Lund TE, Frackowiak RS, Laufs H. Endogenous cortical rhythms determine cerebral specialization for speech perception and production. Neuron. 2007; 56 (6):1127–34.https://doi.org/10.1016/j.neuron.2007.09.038PMID:18093532.
37. Onojima T, Kitajo K, Mizuhara H. Ongoing slow oscillatory phase modulates speech intelligibility in cooperation with motor cortical activity. PLoS ONE. 2017; 12(8).
38. Buzsaki G, Wang XJ. Mechanisms of gamma oscillations. Annu Rev Neurosci. 2012; 35:203–25.
https://doi.org/10.1146/annurev-neuro-062111-150444PMID:22443509; PubMed Central PMCID: PMCPMC4049541.
39. Hoppensteadt FC, Izhikevich EM. Oscillatory neurocomputers with dynamic connectivity. Phys Rev Lett. 1999; 82(14):2983–6.https://doi.org/10.1103/PhysRevLett.82.2983PubMed PMID:
WOS:000079490800044.
40. Terada Y, Aoyagi T. Dynamics of two populations of phase oscillators with different frequency distribu-tions. Phys Rev E. 2016; 94(1–1):012213.https://doi.org/10.1103/PhysRevE.94.012213PMID:
27575129.
41. Hoppensteadt FC, Izhikevich EM. Weakly connected neural networks: Springer Science & Business Media; 2012.
42. Pikovsky A, Rosenblum M, Kurths J. Synchronization: a universal concept in nonlinear sciences: Cam-bridge university press; 2003.
43. Murphy KP. Machine learning: a probabilistic perspective: MIT press; 2012.
45. Corron NJ. A Simple Circuit Implementation of a Van der Pol oscillator [updated 01-Feb-2010]. Avail-able from:http://ccreweb.org/documents/physics/chaos/vdp2006.html.
46. Ermentrout B. Type I membranes, phase resetting curves, and synchrony. Neural Comput. 1996; 8 (5):979–1001. PMID:8697231.
47. Gratton G, Coles MG, Donchin E. A new method for off-line removal of ocular artifact. Electroencepha-logr Clin Neurophysiol. 1983; 55(4):468–84. PMID:6187540.
48. Giraud AL, Poeppel D. Cortical oscillations and speech processing: emerging computational principles and operations. Nat Neurosci. 2012; 15(4):511–7.https://doi.org/10.1038/nn.3063PMID:22426255; PubMed Central PMCID: PMCPMC4461038.
49. Bourguignon M, De Tiege X, de Beeck MO, Ligot N, Paquier P, Van Bogaert P, et al. The pace of pro-sodic phrasing couples the listener’s cortex to the reader’s voice. Hum Brain Mapp. 2013; 34(2):314– 26.https://doi.org/10.1002/hbm.21442PMID:22392861.
50. Risken H. Fokker-planck equation. The Fokker-Planck Equation: Springer; 1984. p. 63–95.
51. Lakatos P, Shah AS, Knuth KH, Ulbert I, Karmos G, Schroeder CE. An oscillatory hierarchy controlling neuronal excitability and stimulus processing in the auditory cortex. J Neurophysiol. 2005; 94(3):1904– 11.https://doi.org/10.1152/jn.00263.2005PMID:15901760.
52. Galambos R, Makeig S, Talmachoff PJ. A 40-Hz auditory potential recorded from the human scalp. Proc Natl Acad Sci U S A. 1981; 78(4):2643–7. PMID:6941317; PubMed Central PMCID: PMCPMC319406.
53. Stankovski T, Duggento A, McClintock PV, Stefanovska A. Inference of time-evolving coupled dynam-ical systems in the presence of noise. Phys Rev Lett. 2012; 109(2):024101.https://doi.org/10.1103/ PhysRevLett.109.024101PMID:23030162.
54. Duggento A, Stankovski T, McClintock PVE, Stefanovska A. Dynamical Bayesian inference of time-evolving interactions: From a pair of coupled oscillators to networks of oscillators. Phys Rev E. 2012; 86 (6). doi: ARTN 061126https://doi.org/10.1103/PhysRevE.86.061126PubMed PMID:
WOS:000312702800002.
55. Stankovski T, Ticcinelli V, McClintock PVE, Stefanovska A. Coupling functions in networks of oscilla-tors. New Journal of Physics. 2015; 17(3):035002.https://doi.org/10.1088/1367-2630/17/3/035002