UAV
による神浦川の水深推定
日高悠広
*,
谷口幸弥
*,
小川進
*
Water depth Estimate in Kounoura River Using UAV
by
Haruhiro HIDAKA*, Yukiya TANIGUCHI*, Susumu OGAWA*
The history of riverbed estimation using UAV (Drone) has just started. The authors have studied distribution
map of vegetation using UAV, investigation of earthquake disaster, estimation of water quality, etc. Recently,
making the riverbed area visually by drone would be clearly. In this study, the depth of the river was estimated
using DEM (Ministry of Land, Infrastructure and Transport) and DSM (UAV). Phantom 4 Professional was
used for UAV. ArcGIS was used for analysis, PhotoScan was used for image combination and creation of 3D
model. As a result, the water depth estimation of UAV in the Kounoura River approximately was calculated
by subtracting the DEM data and the DSM data using UAV and multiplying by the refractive index of light
(1.33). Although the result consideration of this research was calculated one-dimensionally, further effects can
be expected by using the three-dimensional method of PhotoScan and ArcGIS.
Key words: Remote Sensing, DEM, DSM, GIS
1. Introduction
The history of riverbed estimation using UAV (Drone)
is still not enough. In the past, underwater visualization
processing at Kiso river using UAV was performed.
(Harada, 2016) Theoretically, obtaining the actual water
depth was possible by multiplying apparent water depth
data presumed from photographs by the
photogrammetry technique times by 1.33 (refractive
index of light). The correction was also found
statistically. For sure, this method is highly accurate,
however, removing the noise of the photograph and
measuring the water level was necessary. In conclusion,
measurement with only the drones is insufficient. Thus,
it took for relatively long time to study correctly.
However, in our research, the water depth estimation
result in the Kounoura River, Nagasaki prefecture, was
measured only by drone. This would make the researcher
take it easy. For considering, I further thought that the
water depth estimation should be simple without amount
of budget. Photo data of UAV shows DSM (Digital
Surface Model), which is different from DEM. The
authors made an inference that DSM data by UAV minus
data (DEM) by the Ministry of Land, Infrastructure and
Transport (MLIT) subtracted the apparent water depth.
multiplying 1.33 times was necessary to obtain the actual
water depth.
平成29年12月22日受付
2.Methods
2.1 Equipment and software
For taking pictures, UAV was used (Phantom 4
professional). Phantom4 professional is shown in
Fig.1. Agisoft PhotoScan was the software used
for photosynthesis. DSM data of UAV and
ArcGIS was the software used for processing DEM
data of the Geographical Survey Institute of
Land, Infrastructure and Transport. In this
research, DSM (Digital Surface Model) was
calculated by using PhotoScan.
Fig.1 UAV (Phantom4 professional)
2.2 Survey target area
The authors investigated in the Kounoura River,
Saikai-shi, Nagasaki prefecture. Kounoura River
was an area connecting upstream and
downstream as seen from the sky, covered with
forests and trees, and shooting with UAV was
very difficult. Therefore, only in the downstream
area (within 2000 m from the sea) was only
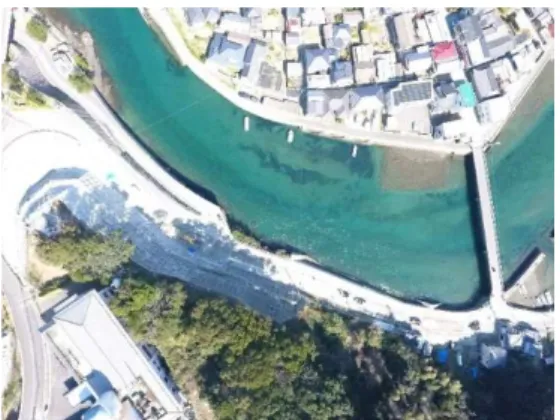
estimated. Fig. 1 is a photograph taken by the
digital camera of the downstream area of the
Kounoura River. Similarly, Fig. 2 shows the
picture taken by UAV. This shows downstream
area of the Kounoura River, showing that the
Kounoura River was very clear and transparent.
Fig. 1 Downstream area of the Kounoura River
(digital camera)
Fig. 2 Downstream area of the Kounoura River
(UAV)
2.3 Application of river topography and material
monitoring by UAV
Harada's research on river topography and
riverbed material monitoring by UAV (2017)
published by Gifu University was the applied for
this research.
The generalized model of river topography
measurement shown in Figure 3-(b) is an excerpt
of only the water depth correction DEM part of
the river topography model made by Gifu
University in 2017. On the other hand, Figure
3-(a) is a river topography measurement method
this research. The major difference between Fig.
3-(a) and Fig. 3-(b) was collecting data. while the
former method(3-b) was conformed to actual
measurement data collection actually performed
by boat with engine, on the other hand, the latter
is DEM taken from altitude by the Ministry of
Land, Infrastructure and Transport (MLIT) and
DSM taken with UAV are used for the study.
Because of this, measurement of water depth
only with UAV was calculated without actually
measuring water depth with a boat.
Fig.3 Left picture is 3-(a) Right pucture is Fig3-(b)
3. Results
The results were summarized as follows. Figure 4
was a combination of DEM around the Kounoura
River from the Ministry of Land, Infrastructure and
Transport. Figure 5 shows the satellite data of
rivers of the Kounoura River. Figure 6 shows DSM
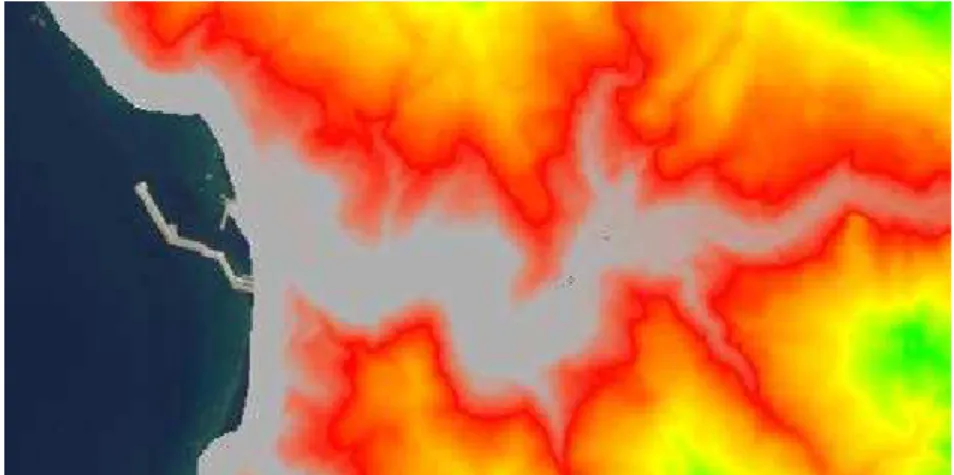
from UAV. Figure 7 shows the result of subtracting
the DEM of the Ministry of Land, Infrastructure
Fig. 4 DEM data from the Ministry of Land, Infrastructure and Transport(MLIT)
Fig. 5 Satellite imagery of Kounoura river (Arc Map)
8.7 84.4 (m)
Deep Shallow
Fig. 7 Water depth Estimate (Arc GIS)
2.3 Automatic navigation of UAV
For Phantom 4 professional used in this research,
we used full automatic application software
called Litchi for DJI. While keeping the altitude
of 150 m, the speed of UAV was nearly constant
and surveying was carried out, It means that the
accuracy is relatively high. This made carrying
out highly accurate surveying possible fully
automatically and by itself.
References
1) Hirohumi Chikatsu, Akihiko Kodaka, Shuji Yanagi,
Masaru Yokoyama: Performance assessment of 3D
modeling software in UAV photogrammetry
measurement, Journal of the Japan Society of
Photogrammetry and Remote Sensing, pp117-127,
2016.
2) Akiyuki Kawasaki, Satoshi Yoshida: Graphic
Kokon
3) S. Tsukamoto and T. Yanagi, Sea tide and periodic
current in the Ariake Sea, the Sea and Sky, 79, 1, pp.3138,
2002.
4) M. Odamaki, Y. Ooba, and N. Shibata, Historical
observation results of tide current in the Ariake Sea,
Marine Information Department Research Report, 39,
pp.33-61, 2003. E. Nishinokubi, T. Komatsu, S. Yano,
and M. Saida, Influence estimate by the Isahaya
reclamation project for flowage structure in the Ariake
Sea, Journal of Coastal Engineering, 51, pp.336-340,
2004.
5) T. Komatsu, S. Yano, M. Saida, and A. Tai, Study on
change of tidal current and material transport in the
Ariake Sea, Journal of Coastal Engineering, 53, pp.
326-330, 2006. A. Tai, M. P. Hatta, S. Yano, M. Saida, and T.
Komatsu, Influence of the levee for the sea tide and
periodic current, Journal of Coastal Engineering,53, pp.
331-335, 2006.
6) T. Nakayama, S. Saeki, and K. Kimoto, Relationship
of flowage, structure of bedding and DO on low layer in
the Isahaya Bay in Summer, Journal of Coastal
Engineering, 51, 906-910, 2004. A. Tai, T. Ohba, Y.
Hayami, T. Komatsu, S. Yano, and A. Tada, Study on
flow characteristics in the Isahaya Sea based on field
observations, Journal of JSCE, B2 (coastal engineering),
71, pp.433-438, 2015.
7) K. Hirano, J. Higano, H. Nakata, A. Shinagawa, T.
Fujita, M. Tokuoka, K. Kogo, An experiment for
preventing mass mortality of cultured short-neck clams
due to hypoxia formation during summer in Isahaya Bay,