Con t e n t s
0.I nt roduct ion
1.Woodland Areas and Plant ing 1.1. Woodland Area
1.1.1. Area of Woodland: 2014
1.1.2. Area of woodland: changes over t im e 1.1.3. Woodland area by ownership
1.2. Cert ified woodland area 1.3. Land use
1.4. Nat ional Forest I nvent ory
1.4.1. Woodland area by age: conifers 1.4.2. Woodland area by age: broadleaves 1.4.3. Woodland area by age: Sum m ary 1.4.4. Woodland area by species: conifers 1.4.5. Woodland area by species: broadleaves 1.4.6. Woodland area by species: sum m ary 1.4.7. Growing st ock by species: conifers 1.4.8. Growing st ock by species: broadleaves 1.5. Area of Farm Woodland
1.6. New plant ing and rest ocking
1.6.1. New plant ing and rest ocking by forest t ype 1.6.2. New plant ing and rest ocking by ownership 1.6.3. New plant ing and rest ocking: t im e series 1.7. Felling
1.7.1. Felling licences
1.7.2. St at ut ory Plant Healt h Not ices 2.UK- Grown Tim ber
2.1. Wood product ion
2.1.1. Sum m ary: wood product ion
2.1.2. Origin of privat e sect or soft wood rem ovals 2.1.3. Origin of FC/ NRW/ FS rem ovals
2.1.4. Soft wood availabilit y forecast 2.1.5. Hardwood availabilit y forecast 2.2. Deliveries of UK- grown roundwood 2.2.1. Soft wood deliveries
2.2.2. Hardwood deliveries 2.3. Sawm ills - All Mills
2.3.1. Sum m ary: consum pt ion & product ion 2.3.2. Num ber of sawm ills by size
2.3.3. Num ber of sawm ills by count ry
2.3.4. Num ber of sawm ills by t ype of wood sawn 2.3.5. Consum pt ion of soft wood by size of m ill 2.3.6. Consum pt ion of soft wood by count ry 2.3.7. Product ion of sawn soft wood by size of m ill 2.3.8. Product ion of sawn soft wood by count ry 2.4. Sawm ills - Larger Mills
2.4.1. Soft wood consum pt ion and product ion 2.4.2. Source of soft wood logs
2.4.3. Sawn soft wood product m arket s 2.4.4. Ot her soft wood product s
2.4.5. Sawm ill em ploym ent
2.5. Pulp & paper
2.5.1. I nput s for t he int egrat ed pulp & paper m ills 2.5.2. Product ion of paper
2.6. Wood- based panels
2.6.1. I nput s for wood- based panel product s 2.6.2. Product ion of wood- based panel product s 2.7. Miscellaneous product s
2.7.1. Soft wood round fencing m anufact urers
2.7.2. Roundwood purchased by soft wood round fencing m anufact urers 2.8. Export s
2.9. Cert ificat ion 2.9.1. Volum e cert ified
2.9.2. Chain of cust ody cert ificat es 2.10. Woodfuel and pellet s
2.10.1. Woodfuel supply by sawm ills and round fencing m anufact urers 2.10.2. Wood pellet product ion
3.Trade
3.1. Apparent consum pt ion of wood in t he UK
3.2. Apparent consum pt ion of wood product s in t he UK 3.3. Flow of recovered paper
3.4. UK im port quant it ies by product 3.5. UK export quant it ies by product 3.6. UK im port values by product 3.7. UK export values by product 3.8. Origin of wood im port s 4.UK Forest s and Clim at e Change 4.1. Carbon cycle
4.2. Forest carbon st ock 4.3. Carbon sequest rat ion 4.4. Woodland Carbon Code
4.5. Public Opinion of Forest ry - clim at e change 5.Environm ent
5.1. Populat ions of wild birds 5.2. Woodland veget at ion
5.3. Public Opinion of Forest ry - t ree healt h 5.4. Woodland Fires
6.Recreat ion
6.1. Visit s t o woodland - household surveys 6.1.1. England
6.1.2. Scot land 6.1.3. Wales
6.1.4. Public Opinion of Forest ry Survey - woodland visit ors
6.1.5. Public Opinion of Forest ry Survey - woodland visit ors by age group 6.2. Visit s t o woodland - on- sit e surveys
6.2.1. Wales All Forest s Survey 6.2.2. Scot land All Forest s Survey 6.2.3. Qualit y of Experience
6.2.4. Nort hern I reland Forest Service day visit ors 6.3. Public access t o woodland
6.3.1. Woods for People 6.3.2. Space for People 7.Em ploym ent & Businesses
7.1. Em ploym ent : Annual Business Survey ( ABS)
7.2. Em ploym ent in prim ary wood processing 7.3. Healt h & safet y
7.4. Est ablishm ent s in t he prim ary wood processing indust ries 7.5. VAT and/ or PAYE regist ered businesses
8.Finance & Prices 8.1. Tim ber prices
8.2. Financial ret urn from forest ry invest m ent 8.3. Gross value added
8.4. Governm ent expendit ure on public forest s 8.5. Ot her governm ent expendit ure on forest ry 8.6. Grant schem es
9.I nt ernat ional Forest ry
9.1. Forest cover: int ernat ional com parisons 9.2. Forest area by count ry
9.3. Annual changes in forest area 9.4. Carbon st ocks in forest biom ass 9.5. Wood rem ovals
9.6. Product ion of wood product s
9.7. Apparent consum pt ion of wood product s 9.8. World t rade in forest product s
10.Glossary 11.Sources
11.1. Sources: Woodland area and plant ing 11.1.1. Sources: Woodland area
11.1.2. Sources: Woodland I nvent ories 11.1.3. Sources: New plant ing & rest ocking 11.1.4. Sources: Felling
11.2. Sources: Tim ber
11.2.1. Sources: Wood product ion
11.2.2. Sources: Privat e Sect or Soft wood Rem ovals Survey 11.2.3. Sources: Sawm ill Survey
11.2.4. Sources: Pulp & paper 11.2.5. Sources: Wood- based panels
11.2.6. Sources: Survey of Round Fencing Manufact urers 11.2.7. Sources: Ot her deliveries
11.2.8. Sources: Com parison of rem ovals and deliveries of UK soft wood roundwood 11.2.9. Sources: Est im at ion of hardwood rem ovals from privat e sect or woodlands 11.2.10. Sources: Woodfuel and pellet s
11.2.11. Sources: Conversion fact ors 11.3. Sources: Trade
11.4. Sources: UK Forest s and Clim at e Change 11.5. Sources: Environm ent
11.6. Sources: Public Opinion of Forest ry 11.7. Sources: Recreat ion
11.8. Sources: Em ploym ent and businesses 11.9. Sources: Finance & prices
11.10. Sources: I nt ernat ional Forest ry
0 I n t r odu ct ion
Forest ry St at ist ics is a com pilat ion of st at ist ics on woodland, forest ry and prim ary wood processing in t he UK.
Where possible, st at ist ical inform at ion in t his publicat ion covers t he whole of t he Unit ed Kingdom , and is broken down t o give figures for England, Wales, Scot land and Nort hern I reland. We would like t o acknowledge t he cont ribut ion of Nat ural Resources Wales and Nort hern I reland's Forest Service in providing a wide range of st at ist ics for t his publicat ion, which has m ade it possible t o have m ore com prehensive coverage of t he
UK. However, t here are som e t opics for which dat a are current ly only available for som e part s of t he UK, and t hese t ables are labelled accordingly.
As a Nat ional St at ist ics out put , t his publicat ion concent rat es on t opics for which t he dat a m eet Nat ional
St at ist ics qualit y st andards. However som e t opics out side t he scope of Nat ional St at ist ics are included, t o give a m ore rounded pict ure; any such t ables are foot not ed as " out side t he scope of Nat ional St at ist ics" . This m eans t hat t hey have not been subj ect t o Nat ional St at ist ics qualit y assurance procedures, but does not necessarily im ply t hat t hey are of poorer qualit y. The following t ables and chart s are not designat ed as Nat ional St at ist ics:
Table 1.2: Woodland area in t he UK ( t im e series) ;
Tables 1.6 t o 1.11, figures 1.3 t o 1.4b: Nat ional Forest I nvent ory;
Table 1.15: Felling licences;
Tables 1.16a and 1.16b: St at ut ory Plant Healt h Not ices;
Table 2.4a: Soft wood availabilit y forecast s; Table 2.4b: Hardwood availabilit y forecast s;
Tables 4.1 t o 4.3b, Figures 4.2 t o 4.4: UK forest s and clim at e change;
Table 5.2: Veget at ion richness and condit ion scores;
Figure 5.2: Tree healt h;
Tables 5.3a and 5.3b: Woodland fires;
Tables 6.1 t o 6.12, Figure 6.1: Recreat ion;
Table 8.2, figure 8.2: I PD UK Forest ry I ndex;
Tables 9.1 t o 9.6, Figures 9.1 t o 9.7: I nt ernat ional forest ry.
To navigat e t his publicat ion, please use t he links on t he left - hand side of t he screen t o access t he cont ent s list , t o use t he search facilit y or t o select a range of pages t o print . The " Back t o st at ist ics" but t on will access t he Forest ry Com m ission's St at ist ics hom e page. I ndividual pages provide furt her links t o relevant t ables and sources, and you can use t he " previous" and " next " links at t he t op of t he screen t o page t hrough t he publicat ion.
The t ables wit hin each chapt er ( including dat a for chart s) are available t o download from t he Tables for download page. I n addit ion, longer t im e series ( in Excel and PDF form at s) are available for som e t ables wit hin t he St at ist ics by Topic pages at www.forest ry.gov.uk/ st at ist ics
Select ed st at ist ics from t his publicat ion are provided in " Forest ry Fact s and Figures 2014" , available at www.forest ry.gov.uk/ forest ry/ infd- 7aqf6j
The Forest ry Com m ission also publishes a range of ot her Official St at ist ics, available at www.forest ry.gov.uk/ st at ist ics
A N a t ion a l St a t ist ics pu blica t ion
The Unit ed Kingdom St at ist ics Aut horit y has designat ed t hese st at ist ics as Nat ional St at ist ics, in accordance wit h t he St at ist ics and Regist rat ion Service Act 2007 and signifying com pliance wit h t he Code of Pract ice for Official St at ist ics.
Designat ion can be broadly int erpret ed t o m ean t hat t he st at ist ics:
m eet ident ified user needs;
are well explained and readily accessible;
are produced according t o sound m et hods, and
are m anaged im part ially and obj ect ively in t he public int erest .
Once st at ist ics have been designat ed as Nat ional St at ist ics it is a st at ut ory requirem ent t hat t he Code of Pract ice shall cont inue t o be observed.
For m ore inform at ion about Nat ional St at ist ics and t he UK St at ist ics Aut horit y visit : www.st at ist icsaut horit y.gov.uk
For e st r y Com m ission ' s st a t ist ica l r e le a se pr a ct ice s
The Forest ry Com m ission aim s t o release st at ist ics as soon as t hey are available. All of our Nat ional St at ist ics and ot her Official St at ist ics publicat ions are available on our websit e www.forest ry.gov.uk/ st at ist ics. Release dat es are published on our websit e for t he year ahead. Publicat ions are m ade available at 9.30 am on t he day of release.
For e st r y Com m ission 's st a t ist ica l r e vision s policy
Revisions t o st at ist ics can occur when furt her dat a becom e available or errors are correct ed. The Forest ry Com m ission will norm ally revise st at ist ics when t he figures next appear in any publicat ion. However, if t he revision is significant ( i.e. result ing in a m aj or change t o t he published figures) , a not e showing t he revisions will be published as soon as possible on t he Forest ry Com m ission websit e and dist ribut ed t o all known recipient s. I n addit ion, t he web versions of any current publicat ions affect ed will be revised. See our full revisions policy at www.forest ry.gov.uk/ pdf/ FCrevisions.pdf/ $FI LE/ FCrevisions.pdf for furt her inform at ion.
Qu a lit y
Sum m ary inform at ion on qualit y is available in t he Sources chapt er of t his publicat ion. More det ails are provided in qualit y report s for individual t opics, available at www.forest ry.gov.uk/ forest ry/ infd- 7zhk85
Re le a se da t e : 25 Sept em ber 2014 Cove r a ge : Unit ed Kingdom
Ge ogr a ph ica l br e a k dow n : Count ry ( where possible)
I ssu e d by: Econom ics and St at ist ics, Forest ry Com m ission, 231 Cor st orphine Road, Edinburgh, EH12 7AT En qu ir ie s: Jackie Wat son 0300 067 5238 st at ist ics@forest ry.gsi.gov.uk
St a t ist icia n : Sheila War d 0300 067 5236 W e bsit e : www.forest ry.gov.uk/ st at ist ics
1 W oodla n d Ar e a s a n d Pla n t in g
I n t r odu ct ion
This chapt er cont ains st at ist ics on:
UK woodland area;
cert ified woodland area;
areas of new plant ing and rest ocking; and
felling.
Est im at es for England, Wales, Scot land and Nort hern I reland are included in addit ion t o UK t ot als. I nt ernat ional com parisons are provided in t he I nt ernat ional Forest ry chapt er. Furt her inform at ion on t he dat a sources and m et hodology used t o com pile t he figures is provided in t he Sources chapt er.
Figures on woodland area and cert ified woodland area at March 2014 and on new plant ing and rest ocking for t he period 2013- 14 were previously published in " Woodland Area, Plant ing and Rest ocking: 2013 edit ion" , released on 12 June 2014. Som e figures for t he lat est year previous years have been revised from t hose previously published. For inform at ion on t hese revisions, see t he Woodland Areas and Plant ing sect ion of t he Sources chapt er.
A copy of all woodland area and plant ing t ables is available t o download as an Excel spreadsheet from t he Tables for Download page. Longer t im e series are also available for som e t ables. These can be accessed from our Woodland Area and Plant ing St at ist ics web page at www.forest ry.gov.uk/ forest ry/ infd- 7aqknx.
Ke y fin din gs
The m ain findings are:
The area of woodland in t he UK at 31 March 2014 is est im at ed t o be 3.1 m illion hect ares. This represent s 13% of t he t ot al land area in t he UK, 10% in England, 15% in Wales, 18% in Scot land and 8% in Nort hern I reland.
Of t he t ot al UK woodland area, 0.9 m illion hect ares is owned or m anaged by t he Forest ry Com m ission ( in England and Scot land) , Nat ural Resources Wales ( in Wales) or t he Forest Service ( in Nort hern I reland) .
The t ot al cert ified woodland area in t he UK at 31 March 2014 is 1.4 m illion hect ares, including all Forest ry Com m ission/ Nat ural Resources Wales/ Forest Service woodland. Overall, 44% of t he UK woodland area is cert ified.
Thirt een t housand hect ares of new woodland were cr eat ed in t he UK in 2013- 14, m ost ly wit h broadleaved species.
Sixt een t housand hect ares of woodland were rest ocked in t he UK in 2013- 14, m ost ly wit h conifers.
A t ot al of 575 sit es were served wit h a St at ut ory Plant Healt h Not ice in 2013- 14, requiring a t ot al of 4.8 t housand hect ares of woodland t o be felled.
1 .1 W oodla n d Ar e a
Woodland is defined in UK forest ry st at ist ics as land under st ands of t rees wit h a canopy cover of at least 20% ( 25% in Nort hern I reland) , or having t he pot ent ial t o achieve t his. The definit ion relat es t o land use, rat her t han land cover, so int egral open space and felled areas t hat are await ing rest ocking are included as woodland. Furt her inform at ion, including how t his UK definit ion com pares wit h t he int ernat ional definit ion of woodland, is provided in t he Sources chapt er.
St at ist ics on woodland area are used t o inform governm ent policy and resource allocat ion, t o provide cont ext t o UK forest ry and land m anagem ent issues and are report ed t o int ernat ional organisat ions. They are also used in t he com pilat ion of nat ural capit al account s.
I ncreases in woodland area result from t he creat ion of new woodland. This can be achieved t hrough new plant ing or by nat ural colonisat ion of t rees on land near exist ing woodland. Furt her inform at ion is available in t he sect ion on New Plant ing.
Decreases in woodland area result from t he conversion of woodland t o ot her land uses. Regulat ory approval is usually required before t rees can be felled. Felling approval will norm ally require t he area t o be rest ocked, but t here are som e cases in which t rees m ay be perm anent ly rem oved, generally for environm ent al reasons. The perm anent rem oval of t rees m ay also be aut horised under planning regulat ions, t o enable developm ent .
Most public sect or woodland is owned and m anaged by t he Forest ry Com m ission ( FC) in England and Scot land, Nat ural Resources Wales ( NRW) in Wales and t he Forest Service ( FS) in Nort hern I reland. Ot her public sect or woodland ( e.g. owned by local aut horit ies) are included wit h privat ely owned woodland as “ privat e sect or” in t his release.
The Nat ural Resources Wales woodland areas and land areas shown in t his release relat e t o areas previously owned or m anaged by Forest ry Com m ission Wales. They exclude any areas previously owned or m anaged by ot her part s of Nat ural Resources Wales, such as t he form er Environm ent Agency Wales and t he form er Count ryside Council for Wales.
1 .1 .1 Ar e a of W oodla n d: 2 0 1 4
The area of woodland in t he UK at 31 March 2014 is 3.1 m illion hect ares ( Table 1.1) . Of t his t ot al, 1.4 m illion hect ares ( 45% ) is in Scot land, 1.3 m illion hect ares ( 41% ) is in England, 0.3 m illion hect ares ( 10% ) is in Wales and 0.1 m illion hect ares ( 4% ) is in Nort hern I reland.
Conifers account for around one half ( 51% ) of t he UK woodland area, alt hough t his proport ion varies from around one quart er ( 26% ) in England t o around t hree quart ers ( 74% ) in Scot land.
Ta ble 1 .1 Ar e a of w oodla nd1 by ow n e r ship & for e st t ype a t 3 1 M a r ch 2 0 1 4
For e st t ype a n d ow n e r sh ip En gla n d W a le s Scot la n d N or t h e r n
I r e la n d2 UK t housand hect ares
Con ife r s
FC/ NRW/ FS woodland 151 98 438 56 742
Privat e sect or woodland 188 53 614 11 866
Tot a l 3 3 9 1 5 1 1 0 5 1 6 6 1 6 0 8
Br oa dle a ve s3
FC/ NRW/ FS woodland 64 19 39 6 129
Privat e sect or woodland 899 136 328 39 1 402
Tot a l 9 6 2 1 5 6 3 6 8 4 5 1 5 3 1
Tot a l
FC/ NRW/ FS woodland 215 117 477 62 870
Privat e sect or woodland 1 087 189 942 50 2 268
Tot a l 1 3 0 2 3 0 6 1 4 1 9 1 1 1 3 1 3 8
Source: Forest ry Com m ission, Nat ural Resources Wales, Forest Service, Nat ional Forest I nvent ory. Not es:
1. Figures for England, Wales and Scot land are based on dat a obt ained from t he Nat ional Forest I nvent ory ( NFI ) and adj ust ed for new plant ing, but at present no adj ust m ent is m ade for woodland recent ly convert ed t o anot her land use.
2. Figures for Nort hern I reland are obt ained from t he Nort hern I reland Woodland Regist er. 3. Broadleaves include coppice and coppice wit h st andards.
1 .1 .2 Ar e a of w oodla n d: ch a n ge s ove r t im e
The 3.1 m illion hect ares of woodland in t he UK in 2014 represent s 13% of t he t ot al land area. This com prises 10% in England, 15% in Wales, 18% in Scot land and 8% in Nort hern I reland ( Table 1.2) .
Ta ble 1 .2 W oodla n d a r e a in t h e Un it e d Kin gdom
Ye a r En gla n d W a le s Scot la n d N or t h e r n
I r e la n d2 UK
Area ( 000 ha) %
1 Area
( 000 ha) %
1 Area
( 000 ha) %
1 Area
( 000 ha) %
1 Area
( 000 ha) %
1
1086 .. ~ 15 .. .. .. .. .. .. .. ..
c1350 .. ~ 10 .. .. .. ~ 4 .. .. .. ..
17t hC .. ~ 8 .. .. .. ~ 4 .. ~ 1.5 .. ..
1905 681 5.2 88 4.2 351 4.5 15 1.1 1 140 4.7
1924 660 5.1 103 5.0 435 5.6 13 1.0 1 211 5.0
1947 755 5.8 128 6.2 513 6.6 23 1.7 1 419 5.9
1965 886 6.8 201 9.7 656 8.4 42 3.1 1 784 7.4
1980 948 7.3 241 11.6 920 11.8 67 4.9 2 175 9.0
1995- 99 1 097 8.4 287 13.8 1 281 16.4 81 6.0 2 746 11.3 20143,4 1 302 10.0 306 14.8 1 419 18.2 111 8.2 3 138 12.9
Source: Forest ry Com m ission, Nat ural Resources Wales, Forest Service, Nat iona Forest I nvent ory. Not es:
1. Percent age of t he t ot al surface area excluding inland w at er. The t ot al surface ar eas, ex cluding inland w at er, ar e t aken from t he UK St andard Area Measurem ent s ( published by t he Office for Nat ional St at ist ics) .
2. For Nort hern I reland, 17t h cent ury figure is est im at e for all I reland, 1905 figure is est im at e for Ulst er 1908, 1947 figure assum es no change from 1939- 40 Census.
3. Figures for England, Wales and Scot land are based on dat a obt ained from t he Nat ional Forest I nvent ory ( NFI ) and adj ust ed for new plant ing, but at present no adj ust m ent is m ade for woodland recent ly convert ed t o anot her land use.
4. Figures for Nort hern I reland are obt ained from t he Nort hern I reland Woodland Regist er. .. Denot es dat a not available.
These figures are out side t he scope of Nat ional St at ist ics
Figure 1.1 shows woodland area by count ry since 1998. Figures for 1998 t o 2009 for England, Wales and Scot land have been revised from t hose init ially published, t o produce result s t hat are consist ent wit h t he
Nat ional Forest I nvent ory and enable com parisons over t im e. The chart indicat es t hat t he UK woodland area has risen by around 220 t housand hect ares since 1998, an increase of 7% over t he period.
Figu r e 1 .1 Ar e a of w oodla n d, 1 9 9 8 - 2 0 1 4
Source: Forest ry Com m ission, Nat ural Resources Wales, Forest Service, Nat ional Forest I nvent ory.
These figures are out side t he scope of Nat ional St at ist ics
1 .1 .3 W oodla n d a r e a by ow n e r sh ip
The Forest ry Com m ission, Nat ural Resources Wales and t he Forest Service owned or m anaged 28% of t he t ot al woodland area in t he UK in 2014 ( Table 1.3) . This proport ion ranged from 16% of t he woodland area in England t o 55% in Nort hern I reland.
Ta ble 1 .3 Ar e a of w oodla nd1 in t h e UK by ow n e r sh ip, 2 0 1 0 - 2 0 1 4
Ow n e r sh ip En gla n d W a le s Scot la n d N or t h e r n
I r e la n d2 UK t housand hect ares FC/ N RW / FS w oodla n d
2010 213 115 478 61 868
2011 213 115 479 61 869
2012 214 117 481 62 874
2013 214 117 481 62 874
2014 215 117 477 62 870
Pr iva t e se ct or w oodla n d
2010 1 076 188 900 27 2 191
2011 1 079 189 904 27 2 199
2012 1 083 188 922 44 2 236
2013 1 084 188 930 49 2 252
2014 1 087 189 942 50 2 268
Tot a l w oodla n d
2010 1 290 303 1 378 88 3 059
2011 1 292 304 1 383 88 3 067
2012 1 298 305 1 403 105 3 110
2013 1 298 305 1 411 111 3 125
2014 1 302 306 1 419 111 3 138
Source: Forest ry Com m ission, Nat ural Resources Wales, Forest Service, Nat ional Forest I nvent ory.
Not es:
1. Figures for England, Wales and Scot land are based on dat a obt ained from t he Nat ional Forest I nv ent ory ( NFI ) and adj ust ed for new plant ing, but at present no adj ust m ent is m ade for woodland recent ly convert ed t o anot her land use.
2. Nort hern I reland figures since 2012 are obt ained from t he Nort her n I reland Woodland Regist er.
1 .2 Ce r t ifie d w oodla n d a r e a
Cert ified woodland in t he UK has been independent ly audit ed against t he UK Woodland Assurance St andard. Forest ry cert ificat ion schem es are owned by int ernat ional non- governm ent al organisat ions and exist t o prom ot e good forest pract ice. They offer product labels t o dem onst rat e t hat wood or wood product s com e from well- m anaged forest s.
Figures for cert ified woodland areas are oft en used as an indicat or of sust ainable forest m anagem ent . However, it should be not ed t hat woodland t hat is not cert ified m ay also be m anaged sust ainably.
Most changes t o t he cert ified woodland area figures over t im e are a result of new areas being cert ified or cert ificat es not being renewed upon expiry. Tem porary changes can also occur if t here is a t im e lag bet ween expiry and renewal.
1.4 m illion hect ares of woodland in t he UK were cert ified in March 2014 ( Table 1.4) . This represent ed 44% of t he t ot al UK woodland area, 27% in England, 46% in Wales, 58% in Scot land and 58% in Nort hern I reland.
Ta ble 1 .4 W oodla n d a r e a ce r t ifie d1 ,2, M a r ch 2 0 1 4
Ow n e r sh ip En gla n d W a le s Scot la n d N or t h e r n
I r e la n d UK t housand hect ares
FC/ NRW/ FS woodland3 215 117 477 62 870
Privat e sect or woodland 135 24 344 3 506
Tot a l w oodla n d a r e a ce r t ifie d 3 4 9 1 4 1 8 2 2 6 5 1 3 7 7
Source: Forest St ewardship Council, Forest ry Com m ission, Nat ural Resources Wales, Forest Service, Nat ional Forest I nvent ory. Not es:
1. All cert ified w oodland in 2014 is cert ified under t he Forest St ew ardship Council ( FSC) schem e. Som e of t hese woodlands are also cer t ified under t he Program m e for t he Endorsem ent of Forest Cert ificat ion ( PEFC) schem e.
2. The est im at es are based on UK dat a published by FSC, supplem ent ed by dat a fr om individual cert ificat es and ot her sources. Where possible, figures are for t he woodland area cert ified, rat her t han t he land area cert ified.
3. All FC/ NRW/ FS w oodland is cert ified. The FC/ NRW/ FS areas are t he lat est areas, as show n in Table 1.1, rat her t han t he areas shown on t he cert ificat es.
Dat a: Longer t im e series of t he above t able are available from t he Woodland St at ist ics w eb page.
Figure 1.2 present s cert ified woodland area by count ry since Decem ber 2001, wit h figures for earlier years revised for consist ency wit h result s from t he Nat ional Forest I nvent ory. This shows an increase in cert ified woodland area of over 300 t housand hect ares ( 30% ) since Decem ber 2001.
Figu r e 1 .2 Ar e a of ce r t ifie d w oodla n d, 2 0 0 1 - 2 0 1 4
Source: Forest St ewardship Council, Forest ry Com m ission, Nat ural Resources Wales, Forest Service.
Figures showing volum es of cert ified t im ber and Chain of Cust ody cert ificat es are provided in t ables 2.28 and 2.29.
1 .3 La n d u se
Not all land t hat is owned or m anaged by t he Forest ry Com m ission, Nat ural Resources Wales or t he Forest Service in Nort hern I reland is woodland; ot her land uses include agricult ural land and m ount ain areas and m oorland.
The Nat ural Resources Wales woodland areas and land areas shown relat e t o areas previously owned or
m anaged by Forest ry Com m ission Wales. They exclude any areas previously owned or m anaged by ot her part s of Nat ural Resources Wales, such as t he form er Environm ent Agency Wales and t he form er Count ryside Council for Wales.
Woodland account ed for 79% of all Forest ry Com m ission/ Nat ural Resources Wales/ Forest Service land in t he UK in 2014 ( Table 1.5) . This proport ion was highest in Wales ( 94% ) and lowest in Scot land ( 74% ) .
Ta ble 1 .5 La n d u se of t h e FC, N RW a n d FS, 2 0 1 0 - 2 0 1 4
Ye a r ( e n din g 3 1 / 3 ) En gla n d W a le s Scot la n d N or t h e r n
I r e la n d UK t housand hect ares
W oodla n d
2010 213 115 478 61 868
2011 213 115 479 61 869
2012 214 117 481 62 874
2013 214 117 481 62 874
2014 215 117 477 62 870
Ot h e r la n d1
2010 43 9 182 14 249
2011 40 9 175 14 239
2012 38 7 170 14 229
2013 38 7 171 14 230
2014 38 7 170 14 228
Tot a l FC/ N RW / FS la n d a r e a
2010 257 124 660 75 1 116
2011 254 124 654 75 1 108
2012 253 124 651 75 1 103
2013 253 124 652 75 1 104
2014 253 124 647 75 1 099
Source: Forest ry Com m ission, Nat ural Resources Wales, Forest Service. Not es:
1. " Ot her land" includes agricult ural land and ar eas of m oor land and m ount ain.
1 .4 N a t ion a l For e st I n ve n t or y
This sect ion cont ains int erim result s from t he Nat ional Forest I nvent ory ( NFI ) . The st at ist ics are based on field survey dat a com bined wit h inform at ion from t he NFI woodland m ap, which is a spat ial represent at ion of woodland areas in Great Brit ain.
The first cycle of t he NFI field survey began in 2010 and will be com plet ed in 2015. Therefore full field survey result s from t he NFI ar e not yet available. The figures present ed in t his chapt er are int erim est im at es at 31 March 2012, published in t he NFI " 50- year forecast of soft wood t im ber availabilit y" and " 50- year forecast of hardwood t im ber availabilit y" report s, released in April 2014. Bot h report s are available
at www.forest ry.gov.uk/ invent ory.
The figures present ed in Tables 1.6 t o 1.9 ( and Figures 1.3, 1.4a and 1.4b) relat e t o st ocked areas. These differ from t he woodland areas present ed in earlier t ables, as st ocked areas exclude felled areas and ( for non- FC land) areas of int egral open space.
The figures on growing st ock present ed in Tables 1.10 and 1.11 form t he basis for t he Forest ry Com m ission's availabilit y forecast s ( see Tables 2.4a and 2.4b) .
Furt her inform at ion on t he Nat ional Forest I nvent ory is available at www.forest ry.gov.uk/ invent ory
1 .4 .1 W oodla n d a r e a by a ge : con ife r s
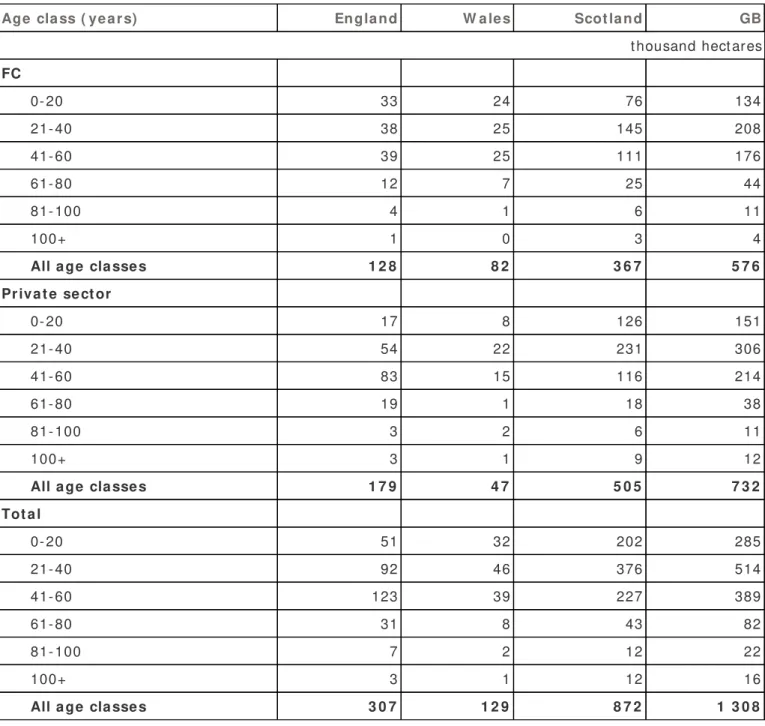
Table 1.6 present s t he area of conifers, broken down by age class, ownership and count ry.
Sixt y- one percent of t he coniferous woodland area in Great Brit ain was occupied by st ands of 40 years old or younger ( Table 1.6) . A furt her 9% of st ands were aged over 60 years.
Ta ble 1 .6 St ock e d w oodla nd a r e a in GB by ow n e r sh ip a n d a ge cla ss: Con ife r s
Age cla ss ( ye a r s) En gla n d W a le s Scot la n d GB
t housand hect ares
FC
0- 20 33 24 76 134
21- 40 38 25 145 208
41- 60 39 25 111 176
61- 80 12 7 25 44
81- 100 4 1 6 11
100+ 1 0 3 4
All a ge cla sse s 1 2 8 8 2 3 6 7 5 7 6
Pr iva t e se ct or
0- 20 17 8 126 151
21- 40 54 22 231 306
41- 60 83 15 116 214
61- 80 19 1 18 38
81- 100 3 2 6 11
100+ 3 1 9 12
All a ge cla sse s 1 7 9 4 7 5 0 5 7 3 2
Tot a l
0- 20 51 32 202 285
21- 40 92 46 376 514
41- 60 123 39 227 389
61- 80 31 8 43 82
81- 100 7 2 12 22
100+ 3 1 12 16
All a ge cla sse s 3 0 7 1 2 9 8 7 2 1 3 0 8
Source: Nat ional Forest I nvent ory : 50- year forecast of soft wood availabilit y ( Forest ry Com m ission, April 2014) . Not es:
1. St ocked area only: excludes felled ar eas and ( for privat e sect or land) open space. 2. Areas at 31 March 2012.
These figures are out side t he scope of Nat ional St at ist ics
1 .4 .2 W oodla n d a r e a by a ge : br oa dle a ve s
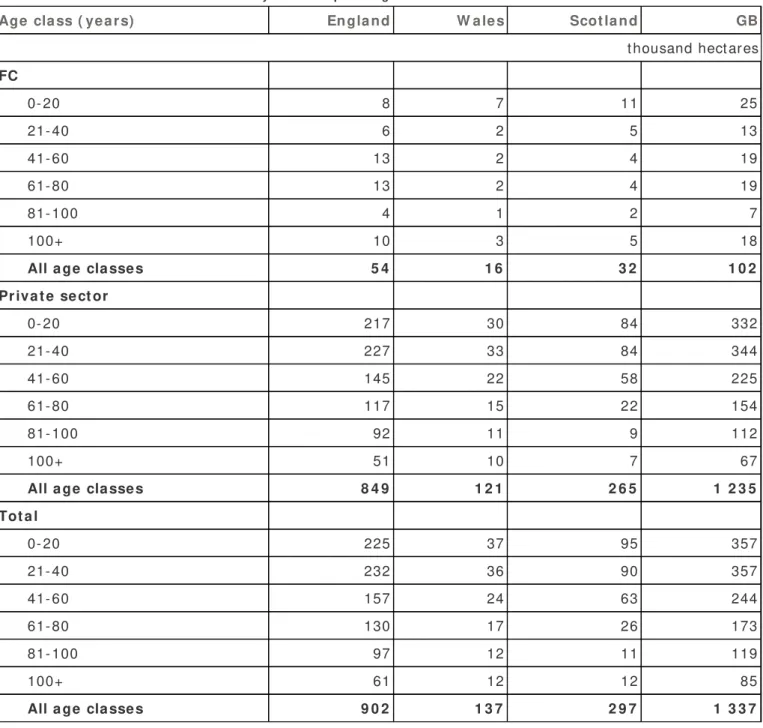
Table 1.7 present s t he area of broadleaves, broken down by age class, ownership and count ry.
Around one half ( 53% ) of t he broadleaved area was occupied by st ands of 40 years old or younger ( Table 1.7) . More t han one quart er ( 28% ) of st ands were aged over 60 years.
Ta ble 1 .7 St ock e d w oodla nd a r e a in GB by ow n e r sh ip a n d a ge cla ss: Br oa dle a ve s
Age cla ss ( ye a r s) En gla n d W a le s Scot la n d GB
t housand hect ares FC
0- 20 8 7 11 25
21- 40 6 2 5 13
41- 60 13 2 4 19
61- 80 13 2 4 19
81- 100 4 1 2 7
100+ 10 3 5 18
All a ge cla sse s 5 4 1 6 3 2 1 0 2
Pr iva t e se ct or
0- 20 217 30 84 332
21- 40 227 33 84 344
41- 60 145 22 58 225
61- 80 117 15 22 154
81- 100 92 11 9 112
100+ 51 10 7 67
All a ge cla sse s 8 4 9 1 2 1 2 6 5 1 2 3 5
Tot a l
0- 20 225 37 95 357
21- 40 232 36 90 357
41- 60 157 24 63 244
61- 80 130 17 26 173
81- 100 97 12 11 119
100+ 61 12 12 85
All a ge cla sse s 9 0 2 1 3 7 2 9 7 1 3 3 7
Source: Nat ional Forest I nvent ory : 50- year forecast of hardwood availabilit y ( Forest ry Com m ission, Apr il 2014) , ( support ing dat a) . Not es:
1. St ocked area only: excludes felled ar eas and ( for privat e sect or land) open space. 2. Areas at 31 March 2012.
These figures are out side t he scope of Nat ional St at ist ics
1 .4 .3 W oodla n d a r e a by a ge : Su m m a r y
Figure 1.3 present s t he age profile of woodland in Great Brit ain for conifers and for broadleaves. I t shows t hat broadleaves are m ore evenly dist ribut ed across t he age classes t han conifers.
Figu r e 1 .3 Age pr ofile of w oodla n d in GB
Source: Nat ional Forest I nvent ory : 50- year forecast of soft wood availabilit y ( Forest ry Com m ission, April 2014) . Nat ional Forest I nvent ory: 50- year forecast of hardwood availabilit y ( Forest ry Com m ission, April 2014) .
Not es:
1. St ocked area only: excludes felled ar eas and ( for privat e sect or land) open space. 2. Areas at 31 March 2012.
These figures are out side t he scope of Nat ional St at ist ics
1 .4 .4 W oodla n d a r e a by spe cie s: con ife r s
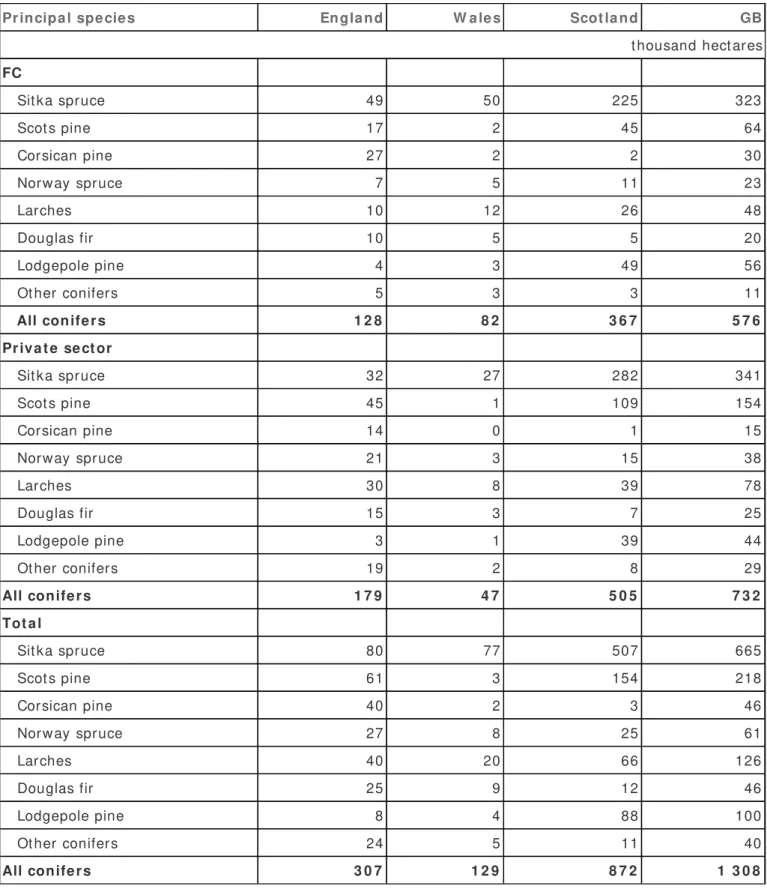
Table 1.8 present s t he area of conifers, broken down by principal species, ownership and count ry.
Sit ka spruce account s for around one half ( 51% ) of t he conifer area in Great Brit ain ( Table 1.8) , followed by Scot s pine ( 17% ) and Larches ( 10% ) . Sit ka spruce is less dom inant in England, account ing for j ust one quart er ( 26% ) of t he conifer area t here.
Ta ble 1 .8 St ock e d w oodla nd a r e a in GB by ow n e r sh ip a n d pr in cipa l spe cie s: Con ife r s
Pr in cipa l spe cie s En gla n d W a le s Scot la n d GB
t housand hect ares
FC
Sit ka spruce 49 50 225 323
Scot s pine 17 2 45 64
Corsican pine 27 2 2 30
Norway spruce 7 5 11 23
Larches 10 12 26 48
Douglas fir 10 5 5 20
Lodgepole pine 4 3 49 56
Ot her conifers 5 3 3 11
All con ife r s 1 2 8 8 2 3 6 7 5 7 6
Pr iva t e se ct or
Sit ka spruce 32 27 282 341
Scot s pine 45 1 109 154
Corsican pine 14 0 1 15
Norway spruce 21 3 15 38
Larches 30 8 39 78
Douglas fir 15 3 7 25
Lodgepole pine 3 1 39 44
Ot her conifers 19 2 8 29
All con ife r s 1 7 9 4 7 5 0 5 7 3 2
Tot a l
Sit ka spruce 80 77 507 665
Scot s pine 61 3 154 218
Corsican pine 40 2 3 46
Norway spruce 27 8 25 61
Larches 40 20 66 126
Douglas fir 25 9 12 46
Lodgepole pine 8 4 88 100
Ot her conifers 24 5 11 40
All con ife r s 3 0 7 1 2 9 8 7 2 1 3 0 8
Source: Nat ional Forest I nvent ory : 50- year forecast of soft wood availabilit y ( Forest ry Com m ission, April 2014) . Not es:
1. St ocked area only: excludes felled ar eas and ( for privat e sect or land) open space. 2. Areas at 31 March 2012.
These figures are out side t he scope of Nat ional St at ist ics
1 .4 .5 W oodla n d a r e a by spe cie s: br oa dle a ve s
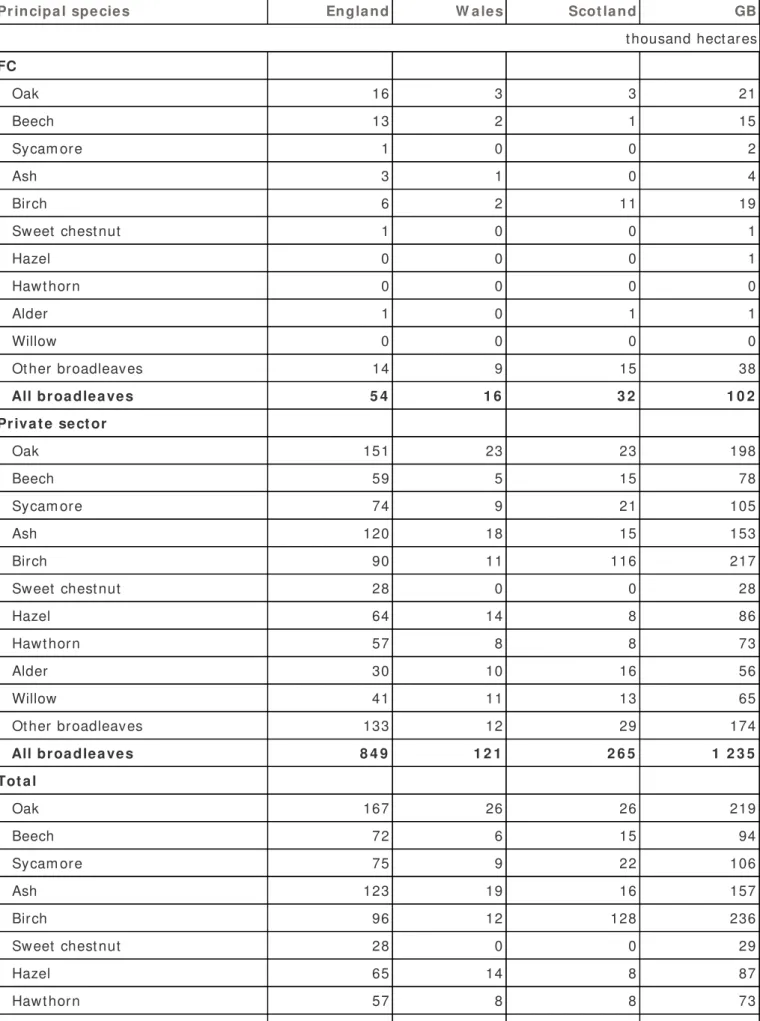
Table 1.9 present s t he area of broadleaves, broken down by principal species, ownership and count ry.
The m ost com m only occurring broadleaved species in Great Brit ain are Birch ( account ing for 18% of broadleaf woodland) , Oak ( 16% ) and Ash ( 12% ) ( Table 1.9) . Birch is m ore dom inant in Scot land, account ing for 43% of t he broadleaf area t here.
Ta ble 1 .9 St ock e d w oodla nd a r e a in GB by ow n e r sh ip a n d pr in cipa l spe cie s: Br oa dle a ve s
Pr in cipa l spe cie s En gla n d W a le s Scot la n d GB
t housand hect ares
FC
Oak 16 3 3 21
Beech 13 2 1 15
Sycam ore 1 0 0 2
Ash 3 1 0 4
Birch 6 2 11 19
Sweet chest nut 1 0 0 1
Hazel 0 0 0 1
Hawt horn 0 0 0 0
Alder 1 0 1 1
Willow 0 0 0 0
Ot her broadleaves 14 9 15 38
All br oa dle a ve s 5 4 1 6 3 2 1 0 2
Pr iva t e se ct or
Oak 151 23 23 198
Beech 59 5 15 78
Sycam ore 74 9 21 105
Ash 120 18 15 153
Birch 90 11 116 217
Sweet chest nut 28 0 0 28
Hazel 64 14 8 86
Hawt horn 57 8 8 73
Alder 30 10 16 56
Willow 41 11 13 65
Ot her broadleaves 133 12 29 174
All br oa dle a ve s 8 4 9 1 2 1 2 6 5 1 2 3 5
Tot a l
Oak 167 26 26 219
Beech 72 6 15 94
Sycam ore 75 9 22 106
Ash 123 19 16 157
Birch 96 12 128 236
Sweet chest nut 28 0 0 29
Hazel 65 14 8 87
Hawt horn 57 8 8 73
Alder 31 10 17 58
Willow 41 11 13 65
Ot her broadleaves 146 21 44 212
All br oa dle a ve s 9 0 2 1 3 7 2 9 7 1 3 3 7
Source: Nat ional Forest I nvent ory : 50- year forecast of hardwood availabilit y ( Forest ry Com m ission, Apr il 2014) . Not es:
1. St ocked area only: excludes felled ar eas and ( for privat e sect or land) open space. 2. Areas at 31 March 2012.
These figures are out side t he scope of Nat ional St at ist ics
1 .4 .6 W oodla n d a r e a by spe cie s: su m m a r y
Figures 1.4a and 1.4b show t hat , whilst t he conifer area is dom inat ed by a sm all num ber of species ( Sit ka spruce and Scot s pine t oget her account for around t wo t hirds of t he conifer area) , broadleaves are m ore varied.
Figu r e 1 .4 a Pr in cipa l t r e e spe cie s in GB by st ock e d a r e a : Con ife r s
Source: Nat ional Forest I nvent ory : 50- year forecast of soft wood availabilit y ( Forest ry Com m ission, April 2014) . Not es:
1. St ocked area only: excludes felled ar eas and ( for privat e sect or land) open space. 2. Areas at 31 March 2012.
These figures are out side t he scope of Nat ional St at ist ics
Figu r e 1 .4 b Pr in cipa l t r e e spe cie s in GB by st ock e d a r e a : Br oa dle a ve s
Source: Nat ional Forest I nvent ory : 50- year forecast of hardwood availabilit y ( Forest ry Com m ission, Apr il 2014) . Not es:
1. St ocked area only: excludes felled ar eas and ( for privat e sect or land) open space. 2. Areas at 31 March 2012.
These figures are out side t he scope of Nat ional St at ist ics
1 .4 .7 Gr ow in g st ock by spe cie s: con ife r s
Growing st ock is t he volum e of t im ber in living t rees. I t is also oft en referred t o as t he st anding volum e.
Table 1.10 present s t he volum e of coniferous growing st ock, broken down by principal species, ownership and count ry.
The t ot al volum e of coniferous growing st ock in Great Brit ain was 355 m illion m3 overbark st anding ( Table 1.10) .
Sit ka spruce account s for around one half ( 51% ) of t he conifer growing st ock, followed by Scot s pine ( 15% ) and Larches ( 10% ) . This largely reflect s t he dist ribut ion of species by area ( see Table 1.8) .
Ta ble 1 .1 0 Gr ow in g st ock in GB by ow ne r sh ip a n d pr in cipa l spe cie s: Con ife r s
Pr in cipa l spe cie s En gla n d W a le s Scot la n d GB
m illion cubic m et res overbark st anding
FC
Sit ka spruce 8.9 11.1 52.1 72.0
Scot s pine 4.0 0.5 8.8 13.3
Corsican pine 5.5 0.6 0.4 6.4
Norway spruce 1.7 1.5 3.5 6.7
Larches 1.7 2.7 4.8 9.2
Douglas fir 2.7 1.3 1.4 5.4
Lodgepole pine 0.8 0.6 8.2 9.6
Ot her conifers 1.5 1.1 1.0 3.6
All con ife r s 2 6 .8 1 9 .4 8 0 .2 1 2 6 .4
Pr iva t e se ct or
Sit ka spruce 11.4 9.5 88.0 108.9
Scot s pine 14.7 0.3 24.5 39.4
Corsican pine 4.7 0.2 0.3 5.3
Norway spruce 7.1 1.3 5.9 14.4
Larches 10.7 3.3 12.3 26.3
Douglas fir 6.4 1.6 3.5 11.5
Lodgepole pine 1.0 0.3 7.4 8.7
Ot her conifers 7.6 1.1 3.0 11.7
All con ife r s 6 3 .7 1 7 .9 1 4 6 .7 2 2 8 .4
Tot a l
Sit ka spruce 20.3 20.6 140.0 180.9
Scot s pine 18.6 0.8 33.3 52.7
Corsican pine 10.2 0.8 0.7 11.7
Norway spruce 8.8 2.8 9.4 21.1
Larches 12.4 6.0 17.1 35.6
Douglas fir 9.1 2.9 4.9 16.9
Lodgepole pine 1.8 0.9 15.5 18.3
Ot her conifers 9.1 2.2 4.1 15.4
All con ife r s 9 0 .5 3 7 .4 2 2 6 .9 3 5 4 .7
Source: Nat ional Forest I nvent ory : 50- year forecast of soft wood availabilit y ( Forest ry Com m ission, April 2014) .
Not es:
1. Areas at 31 March 2012.
These figures are out side t he scope of Nat ional St at ist ics
1 .4 .8 Gr ow in g st ock by spe cie s: br oa dle a ve s
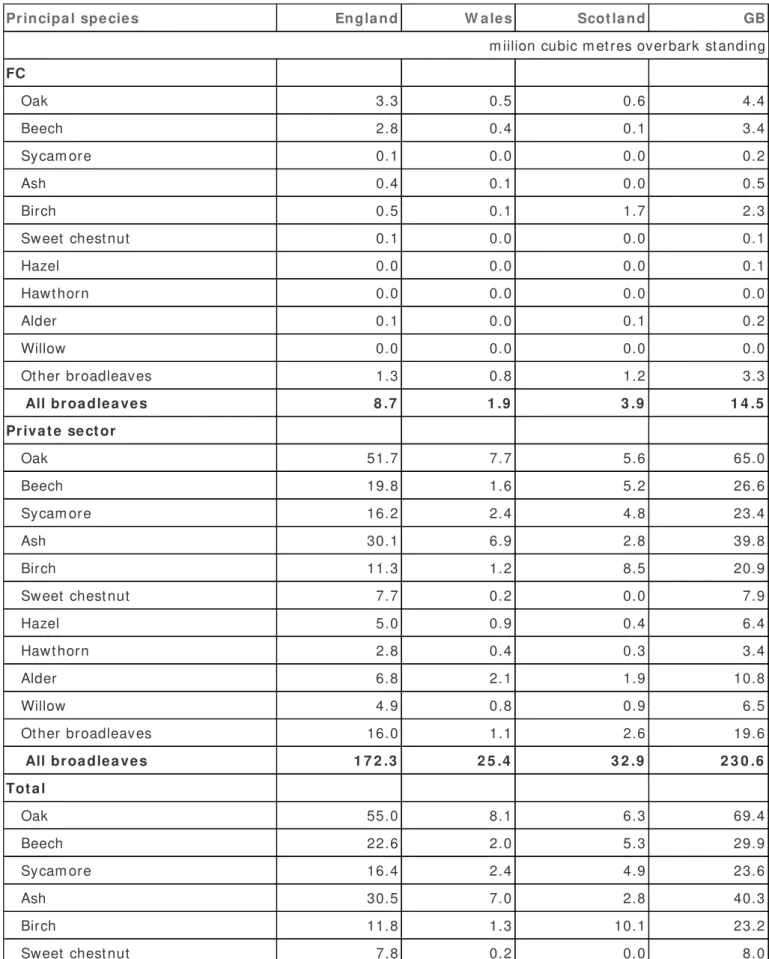
Table 1.11 present s t he volum e of broadleaved growing st ock, broken down by principal species, ownership and count ry.
The t ot al volum e of broadleaved growing st ock in Great Brit ain is 245 m illion m3 overbark st anding ( Table 1.11) .
Oak ( 28% ) , Ash ( 16% ) and Beech ( 12% ) account ed for t he m aj orit y of t he broadleaved volum e. To som e ext ent , t his reflect s t he dist ribut ion of species by area ( see Table 1.9) .
Ta ble 1 .1 1 Gr ow in g st ock in GB by ow ne r sh ip a n d pr in cipa l spe cie s: Br oa dle a ve s
Pr in cipa l spe cie s En gla n d W a le s Scot la n d GB
m iilion cubic m et res overbark st anding
FC
Oak 3.3 0.5 0.6 4.4
Beech 2.8 0.4 0.1 3.4
Sycam ore 0.1 0.0 0.0 0.2
Ash 0.4 0.1 0.0 0.5
Birch 0.5 0.1 1.7 2.3
Sweet chest nut 0.1 0.0 0.0 0.1
Hazel 0.0 0.0 0.0 0.1
Hawt horn 0.0 0.0 0.0 0.0
Alder 0.1 0.0 0.1 0.2
Willow 0.0 0.0 0.0 0.0
Ot her broadleaves 1.3 0.8 1.2 3.3
All br oa dle a ve s 8 .7 1 .9 3 .9 1 4 .5
Pr iva t e se ct or
Oak 51.7 7.7 5.6 65.0
Beech 19.8 1.6 5.2 26.6
Sycam ore 16.2 2.4 4.8 23.4
Ash 30.1 6.9 2.8 39.8
Birch 11.3 1.2 8.5 20.9
Sweet chest nut 7.7 0.2 0.0 7.9
Hazel 5.0 0.9 0.4 6.4
Hawt horn 2.8 0.4 0.3 3.4
Alder 6.8 2.1 1.9 10.8
Willow 4.9 0.8 0.9 6.5
Ot her broadleaves 16.0 1.1 2.6 19.6
All br oa dle a ve s 1 7 2 .3 2 5 .4 3 2 .9 2 3 0 .6
Tot a l
Oak 55.0 8.1 6.3 69.4
Beech 22.6 2.0 5.3 29.9
Sycam ore 16.4 2.4 4.9 23.6
Ash 30.5 7.0 2.8 40.3
Birch 11.8 1.3 10.1 23.2
Sweet chest nut 7.8 0.2 0.0 8.0
Hazel 5.1 0.9 0.5 6.5
Hawt horn 2.8 0.4 0.3 3.4
Alder 6.9 2.2 1.9 11.0
Willow 4.9 0.8 0.9 6.5
Ot her broadleaves 17.2 1.8 3.8 22.9
All br oa dle a ve s 1 8 1 .0 2 7 .3 3 6 .8 2 4 5 .1
Source: Nat ional Forest I nvent ory : 50- year forecast of hardwood availabilit y ( Forest ry Com m ission, Apr il 2014) . Not es:
1. Areas at 31 March 2012.
These figures are out side t he scope of Nat ional St at ist ics
1 .5 Ar e a of Fa r m W oodla n d
Agricult ural Censuses run by Defra ( Depart m ent for Environm ent , Food and Rural Affairs) and t he devolved adm inist rat ions collect annual inform at ion on t he land- use of farm s. Table 1.12 below shows t he area of woodland on farm s.
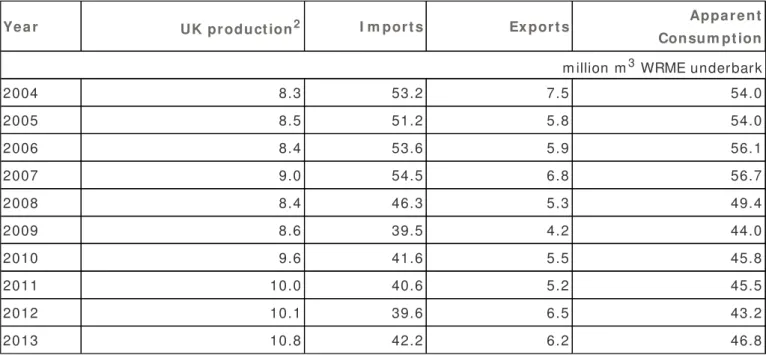
The area of farm woodland in t he UK has increased from 563 t housand hect ares in 2004 t o 865 t housand hect ares in 2013 ( Table 1.12) . Around one half ( 54% ) of all farm woodland is in Scot land, wit h a furt her 38% in England, 7% in Wales and t he rem aining 1% in Nort hern I reland.
Ta ble 1 .1 2 Ar e a of fa r m w oodla n d, 2 0 0 4 - 2 0 1 3
Ye a r En gla n d W a le s Scot la n d N or t h e r n
I r e la n d UK t housand hect ares
2004 274.1 41.7 239.0 8.2 563.0
2005 291.7 44.9 238.0 8.6 583.2
2006 296.0 51.3 249.3 9.6 606.2
2007 305.4 67.9 279.9 9.9 663.1
2008 318.8 59.2 317.3 9.9 705.2
2009 303.7 60.8 350.8 10.3 725.7
2010 295.3 69.1 399.8 10.2 774.4
2011 304.9 44.2 426.1 10.8 785.9
2012 308.4 62.6 445.4 11.0 827.5
2013 324.9 63.4 466.8 10.3 865.4
Sour ce: June Agr icult ur al Census - Defra, The Scot t ish Governm ent , Welsh Governm ent , Nort hern I reland Execut iv e.
Figu r e 1 .5 Ar e a of fa r m w oodla n d, 1 9 8 1 - 2 0 1 3
Sour ce: June Agr icult ur al Census - Defra, The Scot t ish Governm ent , Welsh Governm ent , Nort hern I reland Execut iv e.
1 .6 N e w pla n t in g a n d r e st ock in g
N e w pla n t in g
New plant ing is t he creat ion of new areas of woodland by plant ing t rees on land t hat was not previously woodland. The st at ist ics present ed here also include new woodland t hat is creat ed by nat ural colonisat ion of t rees on land near exist ing woodland. St at ist ics on new plant ing are used t o inform governm ent policy and resource allocat ion, and are used in producing annual est im at es of woodland area.
There are a num ber of fact ors t hat can affect t he level of new plant ing in t he UK. These include:
choices by landowners reflect ing t heir own m ot ivat ion and needs;
t he cost s and availabilit y of land for conversion t o woodland;
t he availabilit y of grant s for new plant ing, t he level of grant paym ent s available and t he awareness of grant s am ong pot ent ial recipient s;
t he t ax benefit s available from owning woodland;
expect ed fut ure m arket s for wood product s such as t im ber and woodfuel;
incom e from paym ent s for ecosyst em services, part icularly carbon st orage;
nat ional and local init iat ives, for exam ple on biodiversit y, green infrast ruct ure and wat er m anagem ent .
Re st ock in g
Rest ocking is t he replant ing of exist ing areas of woodland t hat have been felled. The st at ist ics present ed here also include felled areas t hat have been rest ocked by nat ural regenerat ion.
As rest ocking t akes place on woodland t hat has been previously harvest ed and it is a condit ion of m ost felling licences t hat t he area is rest ocked, rest ocking rat es are m ainly driven by harvest ing levels ( wit h a t im e lag, usually of around 2 years, bet ween harvest ing and rest ocking) . Figures for t im ber harvest ing ( wood product ion) are available in t he UK- Grown Tim ber chapt er.
Econom ic fact ors, including grant rat es, m ay have som e effect on t he species choice at rest ocking. I n addit ion, t he precise t im ing of rest ocking m ay be affect ed by weat her condit ions.
Changes t o grant support for rest ocking of conifers has changed wit h t he int roduct ion of Rural Developm ent Cont ract s in Scot land in 2008. As a result , grant aid is no longer available for rest ocking wit h Sit ka spruce in m any cases. No est im at es have been included for rest ocking of Sit ka spruce in Scot land t hat is no longer
support ed by grant s. I t is t herefore likely t hat conifer rest ocking in Scot land in recent years is under- report ed in t his release and ot her st at ist ics.
1 .6 .1 N e w pla n t in g a n d r e st ock in g by for e st t ype
The t ot al area of new plant ing and rest ocking in t he UK was around 29 t housand hect ares in 2013- 14 ( Table 1.13) . Rest ocking account ed for over one half ( 55% ) of t his t ot al. Broadleaved species account ed for around four fift hs ( 83% ) of t he new plant ing area but j ust one quart er ( 27% ) of t he rest ocking area in 2013- 14.
Ta ble 1 .1 3 N e w pla n t ing & r e st ock in g by for e st t ype
Ye a r
( e n din g 3 1 / 3 ) N e w pla n t in g Re st ock in g Tot a l
t housand hect ares Conifers Broadleaves Tot al Conifers Broadleaves Tot al Conifers Broadleaves Tot al
En gla n d
2009- 10 0.0 2.3 2.3 1.5 1.3 2.8 1.5 3.6 5.1
2010- 11 0.0 2.5 2.5 2.3 1.7 4.0 2.3 4.2 6.5
2011- 12 0.0 2.6 2.6 2.0 1.6 3.6 2.1 4.2 6.2
2012- 13 0.0 2.6 2.6 2.2 1.8 4.0 2.2 4.4 6.6
2013- 14 0.0 3.3 3.3 2.6 1.9 4.5 2.6 5.2 7.8
W a le s
2009- 10 0.0 0.2 0.2 1.3 0.8 2.1 1.3 1.0 2.3
2010- 11 0.0 0.3 0.3 1.3 0.8 2.1 1.3 1.1 2.4
2011- 12 0.1 0.6 0.8 1.4 0.6 2.0 1.5 1.2 2.7
2012- 13 0.1 0.8 0.9 1.4 0.6 2.0 1.5 1.4 2.9
2013- 14 0.1 0.8 0.9 1.4 0.8 2.3 1.6 1.6 3.2
Scot la n d
2009- 10 0.5 2.2 2.7 8.0 1.5 9.5 8.6 3.7 12.3
2010- 11 1.8 4.2 6.0 5.6 1.3 6.9 7.4 5.5 12.9
2011- 12 3.3 5.7 9.0 4.6 1.1 5.7 7.9 6.8 14.7
2012- 13 1.7 5.3 7.0 5.1 0.9 6.0 6.8 6.3 13.1
2013- 14 2.0 6.3 8.3 6.5 1.4 7.9 8.5 7.7 16.2
N or t h e r n I r e la n d
2009- 10 0.0 0.2 0.2 0.7 0.0 0.7 0.7 0.2 0.9
2010- 11 0.0 0.2 0.3 1.0 0.0 1.0 1.0 0.3 1.3
2011- 12 0.0 0.3 0.3 0.9 0.1 1.0 0.9 0.4 1.3
2012- 13 0.0 0.2 0.3 1.1 0.1 1.2 1.1 0.4 1.4
2013- 14 0.0 0.3 0.3 1.0 0.1 1.2 1.1 0.4 1.5
UK
2009- 10 0.5 4.9 5.4 11.5 3.6 15.1 12.0 8.5 20.5
2010- 11 1.8 7.3 9.1 10.3 3.8 14.0 12.1 11.0 23.1
2011- 12 3.5 9.2 12.7 9.0 3.3 12.3 12.4 12.6 25.0
2012- 13 1.9 8.9 10.8 9.7 3.4 13.1 11.6 12.3 23.9
2013- 14 2.2 10.7 12.9 11.6 4.2 15.8 13.8 14.9 28.7
Source: Forest ry Com m ission, Nat ural Resources Wales, Forest Service, grant schem es. Not es:
1. Priv at e sect or figures are based on areas for w hich grant s w ere paid during t he y ear. Est im at e of areas plant ed w it hout grant aid are also included ( w here possible) , alt hough non grant aided plant ing m ay be under- r epresent ed in t he figures. Figures for grant - aided plant ing under Rural Developm ent Cont ract s in Scot land relat e t o calendar year s.
2. The plant ing season lies bot h sides of 31 March, and t he w eat her can cause plant ing t o be advanced or delayed. 3. I ncludes nat ural colonisat ion and nat ural r egener at ion.
Dat a: Longer t im e series of t he above t able are available from t he Woodland St at ist ics w eb page.
1 .6 .2 N e w pla n t in g a n d r e st ock in g by ow n e r sh ip
I n 2013- 14 m ost new plant ing ( 95% ) t ook place on privat e sect or land ( Table 1.14) . I n cont rast , m ore t han t wo- t hirds of rest ocking ( 69% ) t ook place on FC/ NRW/ FS land.
Ta ble 1 .1 4 N e w pla n t ing & r e st ock in g by ow ne r sh ip
Ye a r
( e n din g 3 1 / 3 ) N e w Pla n t in g Re st ock in g Tot a l
t housand hect ares
FC/ NRW/
FS
Privat e sect or Tot al
FC/ NRW/ FS
Privat e sect or Tot al
FC/ NRW/ FS
Privat e sect or Tot al
En gla n d
2009- 10 0.0 2.3 2.3 1.5 1.3 2.8 1.5 3.6 5.1
2010- 11 0.0 2.5 2.5 2.5 1.5 4.0 2.5 4.0 6.5
2011- 12 0.0 2.6 2.6 2.2 1.5 3.6 2.2 4.1 6.2
2012- 13 0.0 2.6 2.6 2.2 1.7 4.0 2.2 4.3 6.6
2013- 14 0.0 3.3 3.3 2.1 2.4 4.5 2.1 5.8 7.8
W a le s
2009- 10 0.0 0.2 0.2 1.4 0.6 2.1 1.4 0.8 2.3
2010- 11 0.0 0.3 0.3 1.4 0.7 2.1 1.4 1.0 2.4
2011- 12 0.0 0.8 0.8 1.2 0.8 2.0 1.2 1.5 2.7
2012- 13 0.0 0.9 0.9 1.3 0.6 2.0 1.3 1.6 2.9
2013- 14 0.0 0.9 0.9 1.6 0.7 2.3 1.6 1.6 3.2
Scot la n d
2009- 10 0.7 2.0 2.7 3.6 6.0 9.5 4.3 7.9 12.3
2010- 11 0.8 5.2 6.0 5.3 1.7 6.9 6.1 6.8 12.9
2011- 12 1.3 7.7 9.0 4.7 1.0 5.7 6.0 8.7 14.7
2012- 13 0.8 6.2 7.0 4.7 1.3 6.0 5.6 7.5 13.1
2013- 14 0.6 7.7 8.3 6.2 1.7 7.9 6.8 9.4 16.2
N or t h e r n I r e la n d
2009- 10 0.0 0.2 0.2 0.6 0.1 0.7 0.6 0.3 0.9
2010- 11 0.0 0.3 0.3 0.9 0.2 1.0 0.9 0.5 1.3
2011- 12 0.0 0.3 0.3 0.9 0.1 1.0 0.9 0.4 1.3
2012- 13 0.0 0.3 0.3 1.1 0.1 1.2 1.1 0.4 1.4
2013- 14 0.0 0.3 0.3 1.1 0.1 1.2 1.1 0.4 1.5
UK
2009- 10 0.7 4.7 5.4 7.1 8.0 15.1 7.9 12.7 20.5
2010- 11 0.8 8.3 9.1 10.0 4.1 14.0 10.8 12.3 23.1
2011- 12 1.3 11.4 12.7 8.9 3.3 12.3 10.3 14.7 25.0
2012- 13 0.9 9.9 10.8 9.3 3.8 13.1 10.2 13.8 23.9
2013- 14 0.6 12.3 12.9 10.9 4.9 15.8 11.5 17.2 28.7
Source: Forest ry Com m ission, Nat ural Resources Wales, Forest Service, grant schem es. Not es:
1. Priv at e sect or figures are based on areas for w hich grant s w ere paid during t he y ear. Est im at e of ar eas plant ed w it hout grant aid are also included ( w here possible) , alt hough non grant aided plant ing m ay be under- r epresent ed in t he figures. Figures for grant - aided
plant ing under Rural Developm ent Cont ract s in Scot land relat e t o calendar years.
2. The plant ing season lies bot h sides of 31 March, and t he w eat her can cause plant ing t o be advanced or delayed. 3. I ncludes nat ur al colonisat ion and nat ural r egener at ion.
Dat a: Longer t im e series of t he above t able ar e available from t he Woodland St at ist ics w eb page.
1 .6 .3 N e w pla n t in g a n d r e st ock in g: t im e se r ie s
Figure 1.6 shows areas of new plant ing by count ry since t he year ending March 1976. UK new plant ing rat es have fallen from t he lat e 1980’s, decreasing by 82% bet ween 1988- 89 and 2009- 10. This followed changes t o t he t ax benefit s from owning forest ry in t he UK, int roduced in t he 1988 Finance Act
(www.legislat ion.gov.uk/ ukpga/ 1988/ 39/ cont ent s) . However, t he area of new plant ing in t he UK has m ore t han doubled since 2009- 10, largely driven by increases in Scot land following t he int roduct ion of Rural Developm ent Cont ract s. For furt her inform at ion, see t he New Plant ing and Rest ocking sect ion of t he Sources chapt er.
Figu r e 1 .6 N e w pla n t in g in t h e UK, 1 9 7 6 - 2 0 1 4
Source: Forest ry Com m ission, Nat ural Resources Wales, Forest Service, grant schem es. Not es:
1. Priv at e sect or figures are based on areas for w hich grant s w ere paid during t he y ear. Est im at e of ar eas plant ed w it hout grant aid are also included ( w here possible) , alt hough non grant aided plant ing m ay be under- r epresent ed in t he figures. Figures for grant - aided plant ing under Rural Developm ent Cont ract s in Scot land relat e t o calendar years.
2. The plant ing season lies bot h sides of 31 March, and t he w eat her can cause plant ing t o be advanced or delayed. 3. I ncludes nat ural colonisat ion.
Figure 1.7 shows areas of rest ocking by count ry since t he year ending March 1976. I t indicat es an increase in rest ocking rat es over m ost of t he period. Over t he sam e period, t here has been a general increase in UK wood product ion ( see UK- Grown Tim ber chapt er) .
The area of rest ocking fell by around one t hird bet ween t he peak of 19 t housand hect ares in 2006- 07 and 2011- 12. There has since been som e recovery, wit h t he area of rest ocking increasing by 29% bet ween 2011- 12 and 2013- 14.
The decline in rest ocking levels from 2006- 07 follows changes t o grant support for rest ocking in Scot land, t hat m ay have result ed in som e non- grant aided Sit ka spruce rest ocking being excluded from t he est im at es. Reliable est im at es of t he am ount of Sit ka spruce rest ocking undert aken wit hout grant aid in Scot land are not
available. However, result s from t he Forest ry Com m ission's Nursery Survey ( an annual survey of forest nurseries in Great Brit ain) indicat e t hat , despit e a dip in t he 2009/ 10 plant ing year, sales of Sit ka spruce
plant s t o Scot land have been relat ively st able in recent years. For furt her inform at ion, see t he New Plant ing and Rest ocking sect ion of t he Sources chapt er.
Figu r e 1 .7 Re st ock in g in t h e UK, 1 9 7 6 - 2 0 1 4
Source: Forest ry Com m ission, Nat ural Resources Wales, Forest Service, grant schem es. Not es:
1. Priv at e sect or figures are based on areas for w hich grant s w ere paid during t he y ear. Est im at e of areas plant ed w it hout grant aid ar e also included ( w here possible) , alt hough non grant aided plant ing m ay be under- r epresent ed in t he figures. Figures for grant - aided plant ing under Rural Developm ent Cont ract s in Scot land relat e t o calendar y ears.
2. The plant ing season lies bot h sides of 31 March, and t he w eat her can cause plant ing t o be advanced or delayed. 3. I ncludes nat ural regenerat ion.
1 .7 Fe llin g
Fe llin g
Approval for t he felling ( cut t ing down) of t rees in t he UK is grant ed t hrough felling licences issued by t he Forest ry Com m ission, Nat ural Resources Wales or t he Forest Service.
Felling licences m ay be condit ional ( where felling approval is grant ed subj ect t o rest ocking) or uncondit ional ( where t ree felling is approved wit hout t he requirem ent t o replant ) . Uncondit ional licences are rout inely issued for silvicult ural t hinning operat ions and in t hese cases no woodland loss t akes place. However, an uncondit ional felling licence m ay be issued if t here are overriding environm ent al considerat ions, for exam ple t o enable t he rest orat ion of im port ant habit at s.
The perm anent rem oval of t rees m ight also be aut horised t hrough a St at ut ory Plant Healt h Not ice ( SPHN) . A SPHN requires t he felling of infect ed t rees, and is issued by t he Forest ry Com m ission, Nat ural Resources Wales or t he Forest Service t o prevent t he spread of pest s and diseases and m ay include woodland owned or m anaged by t hese organisat ions. They are current ly being issued t o at t em pt t o halt t he spread of Phyt opht hora ram orum , first found in Japanese larch in t he UK in 2009. There is no legal requirem ent for woodland t o be rest ocked aft er felling under a St at ut ory Plant Healt h Not ice.
The rem oval of t rees m ay also be aut horised under planning regulat ions, t o enable developm ent ( including for windfarm s) . I n t his case, a felling licence is not required.
Furt her inform at ion on felling and St at ut ory Plant Healt h Not ices is provided in t he Sources chapt er.
W oodla n d loss
I nform at ion on uncondit ional felling licences t hat do not relat e t o t hinnning m ay be seen as an indicat ion of t he level of woodland loss on land t hat is not owned or m anaged by t he Forest ry Com m ission, Nat ural Resources Wales or t he Forest Service. However, t he dat a relat es only t o felling licences issued, so does not provide inform at ion on whet her t he felling act ually t ook place ( or t he t im ing of t he felling) . I n addit ion, felling licences do not cover woodland loss t hat is aut horised under planning regulat ions.
Nat ional Forest I nvent ory Woodland Area St at ist ics for Great Brit ain ( Spring 2010) has report ed:
0.5 t housand hect ares of observed perm anent woodland loss ident ified t o dat e from work com paring t he aerial phot ography associat ed wit h t he Nat ional I nvent ory of Woodland and Trees ( NI WT) woodland m ap t o t he NFI woodland m ap;
Forest ry Com m ission adm inist rat ive based est im at es from each count ry t hat sum t o around 20- 30 t housand hect ares of woodland rem oval for open habit at creat ion or for windfarm developm ent s across Great Brit ain over t he past decade.
More recent ly, an assessm ent of woodland loss in Scot land has est im at ed t hat 19 t housand hect ares of
woodland were rem oved in Scot land in t he 10 year period t o March 2011, of which j ust over one half ( 54% ) was on privat e sect or land.
1 .7 .1 Fe llin g lice n ce s
Table 1.15 shows t he area covered by uncondit ional felling licences issued by t he Forest ry Com m ission in England and Scot land over t he last six years. The figures do not include uncondit ional felling licences issued t o perm it t hinning of woodlands. The t able covers woodland in England and Scot land t hat is not owned or m anaged by t he Forest ry Com m ission only; it does not cover felling t hat is exem pt from felling licence approval ( such as aut horisat ions for felling under planning regulat ions, felling required under a St at ut ory Plant Healt h Not ice or felling t hat is approved on condit ion t hat t he area is rest ocked) .
A t ot al of 0.4 t housand hect ares of woodland in England and 0.1 t housand hect ares of woodland in Scot land was covered by uncondit ional felling licences ( wit h no requirem ent t o rest ock) in t he year t o March 2014.
Ta ble 1 .1 5 Ar e a s of Pr iva t e se ct or w oodla n d cove r e d by u n con dit ion a l fe llin g lice n ce s1, 2 0 0 7 - 0 8 t o 2 0 1 3 - 1 4
Ye a r En gla n d Scot la n d
t housand hect ares
2007- 08 0.4 0.1
2008- 09 0.4 0.2
2009- 10 0.5 0.2
2010- 11 0.5 0.1
2011- 12 0.6 0.1
2012- 13 0.3 0.2
2013- 14 0.4 0.1
Source: Forest ry Com m ission Not es:
1. Felling licences issued in t he period. Excludes areas ex em pt from felling licence approval or under Forest ry Com m ission grant , and licences issued for t hinning.
These figures are out side t he scope of Nat ional St at ist ics