A uthor(s )
X u, Y an; Ikeda, S atoshi; S umida, K entaro; Y amamoto,
R yusuke; T anaka, Hiroki; Minato, Nagahiro
C itation
Nature C ommunications (2018), 9
Is s ue D ate
2018-03-02
UR L
http://hdl.handle.net/2433/229514
R ig ht
©
T he A uthor(s) 2018. T his article is licensed under a C reative
C ommons A ttribution 4.0 International L icense, which permits
use, sharing, adaptation, distribution and reproduction in any
medium or format, as long as you give appropriate credit to the
original author(s) and the source, provide a link to the C reative
C ommons license, and indicate if changes were made. T he
images or other third party material in this article are included
in the article’
s C reative C ommons license, unless indicated
otherwise in a credit line to the material. If material is not
included in the article’
s C reative C ommons license and your
intended use is not permitted by statutory regulation or exceeds
the permitted use, you will need to obtain permission directly
from the copyright holder. T o view a copy of this license, visit
http://creativecommons.org/licenses/by/4.0/.
T ype
J ournal A rticle
T extvers ion
publisher
Sipa1
de
fi
ciency unleashes a host-immune
mechanism eradicating chronic myelogenous
leukemia-initiating cells
Yan Xu
1,2, Satoshi Ikeda
2, Kentaro Sumida
2, Ryusuke Yamamoto
1,2, Hiroki Tanaka
2& Nagahiro Minato
1,2Chronic myelogenous leukemia (CML) caused by hematopoietic stem cells expressing the
Bcr-Ablfusion gene may be controlled by Bcr-Abl tyrosine kinase inhibitors (TKIs). However, CML-initiating cells are resistant to TKIs and may persist as minimal residual disease. We demonstrate that mice deficient in Sipa1, which encodes Rap1 GTPase-activating protein, rarely develop CML upon transfer of primary hematopoietic progenitor cells (HPCs) expressing Bcr-Abl, which cause lethal CML disease in wild-type mice. Resistance requires both T cells and nonhematopoietic cells.Sipa1−/−mesenchymal stroma cells (MSCs) show enhanced activation and directed migration to Bcr-Abl+ cells in tumor tissue and pre-ferentially produce Cxcl9, which in turn recruitsSipa1−/−memory T cells that have markedly augmented chemotactic activity. Thus,Sipa1deficiency uncovers a host immune mechanism potentially capable of eradicating Bcr-Abl+HPCs via coordinated interplay between MSCs and immune T cells, which may provide a clue for radical control of human CML.
DOI: 10.1038/s41467-018-03307-8 OPEN
1Department of Immunology and Cell Biology, Graduate School of Medicine, Kyoto University, Kyoto 606-8501, Japan.2DSK Project, Medical Innovation
Center, Graduate School of Medicine, Kyoto University, Kyoto 606-8501 Japan. Correspondence and requests for materials should be addressed to N.M. (email:[email protected])
123456789
C
ancer cells may induce dynamic reorganization of their surrounding tissue microenvironment including responses by various host cells, such as mesenchymal stroma cells (MSCs), vascular endothelial cells (ECs), and a variety of immune and inflammatory cells1–3. Although such changes in tumor tis-sue may significantly influence tumor cell growth either positively or negatively depending on the types and extents of tissue reac-tions, in most cases the tumor cells evolve, expand, invade normal tissues, and eventually metastasize. Acquired immunity has an important role among the changes, and several cellular and molecular signatures of immune contextures in tumor tissue are often associated with a good prognosis for cancer patients4,5. Nonetheless, the effects of host immunity, even against potently immunogenic tumors, may be limited due to various hindrances, including immune effectors having ineffective physical and/or functional access to cancer cells in the tissue6. The discovery of the PD-1-mediated immune checkpoint mechanism and recent clinical success of checkpoint blockade therapy in cancer patients have highlighted the importance of the functional accessibility of immune T cells to cancer cells in the tissue microenvironment7–9. Chronic myelogenous leukemia (CML) is caused by chromo-somal translocations resulting in the generation ofBcr-Ablfusion oncogene in a hematopoietic stem cells. Although the Bcr-Abl+ CML-initiating cells proliferate and differentiate under a hema-topoietic hierarchy analogous to normal hemahema-topoietic stem/ progenitor cells, they overwhelm normal hematopoiesis and lead to a massive increase in the differentiated progenies10. The CML cells induce remarkable alterations of the hematopoietic micro-environment, which may favor the survival, proliferation, and differentiation of CML-initiating cells over normal hematopoietic counterparts11–13. The robust increase in CML cells during the chronic phase may be controlled by Bcr-Abl tyrosine kinase inhibitors (TKIs), but the CML-initiating cells per se are resistant to TKIs14,15and may persist as minimal residual disease16,17. It has been reported that T cells specific for CML cells develop in the patients, particularly under certain therapies, which may lead to disease remission18,19. However, any contribution of endo-genous acquired immunity in the host to the control of CML-initiating cells usually appears to be very limited, if any, allowing the disease progression20,21. Therefore, eradication of CML-initiating cells remains a challenge for radical control of CML.Sipa1 is a specific Rap1 GTPase-activating protein (GAP) that negatively regulates Rap1 signaling22, which controls cell–cell and cell–matrix interactions through the regulation of cell adhesion-related molecules including integrins23–25. Although Sipa1-defi -cient mice remain healthy for a year or so after birth, they may eventually develop diverse late-onset disorders in the immune and hematopoietic systems, including overt systemic auto-immunity and various hematological disorders with age26–28. Such pleiotropic effects ofSipa1deficiency may be accounted for by the altered cellular interactions involved in the development of various lymphohematopoietic cell lineages in the unique tissue microenvironment29. It is reported that certain cancer cells may overexpress Sipa1, which promotes their invasion and metastasis via altered interaction with extracellular matrix (ECM) in the tissue, thus functioning as a metastasis efficiency modifier30–33. As such, Sipa1 is a key endogenous regulator of cell adhesion and migration for many cell types in tissues.
To explore the role of the host microenvironment in CML development, we investigated the CML-inducing activity of pri-mary Bcr-Abl+hematopoietic progenitor cells (HPCs) from the bone marrow (BM) of wild-type (Wt) mice inSipa1−/−hosts. We demonstrated thatSipa1−/−mice show a remarkable resistance to CML development upon the transfer of Bcr-Abl+HPCs, which cause lethal CML disease in Wt mice. Current results uncovered a novel mechanism potentially capable of eradicating Bcr-Abl+
HPCs and deterring CML disease development through immune mechanisms via coordinated interplay between MSCs and memory T cells in the tumor tissue.
Results
Sipa1-deficient mice resist CML development by Bcr-Abl+ HPCs. To investigate the effects of the Sipa1-deficient host environment on the CML-inducing activity of the primary Bcr-Abl+
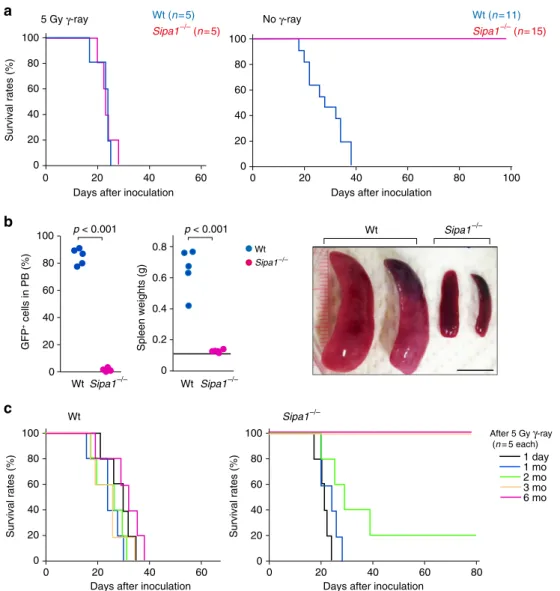
HPCs, we first transferred the primary lineage marker negative (Lin−) BM cells from Wt B6 mice retrovirally trans-duced withp210Bcr-Ablinto Wt andSipa1−/−B6 mice intrave-nously at 1.5 × 10⁴ cells/mouse according to the standard BM transplantation (BMT) procedure34. Both Wt andSipa1−/−mice similarly died within 4 weeks after BMT with lethal or even sublethal (5 Gy) γ-ray irradiation (Fig. 1a, left). Unexpectedly, however, whenBcr-Abl+
HPCs were transferred to unirradiated mice, allSipa1−/−mice survived with no evidence of disease for more than 100 days (Fig. 1a, right). All Wt mice died within 5 weeks, with only a slight delay compared to irradiated Wt mice (Fig.1a, right). The Wt mice developed a remarkable increase in GFP+leukocytes, which mostly consisted of myeloid cells in the blood, and massive splenomegaly, butSipa1−/−mice showed no detectable GFP+
cells in the circulation and had no splenomegaly (Fig. 1b). To examine the duration of the irradiation effect, we transferred theBcr-Abl+HPCs at varying intervals after 5 Gy of irradiation. All Wt recipients died within 4–5 weeks irrespective of the intervals, as expected (Fig.1c, left). In contrast, 100% and 20% of Sipa1−/−mice that were rested for more than 3 months and for 2 months, respectively, before Bcr-Abl+
HPC transfer survived with no evidence of disease, whereas all the mice with a resting interval of <1 month died within 4 weeks (Fig.1c, right). The results indicated that the Sipa1−/− host environment con-tributes potent resistance to the Bcr-Abl+
HPC-mediated CML development, which is radiosensitive and needs at least 3 months for full recovery after irradiation.
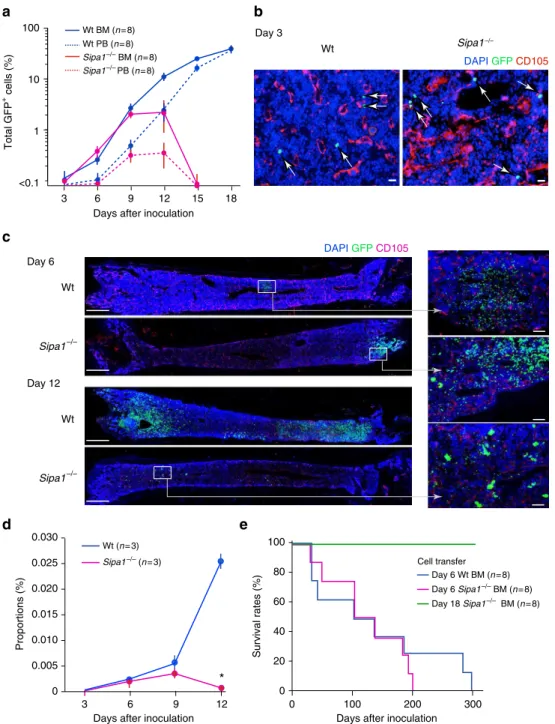
Bcr-Abl+ HPCs are properly engrafted in Sipa-1−/− BM. We then investigated whether the transferred Bcr-Abl+
HPCs could properly home to hematopoietic tissues and be engrafted in unirradiated Sipa1−/− mice. FACS analysis indicated that a detectable increase in GFP+
cells occurred in the BM of Wt recipients on day 6, followed by an exponential increase thereafter (Fig.2a). GFP+
cells were then also increased in the peripheral blood (PB) with a delay of ~3 days (Fig.2a), suggesting that BM was the primary site for the initial expansion and systemic spread of Bcr-Abl+
cells. In Sipa1−/−recipients, GFP+ cells were also increased in the BM until day 9 to an extent comparable to that in Wt mice. However, the increase rate slowed on day 12, and the GFP+
cells became essentially undetectable by day 15; the GFP+ cells in the PB were also transient and disappeared completely by day 15 (Fig. 2a). Immunostaining analysis confirmed the com-parable presence of scattered GFP+
cells in the BM parenchyma at as early as day 3, and on day 6 the clustered GFP+cell foci were observed to be similar in both Wt andSipa1−/−recipients (Fig. 2b, c). FACS analysis revealed essentially similar multi-lineage differentiation profiles of Bcr-Abl+ HPCs in Wt and Sipa1−/−recipients at day 9 (Supplementary Fig.1). On day 12, however, there were only minimal residual GFP+
cells in Sipa1−/− BM, whereas remarkable GFP+ cell expansion was evident throughout the BM of Wt mice (Fig.2b, c). Many of the residual GFP+
decline of total GFP+
cells (Fig.2d). Further, although BMCs of Sipa1−/− recipients on day 6 were capable of transferring the CML disease to the secondary Wt B6 recipients as with Wt recipients, BMCs ofSipa1−/−recipients on day 18 were no longer able to do so (Fig. 2e). Thus, Bcr-Abl+
HPCs are properly engrafted in the BM and initiated the proliferation and differ-entiation, but they are eventually rejected completely in the Sipa1−/−host.
CML resistance requires both hematopoietic and stromal cells. Next, we addressed the cellular components of the host involved in the rejection of Bcr-Abl+
HPCs in Sipa1−/− mice. Analysis usingEGFP; Sipa1reporter mice revealed considerable expression of Sipa1 in the both lymphohematopoietic and nonhematopoietic cells in the BM (Fig. 3a). In the T-cell population, memory CD44high cells exhibited greater Sipa1 expression than naive CD44lowcells of both CD4+
and CD8+
T-cell subsets (Fig.3a), in agreement with the transcriptional activation of Sipa1via T-cell
receptor (TCR) stimulation27. Therefore, we challenged the BM chimeric mice between Wt andSipa1−/−mice with WtBcr-Abl+ HPCs at 4–6 months after BMT, allowing full recovery of the resistance following γ-ray irradiation. As anticipated, <Wt BM into Wt> mice all died within 4 weeks, whereas 100% of <Sipa1−/−BM intoSipa1−/−> mice survived with no evidence of disease for more than 100 days (Fig.3b). All <Sipa1−/−BM into Wt> mice also died similarly to <Wt BM into Wt> mice, indi-cating thatSipa1−/−hematopoietic cells are ineffective in the Wt host. On the other hand, 3 out of 12 <Wt BM into Sipa1−/−> mice (25%) survived for long term, but the rest died similarly to <Wt BM into Wt> mice (Fig.3b). Although the results may imply that Wt hematopoietic cells contribute to the resistance to a certain extent in the Sipa1−/− host, the effect is much weaker than that ofSipa1−/−hematopoietic cells. With the use of a Bcr-Abl+
CML cell line BA-1, similar results were obtained (Sup-plementary Fig.2). The results strongly suggested that the robust resistance of Sipa1−/− mice to CML development depends on both hematopoietic and nonhematopoietic cell components of the 100
80 60 40 20 0
60 40
20 0
Survival rates (%)
Days after inoculation
100 80 60 40 20 0
80 60
40 20
0
Days after inoculation
5 Gy γ-ray No γ-ray
100 80 60 40 20 0
WtSipa1–/–
GFP
+ cells in PB (%)
Wt
100 80 60 40 20 0
60 40
20 0
Survival rates (%)
Days after inoculation
100 80 60 40 20 0
80 60
40 20
0
Survival rates (%)
Days after inoculation
1 day 1 mo 2 mo 3 mo 6 mo After 5 Gy γ-ray (n= 5 each) Wt
0.8 0.6 0.4 0.2 0
Spleen weights (g)
Wt Sipa1–/–
Sipa1–/–
Sipa1–/–
Wt (n= 5) Sipa1–/– (n= 5)
Wt (n= 11) Sipa1–/– (n= 15)
p < 0.001 p < 0.001 Wt Sipa1–/–
100
a
b
c
host.Sipa1−/−mice were no more resistant than Wt mice against unrelated leukemia cell lines, such as the T-ALL cell line Wo1, which also expresses GFP, and the T-cell leukemia cell line EL4 (Fig.3c), and thus the resistance was apparently selective for Bcr-Abl+cells.
Sipa1−/− T cells are essential for the CML resistance. To identify the hematopoietic cells involved in the resistance of
Sipa1−/−mice toBcr-Abl+HPCs, we performed genetic studies. The resistance ofSipa1−/−mice was completely abolished by the introduction of the Rag2−/− genetic background (Fig. 4a). Sipa1−/−CD3ε−/−mice also developed lethal CML comparably to Wt mice, whereas allSipa1−/−μMT−/−mice remained disease free for more than 100 days (Fig.4b, c). Notably, bothSipa1+/+ Rag2−/−and Sipa1+/+CD3ε−/−mice were by no means more susceptible than Wt mice, suggesting that T cells play little role in Day 3
Day 6
Day 12
3 6 9 12
0 0.005 0.010 0.015 0.020
Proportions (%)
100 80 60 40 20 0
Survival rates (%)
100 200 300
0 Wt
DAPIGFPCD105
Wt
Sipa1–/–
Wt
Sipa1–/–
Days after inoculation Days after inoculation Wt (n= 3)
Sipa1–/– (n= 3)
Sipa1–/–
DAPIGFP CD105
Day 6 Wt BM (n= 8) Day 6 Sipa1–/– BM (n= 8) Day 18 Sipa1–/– BM (n= 8)
* 100
10
1
<0.1
Days after inoculation
Total GFP
+ cells (%)
3 6 9 12 15 18
Wt BM (n= 8)
Sipa1–/– BM (n= 8) Wt PB (n= 8)
Sipa1–/– PB (n= 8)
0.030
0.025 Cell transfer
a b
c
d e
Fig. 2Bcr-Abl+HPCs home to and initiate proliferation in BM but are eventually rejected in theSipa1−/−host.aBcr-Abl+HPCs were intravenously injected into unirradiated Wt andSipa1−/−mice, and the proportions of GFP+cells in the BM and PB were assessed with FACS on varying days after injection. The means and standard errors (SEs) of eight mice are shown. The experiments were performed twice with similar results.bOn day 3 after injection with Bcr-Abl+HPCs, BMs were immunostained with DAPI, anti-GFP antibody, and anti-CD105 antibody for endothelial cells. Arrows indicate the injected GFP+cells in the BM parenchyme. Scale bars, 20μm. Similar results were confirmed in three mice of each group.cOn days 6 and 12, BMs were immunostained with
DAPI, anti-GFP, and anti-CD105 antibodies. The enlarged images of boxed regions are also shown. Scale bars, 1 mm and 100μm (enlarged). Similar results
were obtained in three mice of each group.dThe proportions of GFP+Lin−cKit+Sca-1+(LKS) cells in the BM of Wt and
Sipa1−/−mice were assessed with FACS at varying days after injection ofBcr-Abl+HPCs. The means and SEs of three mice per group are shown. *p< 0.01 (two-tailed unpaired Student
the Wt host. To investigate the role of T-cell subsets, we exam-ined the effects of antibody-mediated cell depletion. Depletion of either CD4+or CD8+T cells completely abolished the resistance ofSipa1−/−mice, although natural killer (NK)-cell depletion had no effect (Fig. 4d). These results indicated that acquired T-cell immunity including both CD4+
and CD8+
T cells has a crucial role in mediating the rejection of Bcr-Abl+
HPCs in Sipa1−/− mice. In agreement with thefindings,Sipa1−/−BM at day12 after Bcr-Abl+
HPC transfer contained significantly more T cells than Wt BM with less GFP+
cells (p< 0.01, two-tailed unpaired Stu-dent’st-test), the increase being more prominent in CD8+
T cells than CD4+
T cells (Fig.4e). Also, the majority of increased T cells
were memory cell type (Fig. 4e), suggestive of systemic influx. Immunostaining analysis further confirmed that the foci of GFP+ cells in theSipa1−/−BM were associated with substantially more T cells than those in Wt BM, and such T cells often formed a tight adhesion to GFP+
cells (Supplementary Fig.3).
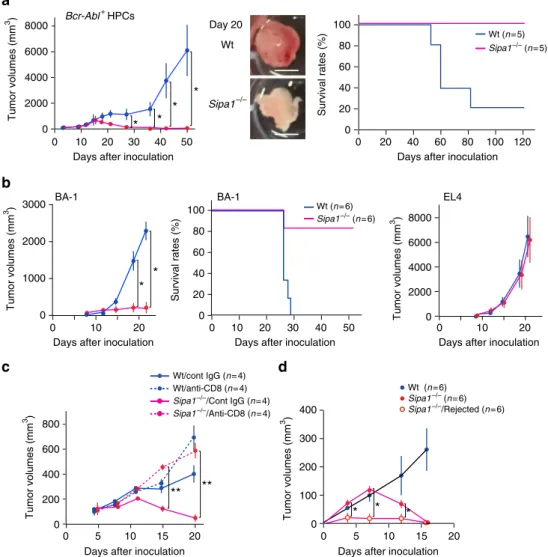
CML resistance ofSipa1−/−host is not confined to the BM. We next addressed the nature of nonhematopoietic cells ofSipa1−/− mice in the context of resistance to Bcr-Abl+HPCs. To investi-gate whether the resistance involves unique hematopoietic stroma cells in Sipa1−/− BM, we subcutaneously inoculated Bcr-Abl+ 100
80 60 40 20 0
Survival rates (%)
100 80
60 40
20 0
Days after inoculation
Wt into Wt (n= 10) Sipa1–/– into Wt (n= 11) Wt into Sipa1–/– (n= 12) Sipa1–/– into Sipa1–/– (n= 11)
100 80 60 40 20 0
Survival rates (%)
100 80 60 40 20 0
Survival rates (%)
100 80 60 40 20 0
Survival rates (%)
30
10 20 40 60
0 50 0 10 20 30 40 50
Days after inoculation BA-1 (Bcr-Abl+) Wt (n= 5) Sipa1–/– (n= 5) Wo-1 (T-ALL)
EGFP;Sipa1 reporter mice
GFP fluorescence intensity
30
10 20 40
0 EL4
60 Wt (n= 6)
Sipa1–/– (n= 6) Wt (n= 6) Sipa1–/– (n= 6)
Cell counts
Naive CD4+ T
B-lineage 102103 104105
102103 104105
102103104 105
102103104 105
102 103104 105
102 103104 105
102103104105
102103104105
Myeloid-lineage Memory CD4+T
Endothelial Naive CD8+T
Mesenchymal Memory CD8+T
a
b
c
Fig. 3CML resistance ofSipa1−/−mice requires both hematopoietic and non-hematopoietic cells.aExpression of GFP in the BM cells ofEGFP; Sipa1 reporter mice was analyzed with FACS at the gates of CD3+CD44lowCD62LhighCD4+(naive CD4 T), CD3+CD44highCD62LlowCD4+(memory CD4 T), CD3+
CD44lowCD62LhighCD8+
(naive CD8 T), CD3+
CD44highCD62LlowCD8+
(memory CD8 T), CD45+ B220+
(B-lineage), CD45+ CD11b+ (Myeloid), CD45−Ter119–CD31+(Endothelial), and CD45–Ter119–CD31−PDGFRα+(Mesenchymal). Shaded regions indicate staining with isotype-matched control IgG. The intensities of GFP were confirmed to correlate with the intracellular Sipa1 expression levels.bBM chimeras between Wt and Sipa1−/−mice were generated for all four donor/recipient combinations as indicated. At the intervals of 4–6 months after BMT,Bcr-Abl+HPCs of Wt mice were intravenously injected into the chimeric mice at 1.5× 10⁴cells per mouse. Survival curves of indicated numbers of recipients per group are shown.c Leukemia cell lines of B6 mice, BA-1 (Bcr-Abl+CML), Wo-1 (T-ALL), and EL4 (T cell), were intravenously injected at 105cells per mouse into Wt and
HPCs in Matrigel matrix to prevent systemic cell diffusion. The
“ectopic”transfer ofBcr-Abl+
HPCs into Wt mice also resulted in the local expansion and tumor formation and eventually killed the majority of recipients (Fig. 5a). Significant GFP+
cells appeared in the regional lymph nodes and circulation only at a later stage. The Bcr-Abl+ HPCs in subcutaneous tissue showed differentiation biased to B-lineage cells unlike in BM, where they were mostly differentiated into myeloid cells (Supplementary Fig.4). Thisfinding probably reflects the different hematopoietic cytokines available in particular tissues. In contrast, theBcr-Abl+ HPCs inoculated subcutaneously into Sipa1−/− mice initially formed small nodules but were completely rejected after 3 weeks; 100% of the recipients remained tumor-free for more than 120 days, with no appearance of GFP+
cells in the circulation either (Fig. 5a). Essentially similar results were obtained when Sipa1−/−mice were subcutaneously challenged with BA-1 cells, whereas EL4 leukemia cells formed progressive tumors compar-ably in both Sipa1−/−and Wt mice (Fig.5b). The resistance of Sipa1−/− mice to subcutaneous Bcr-Abl+ HPCs was also
radiosensitive and dependent on T cells, including CD8+ T cells (Supplementary Fig. 5, Fig. 5c). To further investigate the immunological memory, we subcutaneously injected Sipa1−/− mice with Matrigel matrix with or without Bcr-Abl+
HPCs on one frank, followed by a challenge with Bcr-Abl+
HPCs on the other frank at day 30, when the primary tumors were completely rejected. Although controlSipa1−/−mice showed transient tumor growth, those that rejected the tumors developed only negligible tumors, suggesting an effective memory response (Fig.5d). These results suggested that nonhematopoietic cells required for the rejection ofBcr-Abl+
HPCs inSipa1−/−mice are not confined to the hematopoietic tissues.
Infiltration of MSCs and T cells inside CML ofSipa1−/−host. We next performed histological analysis of the subcutaneous tumors. The subcutaneously injected Bcr-Abl+ HPCs formed tightly packed blastic tumor tissues in Wt mice with some small mononuclear cells at the peripheral edges (Fig. 6a, left). In Wt B6 (n= 11)
Sipa1–/– (n= 11) Rag2–/– (n= 19) Sipa1–/– Rag2–/– (n= 19)
0 100 80 60 40 20
Survival rates (%)
0 20 40 60 80 100 120 140 Days after inoculation
0 0 100
80 60 40 20
Survival rates (%)
40
20 60
Days after inoculation Sipa1–/– (n= 6)
MT–/– (n= 9) Sipa1–/–
MT–/– (n= 26)
0 100 80 60 40 20
0 20 40 60 80 100 120 140 Days after inoculation
Survival rates (%)
0 0 100 80 60 40 20
60
20 40 80 100 120 140 Days after inoculation
Survival rates (%)
Wt B6 (n= 7) Sipa1–/– (n= 6) CD3–/– (n= 8) Sipa1–/– CD3
–/– (n= 8)
Anti-CD4 (n= 8) Sipa1–/–
Control IgG (n= 8)
Anti-CD8 (n= 8) Anti-NK1.1 (n= 5)
Cell no. (×10
5)
GFP+ CD3+ CD4+ mCD4+ CD8+ mCD8+ WT Sipa1–/–
Cell no. (×10
5)
30
20
10
0 **
3
2
1
0
* **
**
** **
a b
c d
e
Fig. 4T cells of both CD4+and CD8+cell types are essential for CML resistance ofSipa1−/−mice.a–cSipa1−/−mice were crossed withRag2−/−, CD3ε−/−, orμMT−/−mice to generate double KO mice, andBcr-Abl+HPCs of Wt B6 mice were intravenously injected in the unirradiated mice. Survival curves of the indicated numbers of mice per group are shown.dSipa1−/−mice were injected with anti-CD4, anti-CD8, anti-NK1.1 antibody, or control IgG twice per week beginning from the day before the injection ofBcr-Abl+HPCs. The antibody treatment was con
firmed to eliminate more than 95% of the corresponding cell types in the spleen. Survival curves of the indicated numbers of mice per group are shown.eWt andSipa1−/−B6 mice were intravenously injected withBcr-Abl+
contrast, tumor tissue in Sipa1−/−mice showed much dispersed tumor cells that was heavily infiltrated with fibroblastic and mononuclear cells inside (Fig.6a, right). Immunostaining analysis revealed massive accumulation and invasion of vimentin-positive MSCs and CD3+
T cells at largely coinciding areas in the tumor tissues ofSipa1−/−mice, whereas these host cells were scarce in the tumor tissues of Wt mice (Fig.6b). At a higher magnification, the vimentin-positive cells in Sipa1−/− mice showed spread reticular forms and infiltrating CD3+
T cells were irregularly shaped and often had tails, suggestive of activation (Fig. 6b). FACS analysis confirmed a remarkable increase in the propor-tions of T cells relative to GFP+
tumor cells in the tissues of Sipa1−/−mice and, to a lesser extent, B cells, macrophages, and dendritic cells, with negligible γδT cells, NK cells, and granulo-cytes (Fig. 6c). The actual numbers of both CD4+
and CD8+ T cells were also greater in the tumor tissues ofSipa1−/−mice,
the majority showed memory phenotype (Fig.6d). The ratios of CD8+
to CD4+
T cells tended to be greater in the tumors of Sipa1−/−mice than in those of Wt mice (0.70 vs. 0.35), whereas the proportions of Foxp3+ cells were comparable (about 10%). The results suggested that MSCs play an important role in rejecting Bcr-Abl+
CML cells along with T cells in the tumor tissue ofSipa1−/−mice.
Activation ofSipa1−/−MSCs and T-cell chemokine secretion. To assess the activation status of MSCs in tumor tissues, we sorted the GFP−CD45−CD31−Ter119−cell populations mostly representing mesenchymal cells fromBcr-Abl+
tumors of Wt and Sipa1−/− mice for comparative DNA microarray. Gene set enrichment analysis indicated a marked increase in several gene sets in a Sipa1−/− population, including mesenchymal lineage 8000
6000 4000 2000 0
Tumor volumes (mm
3 )
0 10 20 30 40 50
Days after inoculation Days after inoculation
0 20 40 60 80 100 120
100 80 60 40 20 0
Survival rates (%)
Bcr-Abl+HPCs
8000 6000 4000 2000 0
0 10 20
Days after inoculation EL4
Day 20 Wt
Sipa1–/– * *
*
Wt (n= 5) Sipa1–/– (n= 5)
0 10 20
Days after inoculation 3000
2000 1000 0
Tumor volumes (mm
3 )
Tumor volumes (mm
3 )
BA-1
* *
Days after inoculation
0 10 20 30 40 50
100 80 60 40 20 0
Survival rates (%)
Wt/cont IgG (n= 4)
Sipa1–/–/Cont IgG (n= 4) Wt/anti-CD8 (n= 4)
Sipa1–/–/Anti-CD8 (n= 4)
Wt (n= 6) Sipa1–/– (n= 6) Sipa1–/–/Rejected (n= 6) Wt (n= 6)
Sipa1–/– (n= 6)
0 5 10 15 20
Days after inoculation 400
300 200 100 0
Tumor volumes (mm
3 )
* *
Days after inoculation 800
600 400 200 0
Tumor volumes (mm
3 )
20
0 5 10 15
BA-1 *
* ** **
a
b
c d
WT B6 Sipa1–/–
Sipa1–/– (n= 5) Wt (n= 5)
GFP–
Proportions (%)
50 40 30 20 10 0 60 70 80 90
*
*
*
* *
Sipa1–/– (n= 5) Wt (n= 5) 6
5 4 20
10
0
7 *
*
* *
* 15
5
3 2 1 0
Cell no./tumor (×10
6)
GFP– *
DAPIGFPVimentin CD11c
DAPIGFPCD3 CD105
WT B6 Sipa1–/–
GFP +
GFP +
CD3 +
CD4 +
mCD4 +
CD8 +
mCD8 +
CD3 +
γδTCR +
B220 +
NK1.1 +
CD11c +
F4/80 +
Gr-1 +
a
b
c d
Fig. 6Marked increase in memory T-cell infiltration insideBcr-Abl+tumors coinciding with increase vimentinhighMSCs inSipa1−/−mice.aBcr-Abl+HPCs were subcutaneously injected in Matrigel matrix in Wt andSipa1−/−mice, and the tumors on day 15 werefixed and stained with hematoxylin and eosin. Black arrows for Wt mice indicate mononuclear cell infiltration in the peripheral edges of the tumor mass. Scale bars, 100 and 20μm (enlarged). The white
arrow and arrowhead indicate stromal reaction and dense mononuclear cell infiltration, respectively. Enlarged images of boxed regions are also shown.b Serial sections of subcutaneousBcr-Abl+
tumors in Wt andSipa1−/−mice were immunostained with indicated antibodies. Enlarged images of boxed regions are also shown. Scale bars, 200 and 50μm (enlarged).cSubcutaneousBcr-Abl+tumors on day 15 in Wt andSipa1−/−mice were dispersed into single-cell suspensions in collagenase/DNase I solution and analyzed for the indicated cell markers with FACS. The means and SEs of the proportions of
genes (Supplementary Fig. 6). Using quantitative polymerase chain reaction (qPCR), we confirmed that intratumorSipa1−/− MSCs at day 7 showed increased expression of mesenchymal lineage genes (Vimentin, Sca-1, Icam1, Pdgfra, Pdgfrb, Snai1/2), ECM- and ECM receptor-related genes (Col1a/3a, Intb1, Intb5, Inta5, Inta11, IntaV), and fibroblast growth factor (FGF) and FGF receptor (FGFR) family genes (Fgfr1, Fgf1/2/7/10) (Fig.7a). Expression of α-Sma characteristic for reactive stroma was also increased but only slightly. Using further purified PDGFRα+ MSC populations, essentially similar results were obtained. Activation of Sipa1−/−MSCs was only transient and contracted as the tumor cell burdens began to decrease at a later stage (Supplementary Fig.7a). In addition, intratumorSipa1−/−MSCs showed remarkably increased expression of Cxcl9, Cxcl10, and Cxcl12 potentially capable of targeting activated T cells, with minimal expression of other chemokines genes targeting inflammatory myeloid cells (Fig. 7b). To examine actual che-mokine secretion in the tumor tissue, we also performed protein array analysis in the tumor tissue fluids. The tumor tissue of
Sipa1−/−mice contained remarkably abundant Cxcl9 compared to those of Wt mice (Fig.7c). Notably,Sipa1−/−tumor tissue also contained a high level of Ccl5, another potential T-cell chemo-kine, although the Ccl5 expression was negligible in Sipa1−/− MSCs (Fig.7b, c). Intracellular FACS analysis revealed that Ccl5 was produced nearly exclusively by memory CD8+T cells in the tumor tissue of Sipa1−/− mice (Supplementary Fig. 7b). These results suggest that Sipa1−/−MSCs are markedly activated and secrete abundant T-cell chemokines inBcr-Abl+tumor tissue.
Sipa1−/−MSCs and T cells show enhanced migration activity. Finally, we investigated the interaction mode ofSipa1−/−MSCs with Bcr-Abl+
cells using primary mouse embryonic fibroblasts (MEFs) in vitro. Sipa1−/− MEFs showed markedly increased phosphorylation of focal adhesion kinase (FAK), an essential molecular component required for cell migration35, on collagen I matrix compared to Wt MEFs with unchanged FAK protein level, suggesting enhanced basal ECM-mediated signaling (Fig. 8a,
6
0
Relative transcripts/b-actin
Sipa1–/–
Wt 30
20
10
0
Relative transcripts/b-actin
Sipa1–/– Wt
Cxcr2 Cxcr3
Sipa1–/– Wt Tumor tissue fluids
IFNg IL-1a IL-1b IL-2 IL-3 IL-4 IL-5 IL-6 IL-7 IL-10 IL-12 IL-13 IL-16 IL-17 IL-23 IL-27 Cxcl10 Cxcl11 Cxcl1
Ccl2
Ccl12 Cxcl9 Ccl3 Ccl4 Cxcl2 Ccl5 Cxcl12 Ccl17 TIMP1
TNFa
2.0 1.5 1.0
0
Luminescence intensity (×10
6 )
0.5
Cytokines Chemokines
Relative transcripts/b-actin
60
0 40 20
0 3
2
1
0 6
4
2
0 0.2
0.1
200
0 100
4 2
0.2
0 0.1
Intb1 Intb3 Intb5 Inta1 Inta5 Inta7 Inta9Inta11 IntaV Cxcl1 Cxcl5 Cxcl9 Cxcl0Cxcl11Cxcl12Cxcl13 Ccl2 Ccl3 Ccl5
Vimentin Sca1 aSma Vcam1 Snai1 Snai2 PdgfraPdgfrb Fgfr1 Fgf1 Fgf2 Fgf7 Fgf10 Col 1a2Col 3a1Col 6a5
a
c
b
Fig. 7Sipa1−/−MSCs inBcr-Abl+tumor tissue show mesenchymal gene activation with preferential production of T-cell chemokines.
Cell migration ( A560
)
p < 0.05 p < 0.01
p < 0.01
BA-1 – + – +
p < 0.01 p < 0.05 p < 0.05 0.20
0.18 0.16 0.14 0.12 0.10
0.02 0.08 0.06 0.04
0
0.012 0.010
0.002 0.008 0.006 0.004
0
Transcripits/b-actin
0.006 0.005
0.001 0.004 0.003 0.002
0
U.D. U.D.
Migrated cell no. (×10
3 )
50
10 40
30
20
0
50
10 40
30
20
0
Fibronectin No ECM
None Cxcl9 Ccl5 None Cxcl9 Ccl5
0.20 0.18 0.16 0.14 0.12 0.10
0.02 0.08 0.06 0.04
0
*
* *
*
*
* *
*
*
Wt MEFs
Sipa1–/– MEFs
p = 0.05 0.20
0.25
0.15
0.10
0.05
BA-1
Cell migration (
A560
) p = 0.07
p < 0.05 p < 0.01
CD8+ T cells
50
10 40
30
20
0
None Cxcl9 Ccl5 *
*
* *
* CD4+ T cells
Wt Sipa1–/–
Migrated cell no. (×10
3 )
Fibronectin
BA-1 – + – +
Collagen I
Fibronectin Actin
MEFs Wt Sipa1–/–
pFAK (Y397)
39 FAK
114 kDa
Wt Sipa1–/– MEFs 114
Sipa1
On Collagen I
Transcripits/b-actin
Wt
Sipa1–/–
MEFs
Cell migration (
A560
)
Migrated cell no. (×10
3)
– + + + – + + +
None None
Cont IgG
Anti-PGDF Cont IgGAnti-PGDF
Vec.
Bcr-Abl BA-1 Wo-1
EL4
a b
d c
e
Fig. 8Sipa1−/−MEFs show enhanced migration directed toBcr-Abl+CML cells andSipa1−/−T cells augmented chemotaxis in response to chemokines.a Wt andSipa1−/−MEFs cultured on collagen I were lysed and immunoblotted with indicated antibodies.bDirected migration of Wt andSipa1−/−MEFs to BA-1 CML cells were assessed using the Boyden chamber assay in the presence offibronectin or collagen I. The means and SEs of quadruplicate culture are shown, andpvalues were determined with two-tailed unpaired Student’st-test. The experiments were repeated three times with similar results. Pictures of crystal violet-stained migrated cells are also indicated. Scale bars, 50μm.cIn the Boyden chambers, anti-PDGFa antibody or isotype-matched control IgG
was added to the lower wells at 20μg/mL with BA-1 cells. The means and SEs of quadruplicate culture are shown, andpvalues were determined with
Supplementary Fig.8a). In the Boyden chamber assay,Sipa1−/− MEFs showed significantly enhanced directed migration to Bcr-Abl+
BA-1 cells across the membrane compared to Wt MEFs (p < 0.01, two-tailed unpaired Student’st-test); the effect was more prominent in the presence offibronectin than collagen I (Fig.8b). Such migrated Sipa1−/− MEFs showed markedly spread forms compared to Wt MEFs (Fig.8b). The enhancement of the ECM-dependent directed migration, referred to as haptotaxis35, of Sipa1−/−MEFs to BA-1 cells was significantly inhibited in the presence of anti-PDGFa or anti-PDGFRαantibody (p< 0.01, two-tailed unpaired Student’st-test) (Fig.8c, Supplementary Fig.8b). We found thatBcr-Ablexpression induced an increase inPdgfa expression in the primary BM HPCs; Bcr-Abl+
BA-1 cells con-sistently exhibited significant Pdgfa expression, whereas Wo-1 and EL4 cells did not (Fig.8d). The results suggested the invol-vement of leukemia-derived PDGF in the accumulation and activation ofSipa1−/−MSCs insideBcr-Abl+tumor tissue. Given thatSipa1−/−T cells are much more effective at rejectingBcr-Abl +
cells than Wt T cells in the Sipa1−/− environment, we also examined the chemotactic activity in response to chemokines. Activated Sipa1−/−T cells exhibited remarkably enhanced che-motaxis compared to Wt T cells in response to Cxcl9 and, to a lesser extent, Ccl5; the chemotaxis was also more prominent in the presence of fibronectin (Fig. 8e). In agreement with the relative dominance of CD8+T cells in the tumor tissue,Sipa1−/− CD8+
T cells showed greater chemotactic activity thanSipa1−/− CD4+
T cells (Fig.8e). Altogether, these results suggest thatSipa1 −/−MSCs exhibit enhanced migration directed toBcr-Abl+cells and secretion of Cxcl9, which causes efficient recruitment of Sipa1−/− memory T cells to the vicinity of the tumor cells (Supplementary Fig.9). Secretion of Ccl5 by such recruited CD8+ T cells may further amplify the T-cell recruitment inside the Bcr-Abl+
tumor tissue.
Discussion
Sustained expression ofBcr-Ablin CML-initiating cells is essen-tial for the maintenance and progression of CML disease36. Although massive expansion and accumulation of CML cells representing the differentiated progenies may be controlled by TKIs, CML-initiating cells are much less sensitive to TKIs than the majority of CML cells, partly because Bcr-Abl kinase activity alone is not sufficient to confer the leukemic stem cell activ-ity15,17,37,38. Persisting CML-initiating cells as well as mutations in Bcr-Abl kinase domain leading to drug resistance remain a potential risk for disease recurrence39,40.
In the current study, we unexpectedly found that the primary Bcr-Abl+ HPCs failed to develop CML disease in Sipa1−/−B6 mice, although they caused lethal CML with massive leukemic expansion of Bcr-Abl+
cells in Wt B6 mice as expected. This finding may be reminiscent of PD-1−/− mice that show strong resistance to certain otherwise lethal tumors expressingPD-L17. The resistance of Sipa1−/− mice was abrogated by prior γ-ray irradiation and therefore overlooked in the standard procedures for the mouse CML model using BMT34. The effect was not attributable to the failure of theSipa1−/−BM microenvironment to support proper engraftment of transferred Bcr-Abl+ HPCs because theBcr-Abl+
HPCs did proliferate and differentiate until about 10 days in Sipa1−/− BM comparably to Wt BM. Rather, Sipa1−/− recipients actively rejected the Bcr-Abl+ cells later, demonstrating a spontaneous cure with the complete elimination of CML-initiating cell activity. Genetic as well as cell depletion studies revealed that T cells of theSipa1−/−host, including both CD4+and CD8+cells, are essential for the rejection ofBcr-Abl+ HPCs, and the mice that once rejectedBcr-Abl+
HPCs apparently established the memory state. In agreement with thefindings, a
much greater number of T cells were detected around Bcr-Abl+ cells inSipa1−/−BM compared to those in Wt BM.
The resistance ofSipa1−/− mice was apparently selective for Bcr-Abl+
CML in that Sipa1−/−mice were comparably suscep-tible to other leukemia cells withoutBcr-Ablexpression relative to Wt mice. AlthoughBcr-Abl+CML expressed GFP in the current model,Sipa1−/−mice were no more resistant than Wt mice to T-ALL cells similarly expressing GFP, and thus it was unlikely that GFP was involved in the immune rejection. The Bcr-Ablfusion gene may create new antigenic epitopes, or neo-antigens, via a codon slip, and Bcr-Abl-specific T cells are detected in the CML patients18,41,42. It has also been reported that T cells specific for proteinase 3 (P3), a self antigen that is abundantly and exclusively expressed on normal myeloid cells, can emerge in CML patients under allogeneic BMT or interferon-α therapy but rarely in untreated patients; notably, the generation of these cells corre-lated with disease remission19. Sipa1−/−mice are prone to sys-temic autoimmunity28, and an intriguing possibility is that the Sipa1−/−host favors the development of such T cells specific for self antigens expressed on robustly expanding CML cells. In either case,Bcr-Abl+
CML cells can be potentially immunogenic for T cells, and crucial tumor-rejection antigens involved in a current model remain to be verified.
Current results, however, also revealed thatSipa1−/− T cells are ineffective for rejecting Bcr-Abl+ HPCs in the Wt host environment. Thus, analysis using BM chimeric mice indicated that neither <Wt BM intoSipa1−/−>mice nor <Sipa1−/−BM into Wt>mice showed strong CML resistance comparable to that of <Sipa1−/− BM into Sipa1−/−>mice, suggesting that the combi-nation ofSipa1−/−T cells andSipa1−/−nonhematopoietic cells is essential for the complete rejection.Sipa1−/−, but not Wt, mice also rejected subcutaneous Bcr-Abl+ tumors completely, sug-gesting that the requiredSipa1−/−nonhematopoietic cells do not need to be specialized hematopoietic stroma cells. Histological analysis revealed a remarkable accumulation of vimentin-positive MSCs in concordance with abundant penetration of T cells inside theBcr-Abl+
tumor tissue of theSipa1−/−host. In the Wt host, MSCs were scarcely detected in the tightly packed tumor tissue, and T cells remained at the peripheral margins of the tissue, if any. The results are consistent with the notion that infiltration of T cells in the center of tumor tissue is crucial for tumor regres-sion5, and they suggest that the accumulation and/or persistence of Sipa1−/− MSCs around the Bcr-Abl+ tumor cells plays an important role in the intratumor T cell recruitment. Notably, γ -ray radiation profoundly damages not only T cells but also MSCs43.
Intratumor Sipa1−/− MSCs showed significant activation of selective gene sets, including mesenchymal lineage genes, ECM and integrin genes, and FGF-related genes, compared to those in Wt mice. Because Sipa1 in the cytosol binds the nuclear chro-matin modifying factor Brd4, which regulates the expression of a panel of ECM and the related receptor genes44,45, the increase in nuclear Brd4 in Sipa1−/− MSCs may underlie the effects31,32. Enhanced Rap1 activation linked to protein tyrosine kinase (PTK) receptors inSipa1deficiency may also contribute to MSC activation via augmented MAPK signaling22,24. We found that Bcr-Abl expression in the primary HPCs induces Pdgfa expres-sion. MSCs constitutively express PDGFR, and PDGF is a prin-cipal factor inducing the activation of MSCs, including directed cell migration via chemotactic ECM cues, called haptotaxis35,46. Sipa1−/−MEFs showed markedly enhanced basal FAK activation and haptotaxis directed to Bcr-Abl+
Sipa1−/−MSCs in the center of tumor tissue. The role of resident MSCs in tumor tissue is controversial. Certain human cancers such as breast cancers are often associated with persistent
“reactive stroma”consisting offibroblasts showing characteristic phenotypic transition, including strong α-smooth muscle actin (SMA) expression47. Such cancer-associated fibroblasts that develop under the influence of transforming growth factor (TGF)-βmay show tumor-promoting and/or immunosuppressive activity, often correlating with poor patient prognosis3,48,49. However, residentfibroblasts in tumor tissue have been reported to potentially be able to inhibit tumor progression50; for instance, blocking TGF-βsignaling in MSCs reveals the tumor-suppressive activity51.
Importantly,Sipa1−/−MSCs, but rarely Wt MSCs, inBcr-Abl+ tumor tissue preferentially and strongly expressed chemokine genes such asCxcl9 (Mig)targeting memory T cells with minimal proinflammatory chemokines targeting myeloid cells. A recent study has suggested that tissue MSCs may develop into distinct functional subsets depending on the nature of microenviron-mental stresses52. It remains to be seen whether the Sipa1−/− MSCs preferentially producing Ccl9 represent a unique functional subset or reflect the specific mode of MSC activation in the absence of Sipa1. Furthermore, activated Sipa1−/− T cells, in particular CD8+
cells, exhibited markedly enhanced chemotactic activity in response to Cxcl9, most likely due to the increased Rap1-mediated inside-out activation of migratory integrins23. We found thatSipa1−/−memory CD8+T cells in tumor tissue fur-ther produce Ccl5 (Rantes), which shows potent TCR costimu-latory activity for CD4+
T cells in addition to T-cell chemotactic activity53. The results revealed a potentially important role of MSCs in recruiting memory T cells in the center of tumor tissue to ensure their direct encounter with tumor cells for the immune effects. The mechanism is remarkably potentiated in theSipa1−/− host, leading to the complete immunological eradication of CML; however, it remains rather latent in the Wt host. Most recently, cooperation between T cells and nonhematopoietic stroma cells leading to the rejection of a head and neck cancer cell line was reported in mice with combined deficiency ofToll-like receptors 3, 7, and954.
Large-scale cancer patient analyses have indicated that specific patterns of immune activation within tumor tissues are associated with a better prognosis for cancer patients. These patterns include an abundance of memory T cells as well as molecular signatures related to T-cell chemotaxis, cytotoxicity, and cell adhesion5. Notably, the location of T cells in the center and invasive margin of tumor tissue is significantly correlated with better prog-nosis55,56. Therefore, in clinical settings, recruitment of memory T cells inside the tumor tissue ensuring the functional access of immune T cells to tumor cells may be important for suppressing tumor progression. Our current study suggests that the coordi-nated interplay between MSCs and immune T cells inside tumor tissue has a strong potential for leading to a cure for CML disease. Although it remains to be proven whether properly accessed immune T cells can directly affect TKI-resistant CML-initiating cells and Bcr-Abl mutant cells, current results may provide a novel clue for radically controlling human CML.
Methods
Mice. C57BL/6 (B6) mice were purchased from Charles River Laboratories Inc. (Kanagawa, Japan) and SLC Inc. (Shizuoka, Japan).Rag2−/−mice were obtained
from Central Institute of Experimental Animals (Kanagawa, Japan).CD3ε−/−and
μMT−/−mice were provided by Dr. S. Fagarasan (RIKEN Center for Integrative
Medical Science, Kanagawa, Japan) and Dr. M. Reth (Albert Ludwigs Universität Freiburg, Freiburg, Germany), respectively. All these mutant mice had a B6 genetic background.Sipa1−/−mice have been reported previously26and crossed with B6
mice for more than 15 generations. Enhanced GFP (EGFP)-Sipa1 reporter (EGFP; Sipa1KI) mice were generated as a custom order by Unitech (Kashiwa, Chiba,
Japan). In brief, theSipa1chromosomal gene was isolated from bacterial artificial chromosome clones of C57BL/6 mice, and its exon 4 was replaced by a coding sequence forEGFPandloxp-neo-loxpgenes. The targeting vector containing the diphtheria toxin A fragment upstream exon 9 was transfected into embryonic stem (ES) cells (clone: Bruce 4) derived from C57BL/6 mice. The ES clones carrying the targeted allele were introduced into host embryos, and the chimeric mice were crossed with theCAG-Cretransgenic mice. In all experiments, male and female mice of 6–8-week old were used, and the numbers of mice used in experiments were indicated infigure legends. All mice were maintained in specific pathogen-free conditions at the Center for Experimental Animals of Kyoto University, and all animal experiments were performed strictly according to the institutional guide-lines by Kyoto University Animal Ethics Committee.
Cells and cultures. The BA-1 cell line was established from the bone marrow cells (BMCs) of youngSipa1−/−mice by infection withpMSCV-IRES-GFPretroviral
plasmid (MIG) containing humanp210 Bcr-Abl. The Wo-1 cell line was established from thymic T-cell acute lymphoblastic leukemia (T-ALL) developed by the BMT of HPCs transduced withMIGcontainingC3G-F57, and the T-cell leukemia cell line, EL4, was purchased from American Type Culture Collection. The cells were cultured with complete BXH-2 medium supplemented with 10% fetal calf serum (FCS)26. The leukemic cell lines were authenticated by the gene expression (C3G-F) and FACS analysis of markers (CD3, CD4). Mouse embryonicfibroblasts (MEFs) were obtained from the embryos of Wt andSipa1−/−mice on day 15.5 of gestation
and maintained with Dulbecco’s modified Eagle medium (DMEM) containing 10% FCS, unless otherwise specified. The MEFs were checked for the expression of Sipa1 with immunoblotting. All cells were tested for mycoplasma contamination.
Retrovirus infection and cell transfer. Bone marrow cells (BMCs) from 4- to 6-week-old B6 mice pretreated with 150 mg/kg 5-fluorouracil (5-FU; Kyowa Hakko Kogyo, Tokyo, Japan) were depleted of lineage marker-positive (Lin+) cells using a
cocktail of antibodies (CD3, CD4, CD8, B220, Gr-1, Mac-1, and Ter119 antibodies; BD Bioscience, San Jose, CA, USA) and anti-rat IgG-coated magnetic beads (Supplementary Table1) (Dynabeads M-450; Dynal, Oslo, Norway). The resulting Lin−BMCs enriched for HPCs were infected
withMIG/p210Bcr-Ablretrovirus as previously reported58. Briefly, the cells were infected with retroviral supernatants by spinoculation and cultured in complete BXH-2 medium containing 10 ng/mL IL-6, 10 ng/mL IL-11, 10 ng/mL Flt-3 ligand, and 50 ng/mL stem cell factor (Genzyme, Minneapolis, MN) for 48 h. Infection efficiency was 30–35%. The infected cells were injected intravenously or sub-cutaneously into mice at 1.5 × 10⁴cells per mouse. For subcutaneous injection, the
GFP+HPCs were placed in Matrigel matrix (Corning, Tewksbury, MA, USA) to
prevent rapid cell diffusion.
BM chimeras. BMCs from Wt orSipa1−/−mice were injected intravenously into
Wt orSipa1−/−mice irradiated with 13-Gyγ-ray (6.5 Gy twice with a 4-h interval)
at 2 × 10⁷cells per mouse. Chimeric rates in the procedures were more than 95%.
Chimeric mice were rested for 4–6 months before the challenge withBcr-Abl+
HPCs.
Flow cytometry. Multicolorflow cytometric analysis was performed with FACS Canto (BD Bioscience, San Jose, CA, USA), and the data were analyzed with FlowJo (Tree Star). Cells were Fc-blocked (CD16/CD32) and stained with antibodies (Supplementary Table1). Propidium iodide or Ghost dyeTMViolet 450 (Tonbo
Biosciences) was used to exclude dead cells. Intracellular staining for Ccl5 was performed with cellsfixed and made permeable with IC Fixation Buffer and Per-meabilization Buffer (eBioscience) according to the manufacturer’s instructions.
Immunostaining. Femoral bones or subcutaneous tumor tissues werefixed in 2% paraformaldehyde for 2 h at room temperature and left in 30% sucrose at 4 °C overnight before embedding in optimum cutting temperature compound (Sakura, Torrance, CA). Serial frozen sections were blocked with 5% donkey serum in phosphate-buffered saline (PBS) overnight followed by immunostaining with antibodies (Supplementary Table1) as before59. Stained tissues were mounted with
Mowiol 4–88 (Calbiochem), and images were acquired with the use offluorescence microscopy (Axiovert 200M) equipped with an AxioCam MRm Fluar 2.5×/0.12 or 5×/0.25 numerical aperture objective lens (Carl Zeiss) and analyzed with Axio-Vision version 4.6 (Carl Zeiss). Digital images were processed using Adobe Pho-toshop CS2 (Adobe). For immunostaining of MEFs, cells were grown on coverslips (Matsunami Glass Ltd., Japan),fixed with 4% paraformaldehyde for 10 min at room temperature, permeabilized with 0.1% Triton X-100 for 5 min, blocked with 5% BSA/PBS for 1 h, and incubated with primary antibodies for 1 h at room temperature followed by secondary antibodies and DAPI for 30 min. The anti-bodies used were anti-phospho-FAK (ab81298; Abcam, Cambridge, UK, at 1:1000 dilution), Alexa Fluor 568 Phalloidin (Invitrogen), and Alexa Fluor 488. Images were obtained using the BZ-X700-All-in-Onefluorescence microscope (Keyence).
per week before and once per week afterBcr-Abl+HPC injection. For CD4+and
CD8+
T-cell depletion, anti-CD4 (GK1.5) and anti-CD8 (2.34) antibodies were injected at 150μg per mouse, respectively, 2 days before and twice per week after
Bcr-Abl+HPC injection. Control groups were treated with corresponding
isotype-matched control IgG. The procedures were confirmed to have depleted more than 95% of the corresponding cell populations.
Tumor measurement and isolation of tumor-infiltrating cells. The sizes of subcutaneous tumors were measured in two dimensions, and the volumes were assessed by the following formula: tumor volume=l/2 ×w2. Tumor tissues (5 mg)
were cut into small pieces in 1 mg/mL Collagenases IV and DNase I in 2% FCS RPMI-1640 medium. After 60 min of incubation with gentle shaking at 37 °C, the cells were strained through a 40-μm nylon mesh to produce a single-cell suspension. To isolate mesenchymal stroma cells (MSCs), the cell suspensions were stained with GFP and CD45-BV510 (30-F11; BD Bioscience), anti-TER119-BV510 (TER119; BD Bioscience), anti-CD31-APC (390; BioLegend), and anti-PDGFRα(APA5; eBioscience) antibodies at 1μg/mL. The GFP−CD45−
Ter119−CD31−PDGFRα+cell population was sorted with FACS Aria III (BD
Bioscience). In some experiments, anti-PDGFRαwas omitted to ensure enough cell numbers. Contamination of GFP+cells and CD31+ECs in the MSC population
was less than 0.5% and 0.1%, respectively.
DNA microarray and qPCR analysis. RNA was extracted from the sorted GFP−
CD45−Ter119−CD31−cell populations and subjected to DNA microarray
ana-lysis (TaKaRa Bio Inc., Siga, Japan). Gene expression profiling was performed using total RNA and DNA microarray (SurePrint G3 Mouse Gene Expression v2 8 × 60 K Microarray Kit, Agilent) according to manufacturer’s protocol. Probes with
con-fident expression signals were selected usingflags produced by Feature Extraction software: IsSaturated=0, IsFeatNonUnifOL=0, IsBGNonUnifOL=0,
IsPo-sAndSignif=1 and IsWellAboveBG=1. All selected probes corresponding to ~19,000 genes were subjected to Gene Set Enrichment Analysis using expression log ratio log2(KO/WT) as rank metrics. The analysis was done with following
settings: preranked analysis mode of GSEA software (version 2.2.4, Broad Institute) and gene sets from category Hallmark and C2, which were prepared in MSigDB (Broad Institute). Quantitative PCR was performed with SYBR Green I Master mix (Roche) on a LightCycler 480 (Roche). Transcripts ofb-actinwere used as an internal control. Primer sequences for genes are listed in the Supplementary Table2.
Cytokine array analysis. Cytokine levels in tumor tissue supernatants were measured using Mouse Cytokine Antibody Array, Panel A (R&D Systems), according to the manufacturer’s instructions. Samples were analyzed as singlets using a LAS-4000 mini instrument with Image Reader Las-4000 mini and Multi Gage V3.2 software (Fujifilm).
Cell migration assay. The haptotaxis assay was performed using the CytoSelectTM
24-Well Cell Haptotaxis Assay Kit (8 µm,fibronectin-coated or collagen-coated, Cell Biolabs, Inc.) with 8.0-µm pore membrane inserts coated withfibronectin or collagen I, according to the manufacturer’s procedures. Briefly, MEFs (1 × 10⁴cells) prestarved of serum for 1 h were applied to the upper wells in the presence or absence of 2 × 10⁶BA-1 cells in the lower wells in DMEM containing 0.1% FCS, followed by incubation at 37 °C for 4 h. When indicated, 20μg/mL anti-PDGFa (Upstate), anti-PDGFRα(R&D Systems), or isotype-matched control IgG was added to the lower wells. The outer parts of the inset membranes were stained with crystal violet, and OD 560 nm was measured with ARBOTMX 2030 Multilabel Reader (PerkinElmer). The chemotaxis assay was performed using 24-well plates and 6.5-mm Transwell with 5.0-µm pore polycarbonate membrane inserts (Corning, NY, USA). Inserts were coated with 10ug/mLfibronectin (Invitrogen) for 1 h and dried. CD4+
and CD8+
T cells were isolated with autoMACS Pro Separator (Miltenyi Biotec, Bergisch Gladbach, Germany) and added to the upper chamber (5 × 10⁵cells) in 1% BSA RPMI-1640. The lower chambers werefilled with 1% BSA RPMI-1640 containing Cxcl9 or Ccl5 (PeproTech, Rocky Hill, NJ, USA) at 100 ng/mL. After 3 h of incubation in 5% CO2at 37 °C, the cells that
migrated into the lower chambers were counted by FACS Canto (BD Bioscience).
Immunoblotting. MEFs were lysed with lysis buffer (150 mM NaCl, 25 mM Tris-HCl, 1%NP-40, 1% Na deoxycholate, 0.1% SDS) and blotted with anti-Sipa126,
anti-FAK (ab40794;Abcam, Cambridge, UK), or anti-phospho-FAK (Y397;Abcam, Cambridge, UK) antibody at 1:1000 dilution. Uncropped original scan images are shown in Supplementary Fig.10.
Statistical analyses. Statistical analyses were performed using the unpaired two-tailed Student’st-test and one-way ANOVA with Bonferroni post hoc test. Spearman’s rank test was used to determine correlations;p< 0.05 indicated a significant difference. In animal experiments, it was not feasible to make an assumption of sample sizes based on the log-rank statistic, because we have never observed the development of lethal CML inSipa1−/−mice for observation period
of 100 days (i.e., zero event numbers). Age-matched mice kept in the same animal
room were used with no particular randomization, and no mice were excluded from the analysis. The investigators were not blinded for group allocations.
Data availability. The DNA Microarray data were deposited in Gene Expression Omnibus (GEO) repository, NCBI (GSE108002,https://www.ncbi.nlm.nih.gov/ geo/query/acc.cgi?acc=GSE108002). The authors declare that all the other data
supporting thefindings of this study are available within the article and its Sup-plementary Informationfiles and from the corresponding author upon reasonable request.
Received: 2 September 2017 Accepted: 5 February 2018
References
1. Liotta, L. A. & Kohn, E. C. The microenvironment of the tumour-host interface.Nature411, 375–379 (2001).
2. Trinchieri, G. Cancer and inflammation: an old intuition with rapidly evolving new concepts.Annu. Rev. Immunol.30, 677–706 (2012).
3. Kalluri, R. & Zeisberg, M. Fibroblasts in cancer.Nat. Rev. Cancer6, 392–401 (2006).
4. Vesely, M. D., Kershaw, M. H., Schreiber, R. D. & Smyth, M. J. Natural innate and adaptive immunity to cancer.Annu. Rev. Immunol.29, 235–271 (2011). 5. Galon, J., Angell, H. K., Bedognetti, D. & Marincola, F. M. The continuum of
cancer immunosurveillance: prognostic, predictive, and mechanistic signatures.Immunity39, 11–26 (2013).
6. Schreiber, R. D., Old, L. J. & Smyth, M. J. Cancer immunoediting: integrating immunity’s roles in cancer suppression and promotion.Science331, 1565–1570 (2011).
7. Iwai, Y. et al. Involvement of PD-L1 on tumor cells in the escape from host immune system and tumor immunotherapy by PD-L1 blockade.Proc. Natl Acad. Sci. USA99, 12293–12297 (2002).
8. Brahmer, J. R. et al. Safety and activity of anti-PD-L1 antibody in patients with advanced cancer.N. Engl. J. Med.366, 2455–2465 (2012).
9. Topalian, S. L. et al. Safety, activity, and immune correlates of anti-PD-1 antibody in cancer.N. Engl. J. Med.366, 2443–2454 (2012).
10. Michor, F. et al. Dynamics of chronic myeloid leukaemia.Nature435, 1267–1270 (2005).
11. Zhang, B. et al. Altered microenvironmental regulation of leukemic and normal stem cells in chronic myelogenous leukemia.Cancer Cell21, 577–592 (2012).
12. Reynaud, D. et al. IL-6 controls leukemic multipotent progenitor cell fate and contributes to chronic myelogenous leukemia development.Cancer Cell20, 661–673 (2011).
13. Supper, E., Tahir, S., Imai, T., Inoue, J. & Minato, N. Modification of gene expression, proliferation, and function of OP9 stroma cells by Bcr-Abl-expressing leukemia cells.PLoS ONE10, e0134026 (2015).
14. Hamilton, A. et al. Chronic myeloid leukemia stem cells are not dependent on Bcr-Abl kinase activity for their survival.Blood119, 1501–1510 (2012). 15. Corbin, A. S. et al. Human chronic myeloid leukemia stem cells are insensitive
to imatinib despite inhibition of BCR-ABL activity.J. Clin. Invest.121, 396–409 (2011).
16. Lowenberg, B. Minimal residual disease in chronic myeloid leukemia.N. Engl. J. Med.349, 1399–1401 (2003).
17. Holyoake, T. L. & Vetrie, D. The chronic myeloid leukemia stem cell: stemming the tide of persistence.Blood129, 1595–1606 (2017).
18. Rusakiewicz, S., Madrigal, A., Travers, P. & Dodi, A. I. BCR/ABL-specific CD8
+T cells can be detected from CML patients, but are only expanded from healthy donors.Cancer Immunol. Immunother.58, 1449–1457 (2009). 19. Molldrem, J. J. et al. Evidence that specific T lymphocytes may participate in
the elimination of chronic myelogenous leukemia.Nat. Med.6, 1018–1023 (2000).
20. Ilander, M., Hekim, C. & Mustjoki, S. Immunology and immunotherapy of chronic myeloid leukemia.Curr. Hematol. Malig. Rep.9, 17–23 (2014). 21. Riether, C., Schurch, C. M. & Ochsenbein, A. F. Regulation of hematopoietic
and leukemic stem cells by the immune system.Cell Death Differ.22, 187–198 (2015).
22. Hattori, M. & Minato, N. Rap1 GTPase: functions, regulation, and malignancy.J. Biochem.134, 479–484 (2003).
23. Katagiri, K. et al. Rap1 is a potent activation signal for leukocyte function-associated antigen 1 distinct from protein kinase C and phosphatidylinositol-3-OH kinase.Mol. Cell. Biol.20, 1956–1969 (2000).
24. Gloerich, M. & Bos, J. L. Regulating Rap small G-proteins in time and space.
Trends Cell Biol.21, 615–623 (2011).
26. Ishida, D. et al. Myeloproliferative stem cell disorders by deregulated Rap1 activation in SPA-1-deficient mice.Cancer Cell4, 55–65 (2003). 27. Ishida, D. et al. Antigen-driven T cell anergy and defective memory T cell
response via deregulated Rap1 activation in SPA-1-deficient mice.Proc. Natl Acad. Sci. USA100, 10919–10924 (2003).
28. Ishida, D. et al. Rap1 signal controls B cell receptor repertoire and generation of self-reactive B1a cells.Immunity24, 417–427 (2006).
29. Minato, N. Rap G protein signal in normal and disordered lymphohematopoiesis.Exp. Cell Res.319, 2323–2328 (2013).
30. Park, Y. G. et al. Sipa1 is a candidate for underlying the metastasis efficiency modifier locus Mtes1.Nat. Genet.37, 1055–1062 (2005).
31. Minato, N. & Hattori, M. Spa-1 (Sipa1) and Rap signaling in leukemia and cancer metastasis.Cancer Sci.100, 17–23 (2009).
32. Shimizu, Y. et al. SPA-1 controls the invasion and metastasis of human prostate cancer.Cancer Sci.102, 828–836 (2011).
33. Takahara, T. et al. SIPA1 promotes invasion and migration in human oral squamous cell carcinoma by ITGB1 and MMP7.Exp. Cell Res.352, 357–363 (2017).
34. Gishizky, M. L., Johnson-White, J. & Witte, O. N. Efficient transplantation of BCR-ABL-induced chronic myelogenous leukemia-like syndrome in mice.
Proc. Natl Acad. Sci. USA90, 3755–3759 (1993).
35. Bear, J. E. & Haugh, J. M. Directed migration of mesenchymal cells: where signaling and the cytoskeleton meet.Curr. Opin. Cell Biol.30, 74–82 (2014). 36. Ren, R. Mechanisms of BCR-ABL in the pathogenesis of chronic myelogenous
leukaemia.Nat. Rev. Cancer5, 172–183 (2005).
37. Huntly, B. J. et al. MOZ-TIF2, but not BCR-ABL, confers properties of leukemic stem cells to committed murine hematopoietic progenitors.Cancer Cell6, 587–596 (2004).
38. Chomel, J. C. et al. Leukemic stem cell persistence in chronic myeloid leukemia patients with sustained undetectable molecular residual disease.
Blood118, 3657–3660 (2011).
39. Shah, N. P. et al. Multiple BCR-ABL kinase domain mutations confer polyclonal resistance to the tyrosine kinase inhibitor imatinib (STI571) in chronic phase and blast crisis chronic myeloid leukemia.Cancer Cell2, 117–125 (2002).
40. Giustacchini, A. et al. Single-cell transcriptomics uncovers distinct molecular signatures of stem cells in chronic myeloid leukemia.Nat. Med.23, 692–702 (2017).
41. Bosch, G. J., Joosten, A. M., Kessler, J. H., Melief, C. J. & Leeksma, O. C. Recognition of BCR-ABL positive leukemic blasts by human CD4+T cells
elicited by primary in vitro immunization with a BCR-ABL breakpoint peptide.Blood88, 3522–3527 (1996).
42. Yotnda, P. et al. Cytotoxic T cell response against the chimeric p210 BCR-ABL protein in patients with chronic myelogenous leukemia.J. Clin. Invest.101, 2290–2296 (1998).
43. Zhou, B. O. et al. Bone marrow adipocytes promote the regeneration of stem cells and haematopoiesis by secreting SCF.Nat. Cell Biol.19, 891–903 (2017). 44. Farina, A. et al. Bromodomain protein Brd4 binds to GTPase-activating
SPA-1, modulating its activity and subcellular localization.Mol. Cell. Biol.24, 9059–9069 (2004).
45. Crawford, N. P. et al. Bromodomain 4 activation predicts breast cancer survival.Proc. Natl Acad. Sci. USA105, 6380–6385 (2008).
46. Heldin, C. H. & Westermark, B. Mechanism of action and in vivo role of platelet-derived growth factor.Physiol. Rev.79, 1283–1316 (1999). 47. Ronnov-Jessen, L., Petersen, O. W. & Bissell, M. J. Cellular changes involved
in conversion of normal to malignant breast: importance of the stromal reaction.Physiol. Rev.76, 69–125 (1996).
48. Akhurst, R. J. TGF-beta antagonists: why suppress a tumor suppressor?J. Clin. Invest.109, 1533–1536 (2002).
49. Polanska, U. M. & Orimo, A. Carcinoma-associatedfibroblasts: non-neoplastic tumour-promoting mesenchymal cells.J. Cell. Physiol.228, 1651–1657 (2013).
50. Kuperwasser, C. et al. Reconstruction of functionally normal and malignant human breast tissues in mice.Proc. Natl Acad. Sci. USA101, 4966–4971 (2004).
51. Bhowmick, N. A. et al. TGF-beta signaling infibroblasts modulates the oncogenic potential of adjacent epithelia.Science303, 848–851 (2004). 52. Sato, Y. et al. Heterogeneousfibroblasts underlie age-dependent tertiary
lymphoid tissues in the kidney.JCI Insight1, e87680 (2016).
53. Wong, M. M. & Fish, E. N. Chemokines: attractive mediators of the immune response.Semin. Immunol.15, 5–14 (2003).
54. Klein, J. C. et al. Combined toll-like receptor 3/7/9 deficiency on host cells results in T-cell-dependent control of tumour growth.Nat. Commun.8, 14600 (2017).
55. Mlecnik, B. et al. Biomolecular network reconstruction identifies T-cell homing factors associated with survival in colorectal cancer.Gastroenterology
138, 1429–1440 (2010).
56. Galon, J. et al. Type, density, and location of immune cells within human colorectal tumors predict clinical outcome.Science313, 1960–1964 (2006). 57. Wang, S. F. et al. Development of Notch-dependent T-cell leukemia by
deregulated Rap1 signaling.Blood111, 2878–2886 (2008).
58. Kometani, K. et al. Role of SPA-1 in phenotypes of chronic myelogenous leukemia induced by BCR-ABL-expressing hematopoietic progenitors in a mouse model.Cancer Res.66, 9967–9976 (2006).
59. Sekai, M., Hamazaki, Y. & Minato, N. Medullary thymic epithelial stem cells maintain a functional thymus to ensure lifelong central T cell tolerance.
Immunity41, 753–761 (2014).
Acknowledgements
We thank Dr. R. Inagaki (Genome Research Institute, Sumitomo Dainippon Pharma Co., Ltd.) for helping with the data analysis of DNA microarray, Drs. Y. Hamazaki and M. Sekai (Center for iPS Research and Application, Kyoto University) for advising on immunostaining, and Dr. S. Morita (Graduate School of Medicine, Kyoto University) for helping statistic analysis. This work was supported by a grant-in-aid for Scientific Research on Innovative Areas, MEXT, Japan (to N.M.) and partly by Sumitomo Dai-nippon Pharma Co., Ltd.
Author contributions
Y.X. performed the majority of tumor experiments in vivo, BM immunostaining, and PCR analysis. S.I. performed the cellular and histochemical analysis of subcutaneous tumors. K.S. performed the cell depletion analysis in vivo and chemotactic assay. R.Y. performed the cell depletion analysis in vivo. H.T. performed leukemia experiments in vivo and the haptotaxis assay with MEFs. N.M. planned the overall experiments and wrote the paper.
Additional information
Supplementary Informationaccompanies this paper at
https://doi.org/10.1038/s41467-018-03307-8.
Competing interests:This work was supported in part by research funding from
Sumitomo Dainippon Pharma Co., Ltd.
Reprints and permissioninformation is available online athttp://npg.nature.com/
reprintsandpermissions/
Publisher's note:Springer Nature remains neutral with regard to jurisdictional claims in
published maps and institutional affiliations.
Open Access This article is licensed under a Creative Commons
Attribution 4.0 International License, which permits use, sharing, adaptation, distribution and reproduction in any medium or format, as long as you give appropriate credit to the original author(s) and the source, provide a link to the Creative Commons license, and indicate if changes were made. The images or other third party material in this article are included in the article’s Creative Commons license, unless indicated otherwise in a credit line to the material. If material is not included in the article’s Creative Commons license and your intended use is not permitted by statutory regulation or exceeds the permitted use, you will need to obtain permission directly from the copyright holder. To view a copy of this license, visithttp://creativecommons.org/ licenses/by/4.0/.