IAEA-TECDOC-1429
Worldwide marine radioactivity
studies (WOMARS)
Radionuclide levels in oceans and seas
Final report of a coordinated research project
January 2005
IAEA-TECDOC-1429
Worldwide marine radioactivity
studies (WOMARS)
Radionuclide levels in oceans and seas
Final report of a coordinated research project
The originating Section of this publication in the IAEA was: Radiometrics Laboratory
International Atomic Energy Agency Marine Environment Laboratory
B.P. 800
MC 98012 Monaco Cedex
WORLDWIDE MARINE RADIOACTIVITY STUDIES (WOMARS) RADIONUCLIDE LEVELS IN OCEANS AND SEAS
IAEA, VIENNA, 2004 IAEA-TECDOC-1429 ISBN 92–0–114904–2
ISSN 1011–4289
© IAEA, 2005
Printed by the IAEA in Austria January 2005
FOREWORD
The International Atomic Energy Agency's Marine Environment Laboratory in Monaco has completed a four year Coordinated Research Project (CRP) on Worldwide Marine Radioactivity Studies (WOMARS). The primary objective of the CRP was to develop an understanding of the present open ocean distribution of radionuclides in the water column and sediment and thus predict the radiological impact to be addressed, as well as to encourage and support marine radioactivity studies in Member States by methodological assistance and total analytical quality management. The project was designed with the intention of reviewing and contributing to scientific knowledge of the processes which affect radionuclide distributions and the sources which have introduced radionuclides to the world ocean.
The specific objectives of the CRP were to: identify the major sources of anthropogenic radionuclides in the world ocean; develop present knowledge of the distributions of key radionuclides (90Sr, 137Cs and 239,240Pu) in water and sediment of the world ocean; and study the development of radionuclide concentrations in water with time using good quality historical data (e.g. from the GEOSECS programme of the mid-1970s and new data sets collected recently).
Two research coordination meetings were held (IAEA-MEL Monaco, 1999; Woods Hole Oceanographic Institution, Woods Hole, USA, 2000) during which the objectives of the CRP, the organization, data compilation, evaluation and synthesis were discussed. The presentations and discussions covered both the development of average radionuclide concentrations in surface water and in water profiles over the last twenty years. A. Aarkrog of Denmark chaired the Research Co-ordination Meetings. The Scientific Secretary was P. P. Povinec.
The topics covered were: Atlantic and Indian Oceans and their marginal seas (Working Group 1); Pacific Ocean and its marginal seas (Working Group 2); Marine Processes (Working Group 3).
The success of the CRP was due to the active collaboration of the chief scientific investigators and the participating institutions as well as numerous other marine institutions which provided radionuclide data for storage and evaluation for the project in the framework of the development of the IAEA's Global Marine Radioactivity Database (GLOMARD). The IAEA would like to express its gratitude for the information provided and for the very fruitful cooperation.
The IAEA officer responsible for this publication was P.P. Povinec of the IAEA Marine Environment Laboratory, Monaco.
EDITORIAL NOTE
The use of particular designations of countries or territories does not imply any judgement by the publisher, the IAEA, as to the legal status of such countries or territories, of their authorities and institutions or of the delimitation of their boundaries.
The mention of names of specific companies or products (whether or not indicated as registered) does not imply any intention to infringe proprietary rights, nor should it be construed as an endorsement or recommendation on the part of the IAEA.
CONTENTS
SUMMARY ... 1
1. INTRODUCTION ... 3
2. INPUT OF ANTHROPOGENIC RADIONUCLIDES INTO THE WORLD OCEAN ... 5
2.1. Nuclear weapons testing ... 5
2.2. Nuclear reprocessing ... 9
2.3. The Chernobyl accident ... 9
2.4. Other nuclear accidents ... 13
2.5. Sea dumping ... 13
2.6. Use of radioisotopes ... 14
2.7. Hypothetical and potential inputs ... 14
2.8. River runoff ... 14
2.9. Summary of inputs ... 15
3. PROCESSES AFFECTING RADIONUCLIDE CONCENTRATIONS AND INVENTORIES IN THE OCEANS ... 16
3.1. Radionuclides as oceanographic tracers ... 16
3.2. Fate of conservative vs. particle-reactive radionuclides ... 19
3.3. Variations in activity ratios ... 20
3.4. Variations in inventory ... 20
4. PACIFIC OCEAN ... 23
4.1. Overview ... 23
4.2. Radionuclides in the Pacific Ocean ... 24
4.3. Distribution of radionuclides in surface water and sediment ... 29
4.3.1. Surface water ... 29
4.3.2. Sediment ... 30
4.4. Surface water radionuclide time series ... 36
4.5. Water column radionuclide time series ... 53
4.6. Radionuclide inventories ... 64
4.6.1. Water inventories ... 64
4.6.2. Sediment inventories ... 64
4.7. Radionuclides in the Far Eastern Seas ... 73
4.7.1. Sea of Japan ... 73
4.7.2. The Sea of Okhotsk ... 76
4.7.3. The Yellow and East China Seas ... 76
5. INDIAN AND SOUTHERN OCEANS ... 82
5.1. Radionuclides in surface water... 82
5.2. Surface water radionuclide time series ... 83
5.3. Radionuclides in the water column ... 84
6. ATLANTIC AND ARCTIC OCEANS ... 97
6.1. Surface water radionuclide time series in the Atlantic Ocean... 98
6.2. Water column radionuclide time series in the Atlantic Ocean ... 105
6.3. Inventories of 90Sr and 137Cs in the NE Atlantic ... 105
6.4. Radionuclides in northern European seas... 106
6.4.1. The Irish Sea ... 124
6.4.2. The North Sea ... 124
6.4.3. The Baltic Sea... 125
6.4.4. The Arctic Seas... 125
6.5. Radionuclides in the Mediterranean Sea ... 128
6.5.1. Surface water radionuclide time series ... 129
6.5.2. Recent data on 137Cs and 239,240Pu in the water column of the Mediterranean Sea ... 131
6.5.3. Water column radionuclide time series ... 133
6.5.4. Radionuclide inventories in the water column of the Mediterranean Sea ... 133
6.5.5. Radionuclide inventories in the deep Mediterranean Sea... 137
7. CONCLUSIONS ... 137
REFERENCES... 145
ANNEX I. TRANSFER COEFFICIENTS FOR 90Sr AND 137Cs FOR DOSE CALCULATIONS ... 153
ANNEX II. LIST OF PUBLICATIONS PUBLISHED BY THE IAEA-MEL/RML STAFF ON WORLDWIDE MARINE RADIOACTIVITY STUDIES ... 159
ANNEX III. 137Cs, 90Sr AND 239,240 Pu BIBLIOGRAPHY FOR THE PACIFIC AND INDIAN OCEANS ... 163
CONTRIBUTORS TO DRAFTING AND REVIEW ... 187
SUMMARY
This publication summarizes the results of the Coordinated Research Project (CRP) on Worldwide Marine Radioactivity Studies (WOMARS) carried out by the IAEA's Marine Environment Laboratory in Monaco. It provides the most comprehensive information on levels of anthropogenic radionuclides in the world ocean. Three anthropogenic radionuclides
— 90Sr, 137Cs and 239,240Pu were chosen as the most representative of anthropogenic radioactivity in the marine environment, comprising beta-, gamma- and alpha-emitters which have the highest potential contribution to radiation doses to humans via seafood consumption. Although the ocean contains the majority of the anthropogenic radionuclides released into the environment, the radiological impact of this contamination is low. Radiation doses from naturally-occurring radionuclides in the marine environment (e.g. 210Po) are on the average two orders of magnitude higher.
The results confirm that the dominant source of anthropogenic radionuclides in the marine environment is global fallout. The total 137Cs input from global fallout was estimated to be 311 PBq for the Pacific Ocean, 201 PBq for the Atlantic Ocean, 84 PBq for the Indian Ocean and 7.4 PBq for the Arctic Ocean. For comparison, 5 about 40 PBq of 137Cs was released to the marine environment from Sellafield and Cap de la Hague reprocessing plants. The Chernobyl accident contributed about 16 PBq of 137Cs to the sea, mainly the Baltic and Black Seas, where the present average concentrations of 137Cs in surface water were estimated to be about 60 and 25 Bq/m3, respectively, while the worldwide average concentration due to global fallout is about 2 Bq/m3.
For the purposes of this study, the world ocean was divided into latitudinal belts for which average radionuclide concentrations were estimated. Further, where available, time trends in radionuclide concentrations in surface water were studied and mean residence times of radionuclides in these areas as well as in the world ocean were estimated. The results confirm similar mean residence times for 90Sr and 137Cs in surface water, 28 ± 3 years and 13 ± 1 year for 239,240Pu.
Changes in radionuclide concentrations in water profiles with time in the North Atlantic and Pacific Oceans were also studied. A clear decrease of radionuclide concentrations in surface water was observed due to transport of radionuclides to medium water depths.
The results obtained in the framework of the WOMARS CRP provide the most complete data set available to Member States on levels of anthropogenic radionuclides in the marine environment. The results will be used as the international reference source on the average levels of anthropogenic radionuclides in the marine environment so that any further contributions from nuclear reprocessing plants, radioactive waste disposal sites, nuclear bomb test sites and possible nuclear accidents can be identified.
1. INTRODUCTION
Radionuclides have been released to the environment from a multiplicity of sources, both planned and accidental. Given that more than 70% of the surface of the Earth is ocean, it is not surprising that much of these releases now reside there. The largest ocean, the Pacific, has been a major repository for these releases — in part because of its sheer size, and in part due to localized releases there.
There has been a growing number of known sources of anthropogenic radionuclides in the marine environment. They include global nuclear fallout following atmospheric weapons tests, the Chernobyl accident, discharges of radionuclides from nuclear installations, dumping of nuclear wastes into the world's oceans and seas, nuclear submarine accidents, contributions from nuclear weapons tests sites, loss of nuclear weapons and radioactive sources, and satellite burnup.
Due to variations in the source inputs and subsequent dispersion, mixing and transport of radionuclides in the world's oceans and seas, the marine environment is labelled with radionuclides differing from one region to another according to the predominant source there.
The main global source of radionuclides in the marine environment is fallout from nuclear tests performed in the atmosphere. In some regions, like the Irish, Baltic and Black Seas, the concentration of 137Cs in the marine environment depends on the input due to discharges from reprocessing facilities and from the Chernobyl accident, and in these regions the evolution of its concentration is quite dynamic.
The interest in, and relevance of knowledge of the behaviour of radionuclides in the ocean derives from a variety of issues. Firstly, the fate of radionuclides needs to be well understood to provide the basis for an assessment of adverse environmental or human health consequences, real or perceived. Then, this accumulated knowledge provides a critical basis for rapid assessment of the impact of future releases — especially unplanned ones. These include accidents involving radionuclide releases from such sources as coastal nuclear facilities, nuclear waste disposal sites or from maritime transport of nuclear fuel or nuclear wastes. Finally, radionuclides are powerful tracers providing basic insights into a variety of oceanic processes. For example, plutonium as a particle active radio-element, is readily incorporated into several compartments of the ocean carbon cycle. Because of the relatively well defined temporal and spatial aspects of its introduction to the ocean, its movement within the ocean provides many insights into a large number of processes in the oceanic water column, and in biological and sedimentary systems.
Assessment of marine radioactivity in a given region therefore requires knowledge of the source terms and an understanding of oceanic processes. The deposition of radionuclides from these sources is unevenly distributed over the world ocean. The input function of global fallout in the world ocean, mainly due to nuclear weapons tests carried out in the sixties, can be estimated from worldwide monitoring mainly performed on land. On the other hand, discharges from nuclear fuel reprocessing plants or dumping of liquid and solid radioactive wastes have generally had a more local character, although soluble radionuclides have been transported over long distances by prevailing currents.
In order to estimate radionuclide inputs from local sources, radionuclide distributions in the world’s oceans and seas must be better known so that results from scientific expeditions to nuclear waste dumping sites and/or other sources of anthropogenic marine radioactivity can be reviewed objectively, comparatively and comprehensively. This requires a detailed study
of the present distributions and inventories of the main radionuclides of interest (3H, 14C, 90Sr,
137Cs and Pu isotopes) in the world’s oceans and seas as well as possible predictions of their concentrations in the near future.
As a contribution to these investigations, in 1995 the International Atomic Energy Agency’s Marine Environment Laboratory (IAEA-MEL) commenced a seven year project
"Research on Worldwide Marine Radioactivity" with the generous support of the Science and Technology Agency (STA) of the Government of Japan. As part of this project a four year (1998–2001) Coordinated Research Project (CRP) entitled "Worldwide Marine Radioactivity Studies (WOMARS)" was carried out.
The objectives of the CRP were to :
(i) Identify the major sources of anthropogenic radionuclides in the world ocean, (ii) Develop present knowledge of the distributions of key radionuclides (90Sr, 137Cs
and Pu isotopes) in water and sediment of the world ocean,
(iii) Study the development of radionuclide concentrations in water with time using good quality historical data (e.g. from the GEOSECS programme of the mid-1970s and new data sets collected recently).
The main aim of the CRP was to develop an understanding of the present open ocean distribution of radionuclides in the water column and sediment and thus predict the radiological impact to be addressed. Further, to encourage and support marine radioactivity studies in Member States by methodological assistance and total analytical control management. The project was designed to review and contribute to scientific knowledge of the processes affecting radionuclide distributions and the sources which have introduced radionuclides to the world ocean.
Three anthropogenic radionuclides (90Sr, 137Cs and 239,240Pu) were chosen as the most important and radiologically typical for beta-, gamma- and alpha-emitters. They are the most abundant anthropogenic radionuclides of each class present in the marine environment and can lead to the highest radiation doses to humans and marine biota.
In this publication, the state of knowledge of the distribution and behaviour of radionuclides in the world ocean and indications of the changes which have evolved over time are discussed. It will not constitute a comprehensive review of all studies involving radionuclides in the ocean but will try to cover the most relevant aspects. The studies cited generally provide reference to a related work and thus fuller details should be sought in the quite large literature base on this topic.
The CRP participants collected large amounts of data from their respective regions of interest as well as from other regions, consideration being given to the entire coverage of the oceans of the world. In addition, specific tasks were assigned to collect information from countries not participating in the CRP so that these data could also be included in the Global Marine Radioactivity Database (GLOMARD), which is under development in the Radiometrics Laboratory at IAEA-MEL.
The information collected is of high scientific value and represents a reference source on average radionuclide levels in the marine environment. The present report summarizes the results obtained in the framework of the CRP.
4
2. INPUT OF ANTHROPOGENIC RADIONUCLIDES INTO THE WORLD OCEAN
The world ocean covers an area of 361.11·106 km2 or 70.8% of the total surface of the Earth [1]. Hence, the ocean is a major recipient of anthropogenic radionuclides released to the environment by atmospheric as well as aquatic pathways.
The oceans may receive radioactive fallout directly from the atmosphere and indirectly as runoff from rivers. Radionuclides may, however, also be discharged directly into the ocean as liquid waste or from dumped solid wastes. Some radionuclides will behave conservatively and stay in the water in soluble form, whereas others will be insoluble or adhere to particles and thus, sooner or later, be transferred to marine sediments.
The three main sources of anthropogenic radionuclides are nuclear weapons testing in the atmosphere, the Chernobyl accident and water-borne discharges from nuclear reprocessing plants, notably Sellafield in the UK and Cap de la Hague in France [2]. Other sources e.g. sea dumping of nuclear waste, routine discharges from nuclear power plants, sunken nuclear submarines, satellite losses, lost nuclear weapons and the use of radioisotopes in medicine, industry and science, contribute orders of magnitude less to the contamination of the world ocean than the three major sources.
The aim of this chapter is, on the basis of the most recent information [2] to present an estimate of the input of anthropogenic radionuclides to the world ocean, and to calculate the inventories of these radionuclides as of the year 2000. As 90Sr and in particular 137Cs are the main contributors to the present radiation doses from man-made sources in the environment [3], the focus is on these two radionuclides.
2.1. Nuclear weapons testing
Atmospheric nuclear test explosions have contaminated the Earth globally with radioactive debris. The weapons tested from 1945 to 1951 were fission weapons in the 20– 100 kilotons TNT range. They produced mainly tropospheric fallout, i.e. the debris remained below the tropopause and was not dispersed globally, but was deposited around the latitude band of the test site. However, in 1952 the United States and in 1953 the former Soviet Union (FSU) tested their first thermonuclear devices (megatons TNT range) and fallout from these explosions occurred worldwide. In the following years and up until the early sixties the major inputs of radionuclides from nuclear weapons testing occurred at Novaya Zemlya Island in the Arctic Ocean (80.89 Mt fission yield) and at Bikini Atoll in the Pacific Ocean (42.2 Mt fission yield). Other important locations in this respect have been Enewetak and Johnston Atolls in the North Pacific (26 Mt), Christmas Island in the Indian Ocean (15.5 Mt), Lop Nor in China (12.2 Mt), Mururoa and Fangataufa Atolls in the South Pacific (6.1 Mt) and Semipalatinsk in Kazakhstan (3.7 Mt).
The distribution of global fallout (based on data from [2]) is shown in Fig. 1. The data are from a worldwide network of land-based measuring stations for 90Sr in fallout. The global fallout pattern first of all reflects the atmospheric transport of debris from the stratosphere to the troposphere with maximum transfer at the mid-latitudes. The global precipitation pattern and the locations of the test sites also influence the global distribution of weapons fallout. The significantly lower amount of fallout in the Southern hemisphere is due to the relatively low number of test explosions there, but also to the limited atmospheric exchange between the northern and southern stratospheres.
90 80 70 60 50 40 30 20 10 0 10 20 30 40 50 60 70 80 90
Northern hemisphere Southern hemisphere
0 0.5 1 1.5 2 2.5 3 3.5
kBq/m²
FIG. 1. Integrated deposition density of 90Sr (kBq/m2) (cumulative deposition is 0.40 x integrated in 2000) [2].
Table I shows the inputs of 90Sr and 137Cs from global fallout to the various parts of the world ocean based on fallout over land. The 137Cs data were obtained from 90Sr data by multiplying by 1.6 [2]. The deposition densities (Bq/m2) in the various latitude bands were from [2] and the ocean areas were obtained from [1]. Figure 2 shows the relative input of 90Sr from global fallout to the various parts of the world ocean. The relative areas of the four oceans compared to the total area of the world ocean are for the Pacific, Atlantic, Indian and Arctic Oceans: 50%, 26%, 20% and 4%, respectively. Hence, the Indian and Arctic Oceans have received less input of 90Sr from global fallout than could be expected from their respective areas, whereas the Atlantic has received about 25% more than expected. The discrepancies are explained by the lower fallout to the Arctic and Southern hemisphere than to the temperate regions of the Northern hemisphere (see also Fig. 3 where the latitudinal distribution of 90Sr input in PBq is shown). In this context it should be noted that present radionuclide inventories in the Arctic Ocean are higher than those expected from direct input due to transport from temperate latitudes in the North Atlantic via the Norwegian Coastal Current.
In order to obtain the actual (year 2000) inventories in the world ocean, the values in Table I should be decay-corrected by a factor of 0.40. The same decay factor has been used for both 90Sr and 137Cs.
UNSCEAR [2] has, based on the fission yields of the nuclear weapons tested, reported the global release (PBq) of those radionuclides which have been globally dispersed in atmospheric nuclear testing. Table II shows those still present in the environment.
6
TABLE I. INPUTS FROM GLOBAL FALLOUT (PBq)
Summary of 90Sr input to the world ocean from global fallout
Latitude Arctic Atlantic Indian Pacific Total Ocean area 1012m2
Ocean Ocean Ocean Ocean
N 90º-60º 4.6 10.2 0.0 1.3 16.1 17.2
N 60º-30º 0.0 57.3 0.0 71.6 128.9 46.8 N 30º-0º 0.0 30.8 13.3 65.8 109.9 90.6 S 0º-30º 0.0 10.3 14.6 26.6 51.5 98.0 S 30º-60º 0.0 15.4 22.5 25.8 63.7 88.2
S 60º-90º 0.0 1.7 2.1 3 6.8 20.4
Total 4.6 125.7 52.5 194.1 376.9 361.1
Summary of 137Cs input to the world ocean from global fallout N 90º-60º 7.4 16.3 0.0 2.1 25.8 N 60º-30º 0.0 91.7 0.0 114.6 206.2 N 30º-0º 0.0 49.3 21.3 105.3 175.8
S 0º-30º 0.0 16.5 23.4 42.6 82.4
S 30º-60º 0.0 24.6 36.0 41.3 101.9 S 60º-90º 0.0 2.7 3.4 4.8 10.9
Total 7.4 201.1 84.0 310.6 603.0
A rc tic 1 %
A tla n tic 3 3 %
In d ia n 1 4 % P a c ific
5 2 %
FIG. 2. Relative input of 90Sr from global fallout to the world ocean.
The inputs to the ocean for 90Sr and 137Cs were taken from Table I. The other radionuclides were calculated from 90Sr and their release ratios to 90Sr. As 241Pu decays to 241Am with a half-life of 14.35 years, most of the 241Pu deposited in the ocean (and elsewhere) has already decayed to 241Am.
FIG. 3. Input of 90Sr from global fallout to the ocean.
TABLE II. GLOBAL FALLOUT RADIONUCLIDES STILL PRESENT IN PBq- QUANTITIES IN THE YEAR 2000
Nuclide Half-life
(year)
Global release (PBq)
Release ratio to
90Sr
Input to ocean (PBq)
Ocean inventory
2000 (PBq)
3H 12.33 186000 299 112693 13300
14C 5730 213 0.3424 129 128
90Sr 28.78 622 1 377 151
137Cs 30.07 948 1.52 603 251
239Pu 24110 6.52 0.0105 4.0 4.0
240Pu 6563 4.35 0.007 2.6 2.6
241Pu 14.35 142 0.2283 86 13.7
According to [2] the total fission yield of atmospheric nuclear test explosions is 189 Mt (TNT). The production estimate of 90Sr is 3.88 PBq Mt-1. Hence, the total production of 90Sr from nuclear weapons testing in the atmosphere is 733 PBq. However, 29 Mt (corresponding to 113 PBq 90Sr) were not globally dispersed, but were deposited as local fallout close to the test sites. Hence, only 160 Mt or 622 PBq 90Sr became global fallout. Since about 2–3% of
90Sr decayed before deposition, the total amount deposited is calculated to be 605 PBq 90Sr. From measurements of the global deposition of 90Sr (Fig. 1), the global input from nuclear weapons testing in the atmosphere is calculated to be 604 PBq 90Sr. It may thus be concluded that measurements and calculations from fission yields agree.
As nearly all local fallout (28 Mt fission) occurred at the US test sites at Bikini and Enewetak Atolls in the Pacific Ocean (0–30˚N latitude belt), it is assumed that this part of the Pacific Ocean may have received about 113 PBq 90Sr besides the 66 PBq 90Sr (see Table I) received from global fallout. However, the 113 PBq may not be fully dispersed in sea water as some of it is imbedded in minerals (corals). Hence, it is difficult to estimate to what extent the inventory of 90Sr in the world ocean has increased from this source. It is even more difficult to
0 20 40 60 80 100 120 140
N 90- N 60- N 30-0 S 0-30 S 30- S 60-
PBq
8
estimate the contribution from local fallout for the other radionuclides mentioned in Table II. Only actual environmental measurements in this part of the Pacific Ocean can give an indication of the possible contamination to the world ocean from local fallout at Bikini and Enewetak.
Local fallout from the Novaya Zemlya test site has probably not contributed significantly to the radionuclide inventories in the ocean. According to [2], the debris from these tests went almost entirely (96%) to the stratosphere. Less than 0.5% was distributed as local and regional fallout and the remaining part was deposited as tropospheric fallout.
2.2. Nuclear reprocessing
Reprocessing is carried out to recover U and Pu from spent fuel for reuse in reactors. The major reprocessing plants are in the United Kingdom (Sellafield), France (Cap de La Hague) and Japan (Tokai). Sellafield has been the major source of radioactive contamination of the marine environment. In the 1970s British Nuclear Fuel Ltd., Sellafield (earlier Windscale), began to substantially increase its authorized water-borne radioactive discharges to the Irish Sea. These discharges, first of all of 137Cs, but also other radionuclides, notably plutonium isotopes, americium and technetium, have become measurable in most parts of the NE Atlantic and to a large extent in the Arctic Ocean. Table III and Figs 4 and 5 show the annual liquid discharges of 137Cs and 90Sr from Sellafield and Cap de La Hague, respectively. Furthermore, the decay-corrected amounts (to year 2000) are shown. While the 90Sr discharges from Cap de la Hague amounted to 20% of those from Sellafield, the discharges of
137Cs were less than 3% of the corresponding Sellafield releases. Apart from the 40 PBq 137Cs and 6.5 PBq 90Sr released from the two European reprocessing plants, 126 PBq 3H, 1 PBq
99Tc and 0.015 PBq 129I contribute to the contamination of the ocean at present and the NE Atlantic (30-90°N) in particular. Whereas the input of 3H from reprocessing is negligible compared with that from global fallout (see Table II), Sellafield and La Hague are major sources to the oceanic inventories of 99Tc and 129I. These two very long lived radionuclides (half-lives: 213,000 and 1,570,000 years, respectively) will remain in the marine environment long after all the other radionuclides mentioned in this context (Table II) have disappeared. 2.3. The Chernobyl accident
Approximately two thirds of the ~100 PBq 137Cs released by the Chernobyl accident in 1986 were deposited outside the former Soviet Union [4]. Although most of this activity fell over land, a significant part went to the sea. In particular, the European marginal seas received a substantial amount of the Chernobyl debris. The Baltic Sea was the most contaminated. The total inventory from the accident was calculated to be 4.5 PBq 137Cs [5]. Since Chernobyl, the Baltic Sea has been a main source of fresh inflow of 137Cs to the NE Atlantic Ocean.
The Black Sea received 2–3 PBq 137Cs from the Chernobyl accident [6]. The outflow from the Black Sea is the main source of “new” 137Cs in the Mediterranean Sea. However, the inflow is less than the decay of the present 137Cs Chernobyl Mediterranean Sea inventory of 3–5 PBq. The Mediterranean Sea also received direct fallout from the accident. From German and British measurements it has been estimated [7], that the North Sea received 1.2 PBq 137Cs from Chernobyl. The Chernobyl inventory in the NE Atlantic was estimated at about 6 PBq
137Cs. In the summer of 1987, surface sea water samples collected in the Greenland, Norwegian and Barents Seas and off the west coast of Norway and the Faroe Islands, all contained Chernobyl-derived 137Cs.
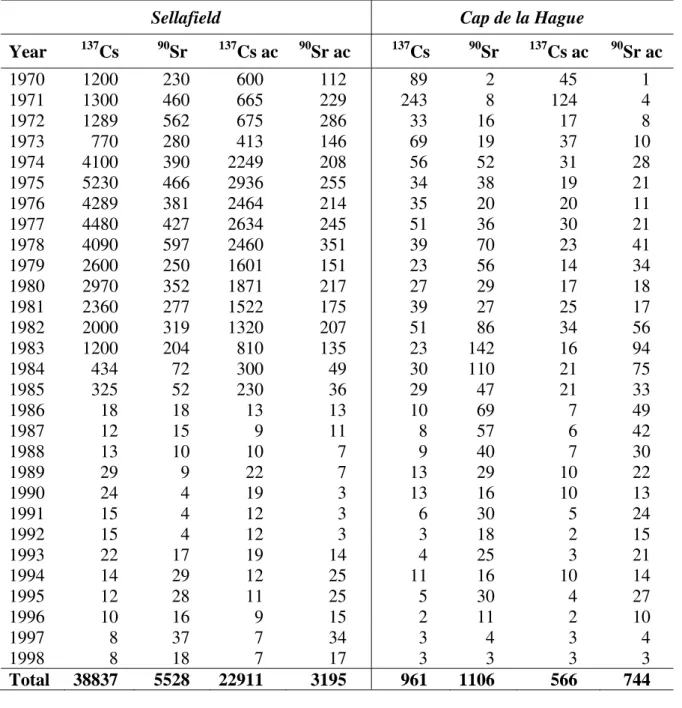
TABLE III. RADIOACTIVE DISCHARGES FROM SELLAFIELD AND CAP DE LA HAGUE, 1970–1998 IN TBq
Sellafield Cap de la Hague
Year 137Cs 90Sr 137Cs ac 90Sr ac 137Cs 90Sr 137Cs ac 90Sr ac
1970 1200 230 600 112 89 2 45 1
1971 1300 460 665 229 243 8 124 4
1972 1289 562 675 286 33 16 17 8
1973 770 280 413 146 69 19 37 10
1974 4100 390 2249 208 56 52 31 28
1975 5230 466 2936 255 34 38 19 21
1976 4289 381 2464 214 35 20 20 11
1977 4480 427 2634 245 51 36 30 21
1978 4090 597 2460 351 39 70 23 41
1979 2600 250 1601 151 23 56 14 34
1980 2970 352 1871 217 27 29 17 18
1981 2360 277 1522 175 39 27 25 17
1982 2000 319 1320 207 51 86 34 56
1983 1200 204 810 135 23 142 16 94
1984 434 72 300 49 30 110 21 75 1985 325 52 230 36 29 47 21 33 1986 18 18 13 13 10 69 7 49 1987 12 15 9 11 8 57 6 42 1988 13 10 10 7 9 40 7 30 1989 29 9 22 7 13 29 10 22 1990 24 4 19 3 13 16 10 13 1991 15 4 12 3 6 30 5 24 1992 15 4 12 3 3 18 2 15 1993 22 17 19 14 4 25 3 21 1994 14 29 12 25 11 16 10 14 1995 12 28 11 25 5 30 4 27 1996 10 16 9 15 2 11 2 10
1997 8 37 7 34 3 4 3 4
1998 8 18 7 17 3 3 3 3
Total 38837 5528 22911 3195 961 1106 566 744 Note: ac is the actual activity by the year 2000.
The total Chernobyl 137Cs input to the world ocean is estimated at about 16 PBq. It has been assumed here that the input of 90Sr to the sea was negligible. The inputs of 137Cs were estimated at 10 PBq in the 30–60˚N latitude belt and at 6 PBq in the 60–90˚N belt. Nearly all
137Cs went to the N Atlantic and Arctic Oceans. The relative input to the ocean thus became significantly less than that from nuclear weapons fallout, because the Chernobyl accident was a tropospheric event, first of all contaminating the surrounding European land areas.
10
Radioactive discharges from Sellafield, 1986-1998 in TBq
0 5 10 15 20 25 30 35 40
1986 1987 1988 1989 1990 1991 1992 1993 1994 1995 1996 1997 1998 Years
Total Activity (TBq)
0 500 1000 1500 2000 2500 3000 3500 4000 4500 5000 5500
1970 1972 1974 1976 1978 1980 1982 1984 1986 1988 1990 1992 1994 1996 1998
Total Activity (TBq)
Strontium 90 Caesium 137
FIG.4. Radioactive discharges from Sellafield, 1986-1998 in TBq.
11
FIG. 5. Radioactive discharges from Cap de la Hague, 1970–1998 in TBq.
0 20 40 60 80 100 120 140 160 180 200 220 240 260
1970 1971 1972 1973 1974 1975 1976 1977 1978 1979 1980 1981 1982 1983 1984 1985 1986 1987 1988 1989 1990 1991 1992 1993 1994 1995 1996 1997 1998
Years
Total Activity (TBq)
Strontium 90 Caesium 137
12
2.4. Other nuclear accidents
A few nuclear accidents have released radionuclides directly into the sea. Most accidents have, however, involved releases to the atmosphere. The marine environment has thus received only indirect contamination either from atmospheric deposition or through runoff from land.
The two major nuclear accidents in 1957, Kyshtym and Windscale, are not believed to have contributed significantly to the contamination of the marine environment.
In 1968 a US B-52 aircraft crashed during an emergency landing on sea-ice 11 km west of Thule Airbase in NW Greenland. A similar accident had occurred two years previously at Palomares in SE Spain [8], but the radioactive debris from that accident had mainly been deposited on land. At Thule, the marine environment became contaminated with about 1 TBq
239,240Pu [9].
A number of nuclear submarines, American as well as Russian, have been lost in the world ocean. The most recent loss was the Russian submarine "Kursk" in the Barents Sea in August 2000. This submarine was recovered in 2001 and no contamination of the sea occurred. Another loss was the Soviet "Komsomolets" submarine, which sank at a depth of 1700 m at Bear Island in the eastern part of the Norwegian Sea. The activity in the wreck is estimated at 2.8 PBq 90Sr and 3 PBq 137Cs, and the nuclear warheads may contain 16 TBq
239,240Pu [10]. Close to the "Komsomolets", slightly enhanced levels of 137Cs have been measured in sea water, but the sunken nuclear submarines may be considered only as potential sources to radioactive contamination of the ocean.
Some satellites are nuclear powered. On a few occasions such satellites have burned up in the upper atmosphere and have thereby contributed to the contamination of the ocean. This was the case in 1964 when a SNAP-9A nuclear power generator aboard a US satellite re- entered the atmosphere in the Southern hemisphere [11]. The generator contained 0.6 PBq
238Pu. Since the accident, seawater samples from the Southern hemisphere have shown an enhanced 238Pu/239,240Pu ratio, compared to ocean water from the Northern hemisphere.
2.5. Sea dumping
Sea dumping in the western world was carried out on a national basis, from the late 1940s to the mid-1960s, mainly by the US in the Atlantic and Pacific Oceans and by the UK in the NE Atlantic. In 1967, the European Nuclear Energy Agency (later NEA) organized an international operation where about 0.3 PBq solid waste was deposited at a depth of 5 km in the eastern Atlantic Ocean. Similar international operations continued until 1982. At that time about 0.7 PBq α activity, 42 PBq β activity and 15 PBq tritium had been dumped in the N Atlantic [7, 12]. The Coordinated Research and Environmental Surveillance Programme Related to Sea Disposal of Radioactive Waste "CRESP" has assessed the radiological impact of the NEA dumping activities [13]. Minor releases of Pu from the dumped waste have been measured at the dumpsite.
The former Soviet Union (FSU) disposed of radioactive waste for over three decades in the Kara and Barents Seas. The total amount of waste dumped in the Arctic Seas was estimated to be approximately 90 PBq [14]. The International Arctic Seas Assessment Project (IASAP) study [15] has estimated that the inventory in 1993/94 had decayed to 4.7 PBq. Monitoring has shown [10], that the releases from the dumping sites are small. Model calculations have demonstrated that the total collective dose over the next 1000 years to the
world's population from the Russian dumpsite is in the order of 10 man Sv [15]. This is 300 times less than the corresponding dose from the radioactive waste dumped in the NE Atlantic [13].
2.6. Use of radioisotopes
Radioisotopes are used in medicine, industry and research. Those most widely used as unsealed sources are usually short lived, e.g. 99mTc and 131I and are thus of no importance as sources to worldwide marine contamination. Hence, although the global usage of 131I in nuclear therapy is approximately 0.6 PBq, it does not result in a measurable inventory in the world ocean.
Longer lived radionuclides such as 3H and 14C are used in research, but releases to the environment are very low and compared to the oceanic inventories from global fallout, of no significance.
2.7. Hypothetical and potential inputs
During 1949–1951, medium and low level liquid radioactive waste from the Soviet nuclear establishment, Mayak in the South Urals was released into the Techa River. In total 100 PBq were discharged. 90Sr and 137Cs contributed 11.6% and 12.2%, respectively [16]. Most of the activity was retained in a cascade of reservoirs in the upper reaches of the Techa River, which is part of the Ob River system. Although the distance from Mayak to the outlet of the Ob River in the Arctic Ocean is about 2000 km, it cannot be ruled out that 90Sr which is more mobile than 137Cs, may have reached the Arctic Ocean around 1950. The contamination may be estimated to be in the order of 1 PBq [17].
Since 1951, Lake Karachay at Mayak has been used for disposal of radioactive waste. The lake has received 3.6 EBq 137Cs and 0.74 EBq 90Sr [18]. Lake Karachay is a potential source for future contamination of the Ob River system and thus of the Arctic Ocean. The Krasnoyarsk Mining and Chemical Complex is another hypothetical source to radioactive contamination of the Arctic Ocean. Other nuclear installations in the FSU (and elsewhere) should also be kept in mind in this context. In e.g. Murmansk and Vladivostok, radioactive waste is stored in the military naval bases and at remote locations, also along the Siberian coastline lighthouses are powered by 90Sr generators. Each generator contains in the order of 10 PBq 90Sr and in the event of an accident is a potential source of environmental contamination. A 90Sr generator was lost in the Sea of Okhotsk, but no contamination has been reported.
2.8. River runoff
Radionuclides deposited in the terrestrial environment may be transported to groundwater, lakes and rivers, and later to the sea. Runoff is thus a secondary transfer of atmospheric radioactivity to the sea. About 9% of the 90Sr inventory on land will be removed by runoff [19]. For 137Cs the figure is about 2% [20].
As the total deposits of global fallout 90Sr and 137Cs are 622 PBq and 948 PBq, respectively, and as 377 PBq 90Sr and 603 PBq 137Cs were deposited in the sea, the terrestrial input has been 245 PBq 90Sr and 345 PBq 137Cs. Furthermore, the total deposition from Chernobyl was ~10 PBq 90Sr and ~85 PBq 137Cs [2]. Of this, 10 PBq 90Sr and 69 PBq 137Cs fell over land.
14
The global runoff of 90Sr is thus calculated as: 0.09(245+10) 23 PBq and that of 137Cs becomes: 0.02(345+69) = 8 PBq. By the year 2000 these inputs would have decayed to about 9 PBq 90Sr and 3 PBq 137Cs. In other words runoff may increase the 90Sr inventory in the world ocean by 6% and the 137Cs inventory by 1–2%, which is insignificant when other uncertainties are taken into consideration. Furthermore, radionuclides transported by runoff will often be bound to particulates and thus be sedimented rather than transferred to biota. Hence, runoff is not believed to influence the marine pathway ingestion doses to man significantly.
2.9. Summary of inputs
The total input from all sources of 90Sr to the world ocean has been 383 PBq (377 PBq from global fallout and 6.5 PBq from reprocessing). The input of 137Cs was 659 PBq (604 PBq from fallout, 40 PBq from reprocessing plants) and 16 PBq from Chernobyl. To these figures should be added local inputs in the equatorial N Pacific, which may be in the order of 100 PBq for each of the two radionuclides. Table IV summarizes the present (year 2000) inventories of 90Sr, 137Cs and 239,240Pu in the world ocean from all major sources, including local fallout.
TABLE IV. RADIONUCLIDE INVENTORIES IN THE YEAR 2000 IN THE WORLD OCEAN (PBq)
Arctic & Atlantic Oceans Indian & Pacific Oceans
World
Latitude Global fallout
Local fallout
Repro- cessing
Chernoby l
Subtotal Global fallout
Local fallout
Subtotal ALL SOURCE
S
90Sr
N 90º-30º 28.8 0.0 3.9 0.0 32.7 29.2 0.0 29.2 61.9 N 30º-0º 12.3 0.0 0.0 0.0 12.3 31.6 22.5 54.1 66.5 S 0º-30º 4.1 0.0 0.0 0.0 4.1 16.5 22.5 39.0 43.1 S 30º-90º 6.8 0.0 0.0 0.0 6.8 21.4 0.0 21.4 28.2 TOTAL 52.1 0.0 3.9 0.0 56.0 98.6 45.0 143.6 199.7
137Cs
N 90º-30º 46.1 0.0 23.5 11.5 81.1 46.7 0.0 46.7 127.8 N 30º-0º 19.7 0.0 0.0 0.0 19.7 50.6 36.0 86.6 106.3 S 0º-30º 6.6 0.0 0.0 0.0 6.6 26.4 36.0 62.4 69.0 S 30º-90º 10.9 0.0 0.0 0.0 10.9 34.2 0.0 34.2 45.1 TOTAL 83.4 0.0 23.5 11.5 118.4 157.8 72.0 229.8 348.2
239,240
Pu
N 90º-30º 1.3 0.0 0.0 0.0 1.3 1.3 0.0 1.3 2.5
N 30º-0º 0.5 0.0 0.0 0.0 0.5 1.4 1.0 2.4 2.9
S 0º-30º 0.2 0.0 0.0 0.0 0.2 0.7 1.0 1.7 1.9
S 30º-90º 0.3 0.0 0.0 0.0 0.3 0.9 0.0 0.9 1.2
TOTAL 2.3 0.0 0.0 0.0 2.3 4.3 2.0 6.3 8.6
It has been assumed that the inputs of local fallout from the US Pacific tests were 113 PBq 90Sr, 181 PBq 137Cs and 2 PBq 239,240Pu. It was further assumed that this fallout was equally divided between latitude bands N 30-0° and S 0-30°. 90Sr and 137Cs had by the year 2000 decayed to 45 PBq and 72 PBq, respectively.
The major inputs from global fallout occurred in the late fifties and early sixties, reprocessing discharges peaked in the last half of the seventies and nearly all of the fallout from Chernobyl was deposited in 1986. There has been some redistribution of the radionuclides in the ocean due to both advection and mixing processes. Water-borne releases from reprocessing in western Europe and global fallout have thus been dispersed to the Arctic Ocean and contamination from the Baltic Sea, due to the Chernobyl accident, has reached the North Atlantic and Arctic Oceans.
The NE Atlantic is the part of the world ocean most contaminated by radionuclides because of 137Cs input from all three major sources: global fallout, reprocessing and Chernobyl. The lowest input of anthropogenic radionuclides has been to the waters surrounding the Antarctic continent. In these southern parts of the Pacific, Indian and Atlantic Oceans, the concentrations of e.g. 137Cs are about 40 times lower than those found in the NE Atlantic [21].
Although the ocean contains most of the anthropogenic radionuclides released into the environment, the radiological impact of this contamination is low. Radiation doses from naturally-occurring radionuclides in the marine environment (e.g. 210Po), are on the average two orders of magnitude higher [21].
3. PROCESSES AFFECTING RADIONUCLIDE CONCENTRATIONS AND INVENTORIES IN THE OCEANS
A wide range of radionuclides has been released into the oceans. Their distribution in space and time can be quite complex, but is always related to four general processes: the input function/source, radioactive decay, biogeochemistry, and oceanic processes.
A brief review of each of these processes is made below and provides examples and references to studies that incorporate these processes into the interpretation of environmental radionuclide distributions and inventories. It suffices to say that in most instances, considerable ancillary, non-radiochemical data are needed to interpret ocean radionuclide distributions. Thus the most basic studies require a knowledge of local oceanographic conditions in addition to the physical properties of the radionuclide of interest. This review will focus primarily on the man-made, or anthropogenic radionuclides, though considerable effort has been spent in ocean sciences understanding naturally-occurring radionuclides, such as the uranium/thorium decay series. Insights into the expected fate of anthropogenic radionuclides can often be gained by comparisons between appropriate natural and anthropogenic radionuclides.
3.1. Radionuclides as oceanographic tracers
The most fundamental properties needed to understand marine radionuclide distributions are the half-life of the radionuclide, and information on its source. While those isotopes with the shortest half-lives (<days - months) often are of greatest radioecological concern (131I, t1/2 = 8.0 days), radionuclides with longer half-lives pose a greater potential for redistribution, bioaccumulation, and storage within the oceans and underlying sediment. Also useful with respect to half-lives, is the ability to identify different radionuclide sources, due to the presence of shorter-lived isotopes in any particular sample. For example, the presence of
134Cs (t
1/2 = 2.07 yrs) in surface ocean water shortly after the Chernobyl accident, allowed for the separation of Cs derived from the more recent 1986 source and prior sources of Cs such as weapons testing fallout which by the 80s, had essentially zero 134Cs [22].
16
TABLE V. CHARACTERISTIC ISOTOPIC RATIOS COMMONLY USED TO IDENTIFY ANTHROPOGENIC RADIONUCLIDE SOURCES IN THE MARINE ENVIRONMENT
Source 240Pu/239Pu atom ratio
Global weapons testing fallout 0.18
Nevada test site 0.03
Pacific test sites >0.30
Novaya Zemlya/Barents Sea <0.03
Mururoa <0.06 Source 134Cs/137Cs activity ratio in 1986
Global weapons testing fallout 0
Chernobyl fallout 0.5
Source 137Cs/90Sr activity ratio
Global weapons testing fallout 1.5 (in 1962, peak fallout year) Chernobyl fallout 5 (in 1986, year of release) Sellafield discharges 11 (in 1975, peak discharge
year)
If decay-corrected to April 26, 1986, 134Cs/137Cs ratios of 0.5 were found to be characteristic of the source and subsequent fallout (Table V [23]). Similar examples of using short lived radionuclides to pinpoint a source can be found from the early weapons testing years (e.g. 141Ce and 144Ce in deep ocean sea cucumbers [24]).
All radionuclide data are reported with a reference date, generally either the sampling date or date of release, so that changes in the reported distributions can be attributed to environmental, rather than decay processes. Sources of anthropogenic radionuclides have been reviewed elsewhere (this report, Chapter 2, [25, 26]).
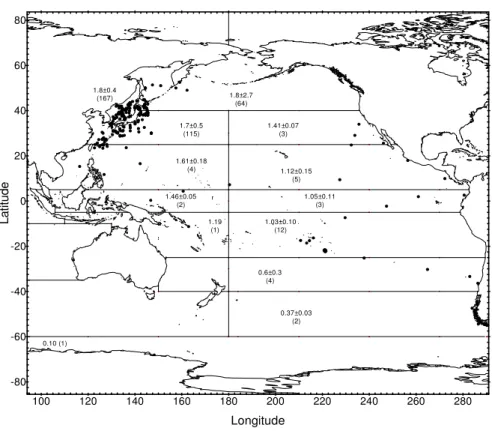
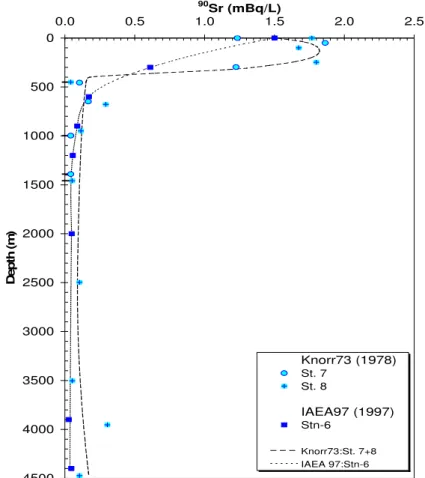
Many of the anthropogenic radionuclides from both fallout and local sources have been used by oceanographers as "tracers" of marine processes. Of great interest, for example in ocean sciences, has been the distribution of fallout 14C and tritium as tracers of the rates of ocean mixing (see below). It should also be noted in this regard that fallout delivery to the Northern hemisphere was much greater than to the Southern hemisphere, thus for the world ocean, there are generally lower activities of all anthropogenic radionuclides in sea water, sediment and biota south of the equator. Also, due to local fallout from weapons tests conducted in the Pacific, the inventories of Pu for example are higher than in soil samples at comparable latitudes (Fig. 6). In terms of local sources, there has been considerable use of Sellafield-derived 137Cs and 90Sr (Fig. 7), and Cap de la Hague-derived 129I to trace water movement in the North and Baltic Seas and into the Arctic Ocean [27, 28]. An additional category of local source input to the ocean is found in indirect input from rivers draining into the ocean. An example of this would be delivery of 90Sr from the Chernobyl reactor site via the Dnepr river to the Black Sea (Fig. 8 [29]).
FIG. 6. 239,240Pu inventories in Pacific water columns (mCi/km2) from GEOSECS [30]. Note that the water column inventories in the NW Pacific are higher than those expected from global fallout delivery (column on the right), due to local fallout from testing at Enewetak and Bikini.
FIG. 7. Surface distributions of 137Cs (disintegrations per minute per 100 kg as of 1 January 1981) in the Norwegian-Greenland Seas. Samples were collected in 1981 (dark symbols) and 1982 (light symbols). Note highest values north of Scotland due to Sellafield discharges [27].
18
FIG. 8. Average 90Sr concentrations in the Dnepr river near the Black Sea. Total fluxes per year are also indicated. Note large increase in 90Sr concentrations after Chernobyl [29].
3.2. Fate of conservative vs. particle-reactive radionuclides
Once released into the ocean, the fate of each isotope is largely tied to its chemical properties. Broadly speaking, the anthropogenic radionuclides are divided into:
(i) conservative, or
(ii) non-conservative or so-called particle-reactive radionuclides.
Conservative tracers are defined as being highly soluble in sea water, thus their redistribution upon entering the ocean is determined largely by physical processes related to ocean mixing and diffusion. Common examples of conservative radionuclides include 137Cs,
90Sr, 14C, tritium, 129I. Particle-reactive elements undergo more rapid removal from the ocean due to the affinity of these elements for natural particle surfaces and the general rain of sinking particles in the ocean which removes these particle-bound isotopes to the deep sea and underlying sediment. Examples include 239,240Pu, 106Ru and 144Ce.
A cause of confusion in marine radionuclide studies is that, depending upon the local ocean conditions and the time-scales of interest, different radionuclides can be used as both conservative and non-conservative tracers. For example, Cs is commonly used as a conservative tracer. However particle fluxes are considerably higher in coastal and more productive waters than in the open ocean, hence, 137Cs can be more readily scavenged in the coastal ocean and once bound to clays, can be used in sediment as a tracer of particle mixing and sediment accumulation. While Pu is generally thought of as a non-conservative tracer, its distribution on time-scales of years is largely controlled by physical mixing especially in the open ocean. Contrasting chemical behaviour of reduced Pu (more particle-reactive) and oxidized Pu (more soluble), leads to more rapid and complete removal of Pu from anoxic waters such as the deep Black Sea [31], thus in this case local geochemistry leads to conservative vs. non-conservative behaviour. Not only chemical, but also the physical form in which a radionuclide is delivered may determine its fate. For example, it has been shown that local fallout from land-based testing has delivered Pu to the oceans that was more rapidly removed to deep ocean sediment than its stratospheric-based Pu counterpart. It was hypothesized that this was due to the incorporation of Pu into melted silicate sands from the
Nevada Test Site (Figs 9 & 10) [32]. In this case, the measurements of 240Pu/239Pu isotopic ratios were used to identify the different Pu sources (Table V).
3.3. Variations in activity ratios
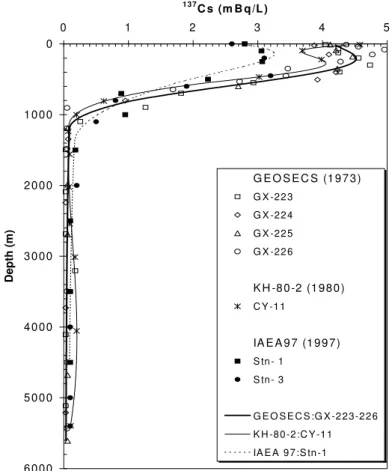
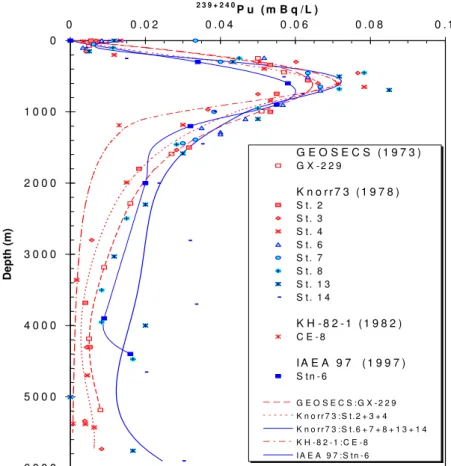
Since many anthropogenic radionuclides are introduced into the oceans in constant, or known local ratios, the change in ratio with time or location can often be used to deduce the extent and rates of particle reactivity for a given pair. For example, 239,240Pu/137Cs ratios in sea water decreased rapidly, due to removal of Pu onto particles and subsequent vertical sinking of these Pu-bearing particles (Fig. 11). Thus, by the time of the GEOSECS programmes in the 1970s, surface water Pu/Cs ratios in the central Pacific of <0.002 had been found, and in vertical profiles of both radionuclides this ratio increased to >0.02. Pu was found throughout all depths to 6000 m in at least low levels, while 137Cs was not detected in deep water [30].
Another way in which activity ratios might be observed to change is in a two dimensional sense, with enhanced removal of particle-reactive tracers occurring at ocean margins. Since surface mixing times between ocean gyres and margins is in the order of years to decades, horizontal transport can bring two radionuclides from the central basin in fallout proportions to ocean boundaries, but the more particle-reactive species would be enriched in coastal sediment (and depleted in coastal water) due to enhanced scavenging. With time, there would be a continued separation and removal of slightly particle-reactive species in ocean margins, thus leading to an increase in time, for example, in the Pu/Cs ratio in coastal sediment as Pu continues to be scavenged relative to Cs.
In addition to vertical and horizontal fractionation of conservative and non-conservative elements in sea water, there is also the possibility of post-depositional mobility of one or another species, depending upon geochemical conditions. One example, is the continued release of Cs and Pu from the contaminated sediment at the Marshall Islands (Fig. 12). On the other hand, it is known that in highly reducing marine sediments, pore water concentrations of NH4 increase and under these conditions Cs becomes more mobile [33, 34] and thus more diffusive. This is evidenced by Cs being found deeper in sediment than Pu delivered at the same time, and its loss to overlying waters.
3.4. Variations in inventory
As might be expected from the discussion above, variations in total inventory (per volume of water, sediment, or per area) are often important in order to learn more about the behaviour of radionuclides in the oceans. Most useful in this regard is some knowledge of delivery patterns (in space and time) and total supply per unit area of the ocean (assuming fallout delivery). Soil samples provide particularly useful information for determining average delivery rates, relative source ratios and inventories of many fallout radionuclides in each latitudinal band [35]. Due to higher than expected Pu (and Cs, Sr) inventories in sea water and sediment, it was possible to deduce, for example, that the N Pacific was impacted by local fallout from US weapons testing at the Pacific Proving Grounds [30]. Inventories were also used to examine the strength of boundary scavenging along the coast for 239,240Pu and naturally-occurring excess 210Pb (Fig. 13) [36].
20
FIG. 9. 240Pu/239Pu atom ratios in sediments vs. depth in the NW Atlantic. Squares were sampled in 1983-1985, while diamonds refer to archived samples (year of sampling indicated [32]).
FIG. 10. Fallout model used to identify two sources of fallout to the NW Atlantic, namely Nevada fallout with a low 240Pu/239Pu ratio, but high efficiency for removal into sediments, and global fallout with a 240Pu/239Pu ratio of 0.18, and low removal to sediments, except in coastal regions [32].
FIG. 11. Vertical profiles of 239,240Pu, 137Cs and 230Th from GEOSECS station G225 in the N Pacific. Note low Pu/Cs ratios at the surface due to Pu scavenging, higher Pu/Cs at subsurface Pu maximum, and no detectable Cs below about 2 km, while Pu is found at all depths. This separation with depth is due to the relative difference between the conservative nature of Cs in the oceans, and the particle-reactivity of Pu [26].
FIG. 12. Surface ocean concentrations of 137Cs (fCi/kg) in Bikini lagoon in 1972. Note highest concentrations associated with the testing site and apparent source of Cs to surrounding waters due to release from coral sediments [37].
22
FIG. 13. Sediment inventory vs. water depth for 239,240Pu and 210Pbexcess in the NW Atlantic. The dashed line at 100% represents expected delivery of both isotopes [36].
Variability in local sedimentary inventories also tells us something about sediment redistribution processes, those which could result from storms, or as fine grained sediment are
"focused" or otherwise concentrated in specific physical settings (canyons, deep basins) or are lost due to slumping along ocean margins or steep inclines. Often, the integrity of deep ocean box cores can be checked by the presence/absence of fallout Pu or excess natural 210Pb. If there is core top loss during sampling for example, the uppermost layers which include the recent fallout signal, would be missing. In general, particle-reactive radionuclides inventories continue to increase in marine sediment, whereas ocean water concentrations and inventories decrease due to both dilution and scavenging losses.
4. PACIFIC OCEAN 4.1. Overview
The major source of anthropogenic radionuclides in sea water and sediment in the Pacific Ocean and its marginal seas can be traced to global and local fallout from nuclear weapons testing. Other sources have introduced relatively smaller amounts of radionuclides into the Pacific Ocean.
Past measurements of concentrations of 90Sr, 137Cs and 239,240Pu in surface water, the water column and sediment from regions of the North and South Pacific Ocean are reported. A comprehensive collection of published references on these radionuclides in the Pacific environment is attached (ANNEX IV). The data for concentrations were extracted from these references as well as from various institutional sources and has been compiled in the GLOMARD database.
The different regions of the Pacific Ocean were chosen on the basis of known ocean current systems (Fig. 14), the location of nuclear test sites, the availability of recent data and, for some, the probability of a relatively uniform distribution of radionuclides.
Radionuclide concentrations measured since 1971 in surface water from 14 regions of the Pacific Ocean and its marginal seas (Fig. 15) are presented in a series of figures. Regression analyses of the results provide best estimates of effective half-lives for radionuclides in surface water. The computed values are used to predict concentrations expected in surface water in the year 2000 which are compared to the most recently measured values in the areas concerned and are shown in the related tables. The remaining parts of this chapter contain tables of data and figures showing recently measured inventories of 90Sr, 137Cs and 239,240Pu in the water column and in sediment from regions of the NW Pacific. These results are compared with previous measurements made in the same area to assess changes in inventory over time.
4.2. Radionuclides in the Pacific Ocean
The behaviour of 90Sr, 137Cs and 239,240Pu in the Pacific Ocean has been discussed in many papers (see ANNEX IV) and in a more recent review [38]. The most extensive studies were carried out during the 1973–1974 GEOSECS programme that provided the first comprehensive dataset on the lateral and vertical distributions of 90Sr, 137Cs and 239,240Pu in Pacific waters [30]. Traditionally, several Japanese institutes, as well as many other research groups, have been active in investigating these radionuclides, especially in NW Pacific water and sediment, e.g. [39–51]. A third group of investigations was concerned with nuclear weapons testing sites in the Marshall Islands, e.g. [52–54] and French Polynesia, e.g. [55–58].
The behaviour of plutonium in the Pacific Ocean will be discussed in more detail as this element has received the greatest attention. The state of knowledge of the behaviour of Pu in the Pacific Ocean has evolved slowly due to the intrinsic complexity of the many factors involved and to the economic and logistical constraints on its study in the world’s largest ocean. Three of the main factors relevant to Pu behaviour are:
(i) The physical and chemical form of plutonium as it enters the ocean — frequently source-dependent,
(ii) The basic physico-chemical properties of plutonium e.g. oxidation state, speciation and the ability to form complexes, and the resultant phase partition between particles and solution,
(iii) The physical, chemical and biological processes that act on plutonium in the Pacific Ocean in a heterogeneous manner — both geographically and over seasonal, annual and multi-annual time-scales.
The major input of plutonium to the Pacific Ocean both quantitatively and geographically, resulted from atmospheric testing of nuclear weapons. A significant but smaller input of plutonium, derives from the global fallout of a 238Pu source in a navigational satellite (SNAP-9A) that burned up over the Indian Ocean in 1964 [35]. Other inputs, e.g. from nuclear waste disposal, isolated underwater nuclear tests or land-based releases, are relatively minor in comparison and tend to have rather localized effects. The primary source from
24
FIG. 14. The global surface current system (adapted from The Open University [59]). Cool currents –dashed arrows; warm currents –continuous
0 20 40 60 80 100 120 140 160 180 200 220 240 260 280 300 320 340 360 Longitude
-80 -60 -40 -20 0 20 40 60 80
Latitude
1
2 3
4 5
6 7
8 9
1 0 1 1
1 3 1 4
1 5
1 6
1 7 1 2
FIG. 15. Latitudinal boxes in the Pacific and Indian Oceans.
26
![FIG. 14. The global surface current system (adapted from The Open University [59]). Cool currents –dashed arrows; warm currents –continuous](https://thumb-ap.123doks.com/thumbv2/123deta/5723879.21702/32.1263.199.1101.103.711/global-surface-current-adapted-university-currents-currents-continuous.webp)