Study of Photoionization and Dissociation
Dynamics of the Fullerene C
60
Bhim Prasad Kafle
Doctor of Philosophy
Department of Structural Molecular Science
School of Physical Science
The Graduate University for Advanced Studies
2007
Acknowledgements
I would like to express the gratitude to Prof. Dr. Koichiro Mitsuke, associate professor of Graduate University for Advanced Studies and IMS, for his valuable and creative guidance for this research. I would like to thank Dr. Hideki Katayanagi for his continuous help during experiments and data analysis, and also other members of the Mitsuke group for their support during the course of my experiments. Special thank is due to the members of the UVSOR facility of IMS for their help during the course of the experiments. I would like to thank to Prof. Kosugi, and other professors in IMS with whom I got opportunities to learn about theory and experimental techniques regarding my work. I am very grateful to Heiwa Nakajima Foundation (HNF) that provided me with a financial support during this study and also express appreciation for providing Honors Scholarship from Japan Student Services Organization (JASSO). This work was supported by national funds appropriated for special research projects of the Institute for Molecular Science, by Grants-in-Aids for Scientific Research (Grant Nos. 14340188,18350016, and 17750023) from Ministry of Education, Science, Sports, and Culture, Japan, and a grant for Scientific research from Research Foundation for Opto-Science and Technology.
Table of Contents:
Title of the thesis ……….. i
Acknowledgements ……….. ii
Contents . .………. …. iii
List of abbreviations...……… v
Abstract………….……….. vi
Chapter 1 1 General Introduction ……….. 1
1.1 Photoabsorption/ionization cross section of C60 ingas phase………... 6
1.2 Photodissociation dynamics of the fullerenes ……… 8
References .……….. 13
Chapter 2 2 Basic theory of photoabsorption by an atom or molecule ……….16
2.1 The absorption line ………16
2.2 Photoabsorption cross section and oscillator strength ………...17
References ……….19
Chapter 3 3 Experimental section………..20
3.1 Overview ………...20
3.2 Synchrotron radiation and Monochromator ………..20
3.3 Experimental chamber and vacuum system………...23
3.4 Experimental procedure and data acquisition system………23
References………..25
Chapter 4 4 Absolute Total Photoionization Cross Section of C60 in the extreme UV…….29
4.1 Introduction ………..29
4.2 Methodology ……….31
4.3 Results and discussion ………..35
4.3.1 Photoionization cross section ………35
4.3.2 Photoabsorption oscillator strength ………..36
4.4 Conclusions ………...40
References ……….41
Chapter 5 5 A Design of Photofragment Imaging Apparatus for Measuring Momentum Distributions. ………..52
5.1 Introduction ………...52
5.2 Basic concept and design optimized by simulations ……….54
5.3 Results ………...56
5.4 Conclusions ………...40
References ………....58
Chapter 6 Summary of thesis ……… 63
References ………...66
Appendixes ……….. 68
Appendix 1………. 68
Appendix 2………. 70
List of Publications ………..73
List of abbreviations synchrotron radiation, SR
extreme ultraviolet, EUV
time-of-flight spectrometer, TOF spectrometer absolute total photoionization cross section, σabs,I
absolute photoabsorption cross section, σabs,A
photon energy, hv
mass-to-charge ratio, m/z microchannel plate, MCP
absolute partial cross section for the formation of singly charged C60 ion, σabs(+) absolute partial cross section for the formation of doubly charged C60 ion, σabs(2+) absolute partial cross section for the formation of triply charged C60 ion, σabs(3+) absolute overall detection efficiency of the apparatus, ηabs
oscillator strength distribution, df/dE photoabsorption oscillator strength, f
Thomas-Kuhn-Reiche sum rule, TKR sum rule potential energy surface, PES
resonance-enhanced multiphoton ionization, REMPI position sensitive detector, PSD
Abstract
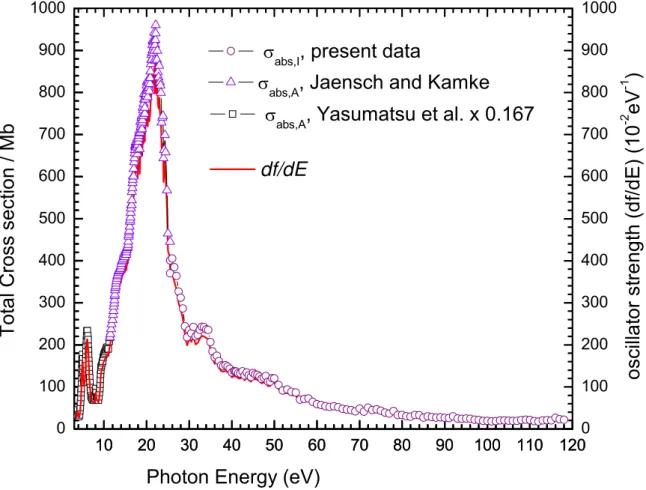
In the present thesis, the results of the study on the absolute total photoionization cross section σabs,Iof gaseous C60 in the photon energy hv range from 25 to 120 eV are presented. The measurements are carried out by using photoionization mass spectrometry in combination with synchrotron radiation. Absolute partial cross sections σabs(z+) (z = 1-3) for the formation of the ions in a charge state z from C60 were evaluated by considering the absolute detection efficiencies of photoions in different charge states. Then the absolute total photoionization cross section (σabs,I) was obtained by summing up all of the σabs(z+). Moreover, the present σabs,Icurve was combined with the photoabsorption cross section curves of C60at hv = 3.5 - 26 eV in the literature, after appropriate alterations of the vapor pressure are taken into account. The oscillator strengths are computed from the composite curve to be 178.5 and 230.5 for the hv ranges from 3.5 to 40.8 eV and from 3.5 to 119 eV, respectively. These oscillator strengths agree well with those expected from the Thomas-Kuhn-Reiche sum rule and 60 times the photoabsorption cross section of a carbon atom. Moreover, the present σabs,Icurve behaves similarly to the relative photoionization cross section curve reported by Reinköster et al.[J. Phys. B, 37(2004) 2135].
When a fullerene, in particular C60 molecule, absorbs a photon of energy ~ 41 eV or above, a highly excited ion of C60is produced and thendissociates into smaller ionic and neutral fragments. In this thesis, description is also made on a design of a new version of photofragment imaging spectrometer, which will be applied to observe the momentum distributions of ionic fragments from large molecules, clusters, and fullerenes. The apparatus consists of several components: circular electrodes, a time-of-flight drift tube, a potential-switcheable mass gate,
ion reflector, and a position sensitive detector. The velocity focusing lens system of Eppink-Parker type [Eppink and Parker, Rev. Sci. Instrum. 68, 3477(1997)] realizes high resolution of the photofragment images. Moreover, the mass gate is incorporated inside the tube in order to separate fragment ions with a particular cluster size (e.g. C58+) from those with other sizes (e.g. C60+, and C56+ ). The optimum arrangement and dimensions of the components are determined from the results of ion trajectories of C56+, C58+ and C60+ simulated by using the SIMION software. The calculated images of C58+ ions show that kinetic-energy resolution of 10 meV is achievable. It is expected that useful information on reaction mechanism of highly-excited fullerene ions can be derived from the momentum distributions of the fragments.
Chapter 1
1 General Introduction
Understanding excitation and chemical reaction dynamics of molecules is one of the most important goals of chemical physics. For achieving these goals, several modern spectroscopic techniques such as laser spectroscopy, photoabsorption spectroscopy, photoionization mass spectrometry, momentum imaging spectrometry, have been developed. These spectroscopic methods are closely related to the interaction of molecules with electromagnetic radiation, and can extensively explore molecular properties in the energy range from microwave to X-ray. For example, the rotational transition of molecules typically occurs by absorption and emission of radiation in the microwave region, and the electronic transition from an inner-shell molecular orbital is caused by absorption of radiation in the X-ray region.
As described in the textbook of Samson [1] and the review of Hatano [2] the energy region from ~ 12 eV to ~ 6 keV (the wavelength region from 0.2 nm to 100 nm) in the electromagnetic spectrum is categorized as the extreme UV (EUV) region. The EUV radiation which is emitted from the sun is promptly absorbed by the uppermost atmosphere and eventually molecular ions and electrons densely exist as plasma. Therefore, the importance of photochemistry in the extreme UV region has attracted a growing interest from the view point of atmospheric chemistry.
In particular, studies on photoexcitation and decay dynamics of molecules in this energy region are significantly important since both photoabsorption and photoionization cross sections take large values in the EUV region for almost all molecules [2]. The study of interaction between a molecule and synchrotron radiation in the EUV region can provide us with valuable spectroscopic information,
particularly, in molecular photoionization and photodissociation processes. Since almost all molecules have the lowest ionization potential below 20 eV, their photoabsorption cross section curves show continuous behavior due to direct photoionization in the EUV region. In addition, photoabsorption spectra, in this energy range, are greatly diversified by excitation into neutral quasi-discrete states. Such states have an internal energy larger than that of the lowest ionization potential and are often referred to as superexcited states [2-5].
Photoabsorption and photoionization cross sections are fundamental spectroscopic properties of isolated molecules. Determining their magnitudes as a function of photon energy gives the energy dependent transition probability or oscillator strength. Oscillator strength is a dimensionless parameter to express the strength of transition (if an electron bound to a nuclear framework possesses perfect oscillating properties following a harmonic motion then from the classical theory the excitation probability of that electron can be expected to have an oscillator strength of unity). As stated in the former paragraph, major parts of both photoabsorption and photoionization cross section spectrum for almost all molecules lie in the EUV region [2]. Actually many molecules have maximum oscillator strength in the energy range between 10 and 30 eV.
One of the remarkable discoveries in the late 20th century was the fullerene, the third allotrope of carbon after diamond and graphite. The closed form of these molecules is built up by carbon atoms having 12 pentagons and a varying number of hexagons. The C60 fullerene with a structure of truncated icosahedron is a good example of this novel form of carbon. Because it is an exceptionally stable and symmetric cluster, C has received much attention of scientists in many fields of
expertise. Indeed, there has been speculation on the possible chemical and industrial uses of C60 [6], and on its importance in astrophysical environments [7-8]. In this prospect endohedral metallofullerenes (fullerenes with metal atom encapsulated) has already been prepared successfully. These compounds are particularly interesting because the electron transfer from the encaged metal atom to the carbon cage is known to occur and this substantially alters electronic and magnetic properties of the fullerenes [9]. Superconductivity was discovered at high temperatures in the alkali metal fullerides, K3C60 (at critical temperature TC = 19 K [10]) and Rb3C60 [11]. Moreover, there has been genuine attempts to produce C60 based solar cells [12-14].
In the spectroscopic point of view, the fullerenes in general, and C60 in particular, demonstrate unique photoabsorption and ionization properties. Moreover, observing the intrinsic behavior of such a highly symmetric molecule C60 after ejecting one or more electrons by photon impact could give us great insight into the single and multiple-photoionization processes and nature of dissociation of other clusters. Actually, a relative curve of the photoionization cross section from the ionization threshold up to 280 eV (the carbon K-edge) has already been recorded [15- 22] and revealed several peculiar phenomena. For example a strong peak lying at hv ~ 20 eV with an FWHM of ~10 eV was demonstrated in the ion yield curve measured by Hertel et al.[15] from ionization threshold (7.6 eV) to 35 eV. They ascribed this peak to a giant plasmon resonance, which was also observed in the yield curve of C70+
from C70. The plasmon resonance in C60 has been accounted for by that 240 valence electrons are delocalized over the surface but confined in a thickness of single carbon atom in the radial direction. Moreover, a markedly higher ratio of the yield of multiply charged ions to singly charged ions of C60 in comparison to the
corresponding ratio for small molecules was observed, at particular photon energies [20-22].
Now, photoionization (or photoabsorption) cross section in an absolute scale is still to be settled because of several difficulties to be encountered for such quantitative experiment (discussion on this issue is made in the successive section). On the other hand, when C60 is exposed to the photon of energy ~ 41 eV or above the highly excited C60 parent ion undergoes fragmentation mainly by sequential loss of C2 unit. A few experimental efforts [23-25] have been made in order to realize whether the fission process by losing C4, or C6…, is also a possible channel, although their experimental technique could not provide direct evidence to support to this channel. Therefore, in this thesis work, I devoted in the following two major directions of study, for tackling such genuine questions:
(I) Determination of absolute total photoionization cross section of C60 excited with synchrotron radiation in the EUV region.
(II) Design of the photofragment imaging apparatus for measuring momentum distributions of cationic fragments produced after dissociation of C60 photoions.
1.1 Photoabsorption and photoionization cross sections of C60
In order to understand the excitation and ionization dynamics of fullerenes, the relative photoionization cross section of C60 have been measured by means of mass spectrometry in the extreme UV region [15-22]. From these studies it has been revealed that the cross section curve shows several resonant peaks at photon energy below hv ~ 50 eV, reflecting the molecular character of C60 in its valence photoionization. Hertel et al. [15] showed that the yield curve of C60+ produced from C60 showsa markedly strong peak lying at hv ~ 20 eV due to collective excitation of
240 valence electrons. On the other hand, spectrum from recent studies show [18-19] fine peaks at hv = 26 and 34 eV and a flat area ranging from 40 to 50 eV in the yield curve, which have been ascribed to shape resonance. It is worthwhile to clarify that we have observed these features (fine peaks at hv = 26 and 34 eV) repeatedly even after normalizing our photoion counts to the photon flux measured using gold mesh. Thus these structures are not artifact as claimed by Scully et al. [26]. Moreover, in 2007, we have reinvested the ion yield curves of singly- and multiply-charged ions, mainly, C60z+ (z = 1 - 3) [22]. In this study, close evaluation of the relative detection efficiency of the MCP detector for each charged species produced from C60 was made and the percentage of the second order light in SR radiation was taken into account. Then the derived spectrum of total cross section was in accordance with the relative photoabsorption cross section of C60 [24]. It was also, explicitly, demonstrated that the ratios σ(60,2+)/σ(60,+) and σ(60,3+)/σ(60,+) between the partial cross sections for double and single photoionization of C60 and triple and single photoionization of C60, respectively, increase with increasing photon energy and asymptotically reaches upto 0.78 and 0.14, respectively [22]. The above observations are explained as that the excess internal energy is transmitted so rapidly among enormous vibrational degrees of freedom (174 vibrational degrees of freedom in the case of C60) that unimolecular reactions, such as direct dissociation, predissociation, or coulomb explosion, are significantly suppressed and the lifetime of the parent ions is elongated beyond the order of a millisecond [19,22].
As stated in the previous section, to obtain the absolute photoionization or photoabsorption cross section curve of C60 is another important issue which still remains to be established. Actually there exist only a few experimental works on the measurements of absolute total photoionization cross section (σabs,I) and absolute
photoabsorption cross section (σabs,A) of C60 in the extreme UV region [16,20,27-31]. However, even among these few measurements, the cross section values differ severely from each others in the overlapping region of energy. From close inspection of available data in literatures on σabs,I and σabs,A, we noticed that the most dubious parameter was vapor pressure, since the vapor pressure data which have been utilized to predict the cross section values varies widely by a factor of 1.5 to 6 at a particular temperature [32-35] (for example, the vapor pressure measured by Abrefah et al. [32] was given to be ~ 0.07 Pa and that measured by Jaensch and Kamke is 0.416 Pa at 500 oC).
In the present dissertation, first, σabs,I of C60 at extreme UV region was evaluated on a basis of the latest detection efficiency ( ) corrected data [22] of the relative partial cross sections for production of singly-, doubly-, and triply-charged ions. Then σabs,I was combined with the previously published σabs,A curves, after critically analyzing the vapor pressure data which were utilized in the literature, in order to derive the reliable curves of absolute cross sections over a wide energy range from 3.5 to 119 eV. From these curves, estimation of the oscillator strength has been made.
1.2 Photodissociation dynamics of the fullerenes
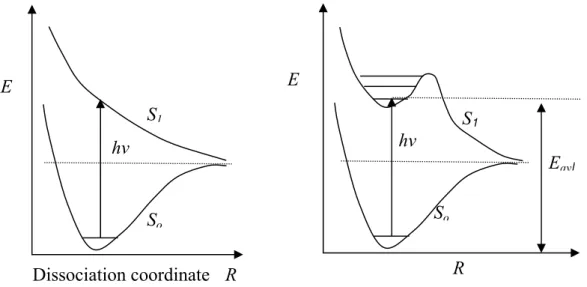
When a polyatomic molecule absorbs the light with an energy exceeding the dissociation threshold energy of its weakest bond, fragmentation can occur. The potential energy surface (PES) of the excited parent molecule determines the dynamics of this process, and consequently the branching ratios for fragmentation pathways and energy distribution in the photoproducts. Dissociation of the molecules is known to take place in two ways: direct and indirect dissociation [5,37]. In the case
of a direct dissociation the PES of the excited state is strongly repulsive along one or more coordinates yielding an extremely fast (< 10 fs) bond-breaking process, as shown in the Fig. (1.1a). In this dissociation process one may expect that a large fraction of the energy is released as translational energy. On the other hand, the indirect dissociation maybe the result of an excited state PES characterized by local well along the reaction coordinate as depicted in the Fig. (1.1b). The potential well acts like a “short-term waiting room” for the excited molecule to decay and it gives rise to pronounced structures in the absorption spectrum which reflect the energy spacing of the quasi-bound states supported by the potential well [37].
Fig. 1.1 Direct dissociation, left (a); and indirect dissociation (predissociation), right (b).
If we can visualize the motion of dissociating fragments in unimolecular reactions of energized isolated molecule, we will be able to achieve utmost understanding on the reaction dynamics involved. With such a prospect the photodissociation dynamics of various diatomic and polyatomic molecules has been studied theoretically and experimentally by utilizing various spectroscopic methods.
hv S1
So
E
Dissociation coordinate R
hv
S1
So E
Eavl
R
Photofragment translational spectroscopy in combination of TOF mass spectrometry is valuable in obtaining a fairly clear picture of the photodissociation process [38].
When fullerene C60 receives excess amount of energy through photoionization, primarily formed ions are known to undergo decomposition into fragment ions with even numbered carbon atoms. Measurements on the ion yield curves of the fragments C60-2nz+ and C70-2nz+ (n ≥ 1, z≥1) produced by photoionization of solitary C60 and C70,
respectively, have been reported in the EUV region [20,23,39]. Comparison between the experimental results and theoretical calculations revealed that the supplied excess energy is statistically distributed among the internal degrees of freedom of the parent ions and C2 units are ejected sequentially as follows [23,39]:
C60+→ C58+ + C2, C58+→ C56+ + C2, … C60-2n+2z+→ C60-2n+ + C2.
This conclusion was made on the basis of the findings that the experimentally observed ion yield curves and theoretically derived fractional abundance curves showed almost the same appearance energies for the formation of C60-2nz+ (n ≥ 1) [23,39]. The latter curves were derived by employing the RRKM theory to individual unimolecular reactions, C60-2n+2z+ → C60-2nz+ + C2. More reliable calculations of the rate constants of the consecutive reactions are seek before closer comparison between the two curves. For such calculations we should know precise values of the activation energies of the reactions, together with the vibrational spectra of the transition states.
On the other hand, as mentioned in the previous section, besides mechanism of sequential loss of C2 unit from C60z+, a few groups [24,25] have (argued and) attempted to find whether single-step two-fragment fission
C60z+→ C60-2nz+ + C2n
could also be a possible reaction path for the formation of C60-2nz+. The fragmentation pathways have been studied by measuring the average kinetic energy (KE) release in
the decomposition reaction of C60z+ into C60-2nz+ by means of (a) laser multiphoton ionization mass spectrometry of C60 [24] and (b) electron impact ionization mass spectrometry of C60 in conjunction with the ion deflection method [25]. However, their results on average KE release did not allow them to obtain conclusive evidence on whether such a mechanism takes part in. These unsolved problems induced us to develop a new spectrometer based on imaging technique in order to study the ionic fragments produced from C60z+ and C70z+. In contrast to the conventional time-of- flight method, where kinetic energy release information is contained in the temporal structure in the arrival period of electrons or ions of a specific mass, the ion imaging technique extracts all information (kinetic energy and angular distributions) from the spatial appearance of the two-dimensional (2D) image.
However, in order to exploit the imaging method to its full potential one needs to improve the quality of the 2D image. The mapping of 3D distributions of charged particles onto the 2D detector is particularly dependent on the configuration of the electrodes generating the extracting electric field [40]. The three-element velocity focusing lens system of Eppink-Parker type [40] surely satisfies this condition and high kinetic energy resolution can be achieved on the photofragment images. We optimized a photofragment imaging apparatus based on this lens system by simulation using the SIMION software [41] to obtain a 2D-image of the 3D-velocity distributions of a desired fragment. In order to select a bunch of fragments having the same mass- to-charge ratio m/z we put a potential switcheable mass gate and an ion reflector inside the TOF tube. The assembly of three-element velocity focusing lens system of Eppink-Parker type in combination with the mass gate and ion reflector makes our apparatus unique.
In this dissertation I will show that, from the simulated trajectories of C60+, C58+,and C56+, at initial kinetic energy of 0.1 eV, most of the trajectories of C58+ are found to pass through the ion reflector and reach the PSD. In contrast, the trajectories of C60+ and C56+ are reflected completely. Indeed, this observation provides direct evidence for exclusive imaging detection of C58+ by excluding C60+ and C56+ with the same kinetic energies. Furthermore, the image resolution of this apparatus will be determined by presenting individual images on the PSD for the C58+ ions with only a very small kinetic energy difference of about 10 meV.
In experiment, this observed 2D image of the 3D distribution of an ionic fragment can easily be processed for deriving the translational energy distribution of a desired fragment with a very good energy resolution. Therefore, it is likely that, from the translational energy distribution, we can reveal (a) which reaction mechanisms are dominant in the above photodissociation process and also possibly can observe (b) whether potential barrier exists along the reaction coordinate.
References
[1] J. A. R. Samson, In: Techniques of Vacuum Ultraviolet Spectroscopy, (Pied Publications, Lincoln, Nebraska, 1967) p.2.
[2] Y. Hatano, In: Dynamics of Excited Molecules, K. Kuchitsu (eds.), Elsevier, Amsterdam, 1994, p.186.
[3] R. L. Platzman, Radiat. Res. 17 (1962) 419.
[4] K. Mitsuke, H. Hattori, and Y. Hikosaka, J. Electron Spectrosc. Relat. Phenom. 112 (2000) 137.
[5] H. Nakamura, J. Phys. Chem. 88 (1984) 4812.
[6] H. W. Kroto, J. R. Health, S. C. O’Brien, R. F. Curl, and R. E. Smalley, Nature 318 (1985) 162.
[7] H. W. Kroto, Science 242 (1998) 1139.
[8] W. Krätschmer, Lowell D. Lamb, K. Fostiropoulos, and D. R. Huffman, Nature 347 (1990) 354.
[9] H. Shinohara, Rep. Prog. Phys. 63 (2000) 843. [10] R. C. Haddon et al., Nature 350 (1991) 320.
[11] K. Holczer, O. Klein, S-M. Huang, R. B. Kaner, K-J. Fu, R. L. Whetten, and F. Diederich, Science 252 (1991) 1154.
[12] E. A. Katz, D. Faiman, S. M. Tuladhar, J. M. Kroon, M. M. Wienk, T. Fromherz, F. Padinger, C. J. Brabec, and N. S. Sariciftci, J. Appl. Phys. 90 (2001) 5344.
[13] N. S. Sariciftci, L. Smilowitz, A. J. Heeger, and F. Wudl, Science 258 ( 1474) 1992).
[14] C. J. Brabec, N. S. Sariciftci, and J. C. Humelen, Adv. Funct. mater 11 (2001) 15.
[15] I. V. Hertel, H. Steger, J. de Vries, B. Weisser, C. Menzel, B. Kamke, and W. Kamke, Phys. Rev. Lett. 68 (1992) 784.
[16] R. K. Yoo, B. Ruscic, and J. Berkowitz, J. Chem. Phys. 96 (1992) 911.
[17] S. Aksela, E. Nõmmiste, J. Jauhiainen, E. Kukk, J. Karvonen, H. G. Berry, S. L. Sorensen, and H. Aksela, Phys. Rev. Lett. 75 (1995) 2112.
[18] J. Kou, T. Mori, M. Ono, Y. Haruyama, Y. Kubozono, and K. Mitsuke, Chem. Phys. Lett. 374 (2003) 1.
[19] J. Kou, T. Mori, S. V. K. Kumar, Y. Haruyama, Y. Kubozono, and K. Mitsuke, J. Chem. Phys. 120 (2004) 6005.
[20] A. Reinköster, S. Korica, G. Prümper, J. Viefhaus, K Godehusen, O. Schwarzkopf, M. Mast, and U. Becker, J. Phys. B, At. Mol. Opt. Phys. 37 (2004) 2135.
[21] P. N. Juranic, D. Lukic, K. Barger, and R. Wehlitz, Phys. Rev. A 73 (2006) 042701.
[22] K. Mitsuke, H. Katayanagi, B. P. Kafle, C. Huang, H. Yagi, Md. S. I. Prodhan, and Y. Kubozono, J. Phys. Chem. A 111 (2007) 8336.
[23] J. Kou, T. Mori, Y. Kubozono, and K. Mitsuke, Phys. Chem. Chem. Phys. 7 (2005). 119.
[24] H. Gaber, R. Hiss, H. G. Busmann, and I. V. Hertel, Z. Phys. D 24 (1992) 307.
[25] D. Muigg, G. Denifl, P. Scheier, K. Becker, and T. D. Märk, J. Chem. Phys. 108 (1998) 963.
[26] S. W. J. Scully, E. D. Emmons, M. F. Gharaibeh, R. A. Phaneuf, A. L. D. Kilcoyne, A. S. Schlachter, S. Schipers and A. Müller, H. S. Chakraborty M. E. Madjet, and J. M Rost, Phys. Rev. Lett. 94 (2005) 065503-1.
[27] P. Colavita, G. De Alti, G. Fronzoni, M. Stener, and P. Decleva, Phys. Chem. Chem. Phys. 3 (2001) 4481.
[28] H. Yasumatsu, T. Kondow, H. Kitagawa, K. Tabayashi, and K. Shobatake, J. Chem. Phys. 104 (1996) 899.
[29] R. Jaensch and W. Kamke, Mol. Mater. 13 (2000) 143. [30] W. Kamke, private communication, revised data of ref. 12.
[31] T. Mori, J. Kou, Y. Haruyama, Y. Kubozono, and K. Mitsuke, J. Electron Spectrosc. Relat. Phenom. 144-147 (2005) 243.
[32] J. Abrefah, D. R. Olander, M. Balooch, and W. J. Siekhaus, Appl. Phys. Lett. 60 (1992) 1313.
[33] V. Piacente, G. Gigli, P. Scardala, A. Giustini, and D. Ferro, J. Phys. Chem. 99 (1995) 14052.
[34] R. Jaensch , and W. Kamke, Mol. Mater. 13 (2000) 163.
[35] C. K. Mathews, M. Sai Baba, T. S. L. Narasimhan, R. Balasubramanian, N. Sivaraman, T. G. Srinivasan, and P. R. V. Rao, J. Phys. Chem. 96 (1992) 3566.
[36] S. H. Schwartz, A. Fardi, K. Haghighat, A. Langereis, H. T. Schmidt, and H. Cederquist, Phys. Rev. A 63 (2000) 013201.
[37] J. R. Huber, Pure and Appl. Chem. 60 (1988) 947.
[38] R. Bersohn, in: Molecular Photodissociation Dynamics, M. N. R. Ashfold, and J. E. Baggot (eds.), The Royal Society of Chemistry, London, 1987, Chap.1.
[39] K. Mitsuke, H. Katayanagi, J. Kou, T. Mori, and Y. Kubozono, Am. Inst. Phys. CP 811 (2006) 161.
[40] A. T. J. B. Eppink, D. H. Parker, Rev. Sci. Instrum. 68 (1997) 3477.
[41] D. A. Dahl, SIMION 3D 7.0, Boise Idaho: Scientific Instrument Services Inc. 2000.
Chapter 2
2. Basic theory of photoabsorption by an atom or molecule 2.1 The absorption line
If linearly polarized light with a continuous spectrum is allowed to fall onto an absorption cell containing a low-pressure gas, the attenuation of light occurs. The attenuation profile may be represented as in Fig. 2.1, where the transmitted intensity Iv
(defined as the energy transmitted per second in unit solid angle and through unit area perpendicular to the beam per unit frequency interval) is a function of the frequency v (spectrum centered on v).
Fig 2.1 (a), the attenuation profile for an absorption line; (b), the absorption coefficient profile for an absorption line. Figures are taken from Ref. (1).
If an electromagnetic radiation having a bandwidth between w and w + dw, and intensity I(w) (where w = 2πv) is permitted to pass through a gas cell of thickness dx, the radiation exiting from the cell will have been attenuated by dI(w), which can be written as
dx N w I w w
dI( )=σos( ) ( ) 0 . (2.1)
Δν
Frequency
Absorption Coefficientt
σν
(σν)/2
ν frequency ν Io
(a)
(b)
Here N0 is the number density of molecules of the gas in some lower (ground) state and the equation Eq. (2.1) serves to define an absorption cross section σos(w) corresponding to a transition between the lower state 0 and upper state s. Application of Fig. 2.1(a) and Eq. (2.1) allows the variation of absorption cross section as a function of frequency to be obtained as in Fig. 2.1(b) [1].
The incident radiation induces transitions from the lower state 0 to a state s, thereby reducing the number density N0. This is described by the equation
dw w w B dt N
dN
os( ) ( )
0
0 =
∫
ρ− (2.2)
where ρ(w)= I(w)/c is the energy density of the electromagnetic radiation and Bon(w) is the Einstein coefficient for induced absorption as given by the following equation;
2 2
2
3 0 ) 4
( =
∑
j j
os se x
w h
B π . (2.3)
Here, the quantity in bra-ket is the electric dipole matrix element.
2.2 Photoabsorption cross section and Oscillator strength
If an electron bound to a nuclear framework possessed perfect oscillating properties following harmonic motion, then according to classical theory the excitation probability of this electron would be said to have an oscillator strength, fn, of one. The concept of the optical oscillator strength has been developed for providing a useful measure of the transition probability [2-4].
The notion of the oscillator strength is originally due to Thomson. Later Heisenberg and Kramers derived the same expression from quantum mechanics, as summarized by Fano and Cooper [5]. An explicit derivation on this parameter is given in the references [2,3] and also included (only relevant part) in the appendix 2 of this thesis. Berkowitz [2] and Inokuti [3] have explained nicely how the derivation on this parameter obtained from classical theory and that from the quantum mechanics
are related. In classical theory electrons are considered as bound to their equilibrium position by a restoring force proportional to their displacement x(t) at time t, and thus undergoing harmonic oscillation at natural (angular) frequency wn. In the other hand, quantum mechanically one must consider the mean value of the displacement x (or equivalently, the mean value of the induced dipole moment ex) when an external field is imposed upon an atomic or molecular system). More importantly, Fano and Cooper [5] gave the prescription for evaluating fs as
2
3 0
2 ⎟⎠⎞
∑
⎜⎝
=⎛
j j s
s s x
f mw
h , (2.4)
Here fs is expressed in terms of the dipole matrix element squared
2
∑
jxj 0s between the ground state 0 and the excited states.
The above equation can also be expressed as
2 2
3 8π ν μ
⎟⎟⎠
⎜⎜ ⎞
⎝
=⎛ h
fs me . (2.5)
Where μ is the induced transition dipole moment or dipole strength corresponding to the electronic transition.
Moreover, the oscillator strength distribution df/dE is proportional to absolute photoabsorption cross section σabs,A at the photon energy E:
dE df c m
h e
e o
2 A
abs, =4ε σ
dE 20 df 10 098 .
1 × −
=
. (2.6)
Here, σabs,A is in m2 and E is in eV. For calculations values of parameters used are as follows: the electron charge e of 1.602×10⁻¹⁹ C, the Planck constant h of 6.626×10⁻³⁴ J s, the vacuum permittivity εo of 8.854×10⁻¹² C2J-1m-1, the electron rest mass me of
9.109×10⁻³¹ kg, the velocity of light c of 2.998×10⁸ m s-1. Integration of eq. (2.6) leads to the oscillator strength f in the hv range from E1 to E2 as
∫
∫
= × −= 2
1 2
1 20
A abs,
10 098 . 1
E E E
E dEdE dE
f df σ
. (2.7)
The total oscillator strength ftotal including discrete and continuum spectra should agree with the total number N of electrons in the molecule:
N dE
dEdE f df
E
E = × =
=
∫
∞∫
∞ −0
0 20
A abs,
10 098 . 1
σ
. (2.8)
Here Eo indicates the transition energy from the initial vibronic ground state to the vibrational ground level of the lowest electronically excited state. This relation is called the Thomas-Kuhn-Reiche (TKR) sum rule.
References
[1] G. V. Marr, In: Photoionization Processes in Gases, Academic Press, New Work (1967) p. 6.
[2] J. Berkowitz, In: Photoabsorption, Photoionization, and Photoelectron Spectroscopy, Academic Press, New York (1979) p. 59.
[3] M. Inokuti, Photochem. Photobiol. 44 (1986) 279.
[4] Y. Hatano and M. Inokuti, In: M. Inokuti (ed.), Atomic and Molecular Data for Radiotherapy and Radiation Research, IAEA, Vienna (1995) Chap. 5.
[5] U. Fano and J. W. Cooper, Rev. Mod. Phys. 40 (1968) 441.
Chapter 3 3 Experiment
3.1 Overview
In this chapter, description is made on the experimental arrangements used for the quantitative studies of photoionization cross sections of C60.
All the experiments have been carried out using a monochromatized synchrotron from the 18 m spherical grating monochromator connected to the bending magnet beamline 2B of the UVSOR synchrotron radiation facility at the Institute for Molecular Science. The experimental setup mainly consists of an 18 m spherical grating Dragon type monochromator [1-2], a time-of-flight (TOF) mass spectrometer, a water cooled thickness monitor, a photodiode (or a gold mesh), and a heat reflector into which sample holder (situated at 45.3 mm below from the ionization region) is kept. Typical arrangements of the apparatus (TOF spectrometer and other electronic devices) are shown in Fig. (3.2). The mass spectrometer, which has been kept inside the experimental chamber (Fig. 3.3), was arranged in such a way that center of the ion repeller and extracting electrodes coincide with the focal point of the post focusing mirror of the beamline. A supersonic molecular beam flowing through a hole at the top of the heat reflector was collided with a photon beam in the photoionization region. The photoions thus produced are extracted by the acceleration field, traveled in the drift tube, and detected by a microchannel plate (MCP) in order to measure the mass spectra or photoionization yield curves. This experimental setup is basically the same with that of employed originally by Mori et al. [3] and Mitsuke et al. [4] for the study optical properties of fullerene family.
3.2 Synchrotron Radiation and Monochromator
Ultraviolet Synchrotron Orbital Radiation (UVSOR) facility in IMS consists of a 15 MeV linear accelerator (liniac) as an electron beam pre-injector, a booster electron synchrotron (about 8.5 m diameter) for accelerating the electron beam up to 750 MeV, and a 750 MeV electron storage ring for producing synchrotron radiation [5]. The electron beam injected from the liniac and accelerated by the synchrotron accelerator is further injected into the storage ring, and accelerated up to 750 MeV. The storage ring has a quasi-octagonal shape with the combination of 8 bending magnets and 8 straight sections. In straight sections, four undulators are installed for producing higher brightness synchrotron radiation. Furthermore, a radio-frequency RF cavity is used to compensate the energy of the electron beam lost by emitting synchrotron radiation. When UVSOR is operated in its multi bunch mode, the electrons are stored with into 16 bunches. Main parameters of the UVSOR accelerator complex are summarized in Table 3-1.
Table 3-1
General parameters of the storage ring
Circumference 53.2 m
Energy 750 MeV (600 MeV at injection)
Number of bunches Multi-bunch Mode: 16 Single bunch Mode:1
Initial stored current Multi-bunch mode: 300 mA (max.500 mA) Single bunch Mode: 60-70 mA(max.100 mA) Beam lifetime Multi-bunch Mode: 8h (at 200 mA)
Single bunch Mode: 1h (50 mA)
Beam sizes 0.39 mm (horizontal) 0.27 mm (vertical) Pulsed light period Multi-bunch Mode: 11 ns
Single bunch Mode:176 ns
Pulsed light width ~ 1ns(min. 20 ps) with a harmonic cavity system
Vacuum pressure ~1×10⁻¹⁰ Torr
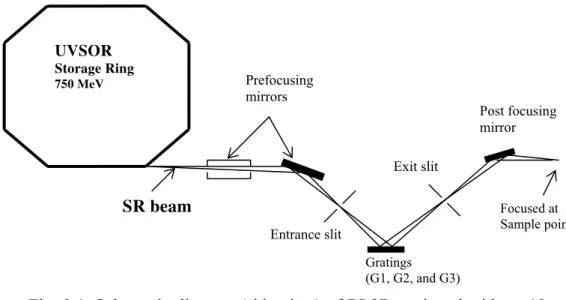
The Beamline BL2B in UVSOR has been utilized for the study of photoionization and reaction dynamics of various fullerenes in gas phase ([4] and reference therein). As shown in the schematic diagram of this beam line (side view) in the Fig (3.1), synchrotron radiation emitted from the storage ring is focused onto the entrance slit by two pre-focusing mirrors. The incident SR was monochromatized by the Dragon type monochromator which covers the hv range from 25 to 150 eV with three gratings: G1 for 80 - 150 eV; G2 for 40 - 100 eV and G3 for 25 - 50 eV [1]. After passing through the movable exit slit, the monochromatized light is refocused into the photoionization region by the post-focusing mirror (toroidal type). When the entrance- and exit- slit widths were set to 300 μm, the resolution (the full width at half maximum) which was determined by the measurement of the photon energy was estimated to be 8.5 meV of the members of the 3s-1np Rydberg series of argon which lie at hv = 25-30 eV [2]. The details of the monochromator have been published elsewhere [1,2]. Output spectrum (photon flux versus energy) of this monochromator measured during this experiment is shown in Fig. 3.4. The wavelength scan is performed by the stepping motor controlled on the CAMAC dataway by a personal computer.
The first-order light monochromatized by the grating G2 was subject to contamination of the second-order light. The hv dependence of the percentage of the second-order light was estimated by measuring the ion yield spectrum of He at hv = 40 - 100 eV [4] (contamination of the third and fourth order lights were considered to be negligible and were not evaluated). The percentage was determined as an adjustable parameter to reproduce the observed spectrum from the absorption cross section data of He [6]. For instance, the percentage at hv = 40 eV was found to be 22 %. Alternatively, the percentage of the second-order light could be calculated based on the Kr+ yield spectra of Kr in the vicinity of the 3d5/2-1 5p1 resonance peaks appearing at 45.6 and 91.2 eV, with the aid of the reported partial photoionization cross sections [7] of Kr at around 45 and nearly 90 eV. The resultant percentage was 23% at ~ 45 eV, which accords well with the value obtained using the ion yield spectrum of He.
3.3 Experimental chamber and vacuum system
The experimental chamber is evacuated by a turbomolecular pump with (respective to) its pumping speed of 1000 l/s. The typical background pressure is 1.1×10⁻⁸ Torr without a sample gas. Moreover, a differentially pumping chamber has been set between the experimental chamber and the post-focusing mirror which is pumped by an ion pump and supported by two turbo molecular pumps of pumping speed of 340 l/s installed near the both ends of this chamber. When the sample gas is introduced, the background pressure of up to ~ 1×10⁻⁵ Torr is allowed in the experimental chamber with keeping the pressure in the post-focusing mirror chamber
~ 1.5×10⁻⁹ Torr. Typically, during the experiments the pressure of the chamber was kept to be ~ 1×10⁻⁶ to 2×10⁻⁷ Torr.
To shield the photoionization region from the external magnetic field, the μ- metal shield is equipped inside the experimental chamber.
3.4 Experimental procedure and data acquisition system
Figure (3.2) shows the side view of the apparatus. The spectrometer is of the Wiley-McLaren type [8] double focusing time of flight (TOF) mass spectrometer. It consists of first and second acceleration regions, a 348 mm drift tube, and dual microchannel plates. The powder of the C60 with purity of 99.98% loaded in a quartz tube and further purified by eliminating the organic solvent such as benzene or toluene through heating the samples for 1 day (12 h) in a vacuum at nearly 200oC. In order to produce a molecular beam of C60, sample holder was heated up to 703 to 773 K with a resistive heater. An exit hole of the quartz tube was 1 or 2.5 mm in diameter. The molecular beam was then collimated by an orifice of 4.6 mm in diameter drilled on a heat reflector.
Monochromatized synchrotron radiation was focused onto the molecular beam and photoions were produced in the intersection region. A pulsed voltage rising from the ground level to +80 V (duration = 4.5 s, frequency = 10 kHz) was applied to the ion repeller electrode as a start trigger for the TOF measurement. The photoions extracted by this pulsed electric field were mass separated by a double-focusing time- of-flight (TOF) mass spectrometer, and detected with a secondary electron multiplier comprised of two microchannel plates (MCPs) having an effective diameter of 27 mm (Hamamatsu, F1552). The entrance surface of the front MCP was biased to the voltage of −2.1 kV, while the exit surface of the back MCP was grounded. The signal from MCP was fed into a time to digital converter and then processed by conventional pulse counting system. Ion signal counts were obtained by the integration over the respective mass peaks. Simultaneously the fluxes of synchrotron radiation and
molecular beam were measured throughout an experimental run using a silicon photodiode and crystal-oscillator surface thickness monitor, respectively. A photoion yield spectrum was obtained by normalizing the integrated ion counts at each hv for the photon and molecular-beam fluxes, and by collecting the normalized counts consecutively with changing hv.
References
1. M. Ono, H. Yoshida, H. Hattori, and K. Mitsuke, Nucl. Instrum. Methods Phys. Res. A 467 (2001) 577.
[2] H. Yoshida and K. Mitsuke, J. Synchrotron Rad. 5 (1998) 774.
[3] T. Mori, J. Kou, M. Ono, Y. Haruyama, Y. Kubozono, and K. Mitsuke, Rev. Sci. Instrum. 74 (2003) 3769.
[4] K. Mitsuke, H. Katayanagi, B. P. Kafle, C. Huang, H. Yagi, Md. S. I. Prodhan, and Y. Kubozono, J. Phys. Chem. A 111 (2007) 8336.
[5] UVSOR Pumplet (2006), Pg. 3.
[6] J. M. Bijau and F. J. Wuilleumier, J. Electron Spectrosc. Relat. Phenom. 71 (1995) 205.
[7] N. Saito and H. I. Suzuki, Int. J. Mass Spec. Ion Proc. 115 (1992) 157. [8] W. C. Wiley and I. H. McLaren, Rev. Sci. Instrum. 26 (1955) 1150.
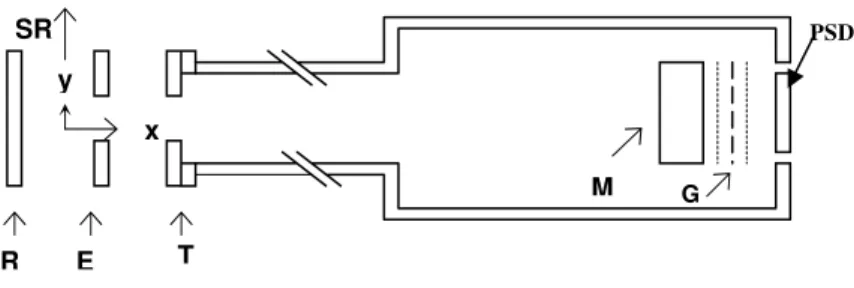
Fig. 3.2. Schematic diagram of apparatus for the photoionization spectrometer and data acquisition system. SR, monochromatized synchrotron radiation;
Gratings (G1, G2, and G3)
UVSOR Storage Ring 750 MeV
SR beam
Prefocusing mirrors
Entrance slit
Exit slit
Post focusing mirror
Focused at Sample point
Fig. 3.1. Schematic diagram (side view) of BL2B equipped with an 18 m spherical grating monochromator, entrance and exit slits, and pre- focusing and post focusing mirrors [2].
Controller
GPIB
PC
GPIB
10mm 10mm 348mm MCP
Pre- amplifier Discrimi- nator MCS
DATA OUT
START SIGNAL
Picoammeter GPIB Si Photodiode
Pulse ge- nerator
Delay ge- nerator
Drift Tube Extractor
SR
Repeller Heater
For Normalization
For Normalization
Thickness Monitor
Water flow for cooling
80V
Fig. 3.3. A photograph of the photoionization spectrometer (the double focusing TOF spectrometer) assembled inside the experimental chamber in BL2B.
0.0 5.0x10¹⁰ 1.0x10¹¹ 1.5x10¹¹ 2.0x10¹¹ 2.5x10¹¹ 3.0x10¹¹ 3.5x10¹¹
Photon flux @100mA / s-1
(c)
40 50 60 70 80 90 100
0.0 2.0x10¹¹ 4.0x10¹¹ 6.0x10¹¹ 8.0x10¹¹ 1.0x10¹² 1.2x10¹² 1.4x10¹² 1.6x10¹²
Photon flux @100mA / s-1
Photon energy / eV
(b)
25 30 35 40 45 50
2x10¹⁰ 3x10¹⁰ 4x10¹⁰ 5x10¹⁰ 6x10¹⁰ 7x10¹⁰ 8x10¹⁰ 9x10¹⁰ 1x10¹¹ 1x10¹¹
Photon flux @100mA / s-1
Photon energy / eV
(a)
Fig. 3.4. Measured photon flux from the energy range 25 to 150 eV by utilizing Dragon type grazing incidence monochromator. Panels (a), (b), and (c), respectively, show the photon fluxes obtained by utilizing the gratings G3, G2 and G1, at electron ring current 100 mA.The deeps at hv
~100 and 110 eV are assingned to the absorption Thickness monitor
Sample chamber
Repeller Extractor
electrode
Chapter 4
4. Absolute Total Photoionization Cross Section of C60in the Range of 25 - 120 eV
[J. Phys. Soc. Jpn 77 (2008) 014302-1-5] 4.1. Introduction:
The interaction of C60 with high-energy photons has attracted considerable attention, since C60 provides a unique molecular system characterized by an exceptionally stable electronic structure associated with dense and highly degenerated molecular orbitals and by extremely large vibrational degrees of freedom. Many groups have measured the relative photoionization cross section of C60+ from C60by means of mass spectrometry in the extreme UV region [1-8].Some authors have reported [1,4-9] that this cross section curve shows peaks and shoulders at photon energies below hv ~ 50 eV, reflecting the molecular character of C60in its valence photoionization. In contrast, the yield curve above ~ 50 eV appears to resemble the absorption cross section of an isolated carbon atom.
In 2004, Kou et al. [5] measured relative partial cross sections for production of singly and doubly charged ions from C60 at hv = 25 - 150 eV. From the sum of the two partial cross sections, they derived a relative total photoionization cross section of C60. This total cross section may accord with the photoabsorption cross section of C60, since the photoionization quantum yield is considered to be nearly equal to unity in this hν region [5,10] and the contribution of triply or highly charged C60z+is much smaller. Nevertheless, the total cross section proposed by Kou et al. [5] was not proportional to the theoretical absolute photoabsorption cross section of C60 obtained
detection efficiency of the ion detector on the mass-to-charge ratio (m/z) and concluded that the relative partial cross section for double photoionization of C60
should be about one third as large as Kou et al. had expected. In this connection Reinköster et al. [6] and Juranic et al. [7] have reported that the sum of the relative partial cross sections for C60z+ (z = 1-3) from C60 is consistent with the photoabsorption cross section by Colavita et al. [9].
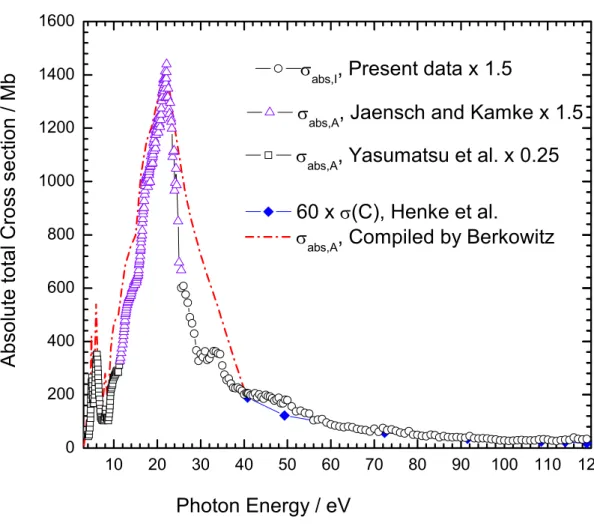
To obtain an absolute photoionization or photoabsorption cross section curve of C60 is another important issue that still remains to be settled. Generally speaking, if the sample is nonvolatile and its vapor pressure data is unreliable, one should be confronted with many difficulties in accurately estimating the absolute number density and effective path length of the interaction region in a windowless sample gas chamber. Actually there exist only a few experimental works on the measurements of absolute total photoionization cross section σabs,I and absolute photoabsorption cross section σabs,A of C60 in the extreme UV region [2,11-14]. In 1999, Berkowitz examined a σabs,A spectrum of C60 in the energy range of 3 - 340 eV by compiling the experimental cross section data then available [10]. In 2000, Jaensch and Kamke [12,13] determined the σabs,A curve at the photon energy range from 10 to 26 eV by a photon attenuation method, using a gas chamber filled with C60 vapor and applying the Lambert-Beer law (gas chamber technique). Their cross section data were significantly lower than those compiled by Berkowitz [10] at hv = 10 - 26 eV. For instance, the cross section value at hv = 24.5 eV by Berkowitz was 1100 - 1200 Mb and that by Jaensch and Kamke was approximately 650 Mb. In 2004, Mori et al. carried out mass spectrometric study of C60 using synchrotron radiation and obtained a σabs,I curve (~σabs,A) at hv = 24.5 -150 eV from the ion yields [14]. Their cross
section value was 762 Mb at hv = 24.5 eV, which lies between the cross sections reported by the former two papers.
The analysis conducted by Mori et al. [14]was based essentially on the data of Kou et al. [5], i.e., the partial cross sections for the production of singly and doubly charged ions from C60. Kou et al., however, neglected both the m/z-dependence of the detection efficiency η and the contribution of triply charged ions. It is therefore likely that σabs,I of Mori et al. in a higher hv region deviates from the proper total photoionization cross section. In the present paper, we will reevaluate σabs,I from hν = 25 to 120 eV by taking account of of the ion detector. Introducing a plausible functional form of may bring about an appreciable modification of the relative partial cross sections for the doubly and triply charged ions. Eventually, σabs,I curve of C60 should be substantially modified. I will also present the oscillator strength distribution curve over a wide energy rang from 3.5 to 119 eV by combining the present σabs,I and previously published σabs,A curves.
4.2. Methodology
The experimental setup for photoionization mass spectrometry of the fullerenes which was employed in this experimental work has been described briefly in the chapter three of this thesis and described in detail in the Ref. (15).
In order to estimate the absolute partial cross section σabs(z+) for the formation of the ions in a charge state z from C60 the following expression has been utilized:
) C (
1 )
) ( (
60 abs
abs Φ ⋅ +
= +
+ z
F nL
z z R
η
σ τ (1a)
) C (
1 )
(
2 2
⋅ +
Φ
= + B z
FDS Ll
T k AS z R
η
π (1b)
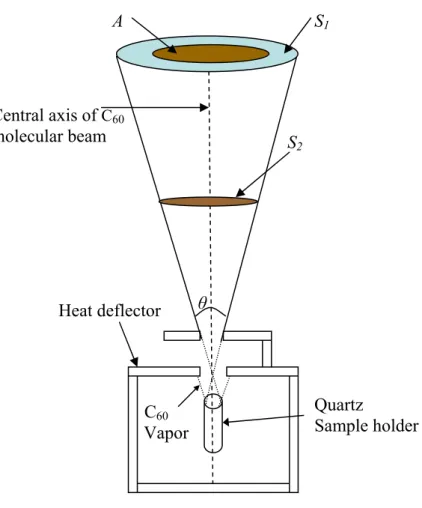
Here, R(z+) is the signal count rate of the photoions in a charge state z, Φ is the photon flux of synchrotron radiation, n is the number density of C60in the ionization region, L = 10 mm is the length of the ionization volume along the light path, F is the repetition rate of the pulsed electric field, τ is the average residence time of the ions in the ionization volume under the field free condition, abs(C60z+) is the absolute overall detection efficiency of the apparatus for C60z+, A is the effective area of the thickness monitor, S1 and S2 are the circular cross sections of the molecular beam at the thickness monitor and the light path (shown in Fig. 4.1), respectively, kB is the Boltzmann constant, T is the absolute temperature of the sample holder (quartz tube), l is the length of ionization volume along the molecular beam path, and D is the mass deposition rate of the thickness monitor. In eq. (1a) the physical quantity having the largest uncertainty is the number density n of the C60 vapor in the ionization volume. We derived eq. (1b) on the presumption that the molecular beam is expanded conically from the circular hole of the heat reflector in an effusive-flow condition [12,14,20,21] with a diverging angle (see Fig.4.1). Detailed derivation of eq. (1b) from eq. (1a) is given in appendix 1.
In the earlier work by our group [14], the detection efficiency of the ions was assumed to be constant and substituted that of Kr ions for abs(C60+) and abs(C602+) in order to evaluate σabs(z+). However, recently, it was recognized that corrections for the m/z- dependence of the detection efficiency are critical to obtain accurate cross sections for photoionization of fullerenes [8]. In the present study, an evaluation of
abs(C60z+) was made with the help of an empirical formula proposed by Twerenbold et al. [8,22] of the form
⎥⎥
⎦
⎤
⎢⎢
⎣
⎡ ⎟
⎠
⎜ ⎞
⎝
−⎛
−
=
5 . 3
exp 53
1 v
η . (2)
Here, v denotes the velocity (in units of kms-1), of the ion impinging on the entrance surface of the MCP assembly.
To inspect the applicability of the formula to our setup in the present study, first, the absolute overall detection efficiencies abs(Rgz+) are experimentally determined of our mass spectrometer for singly and doubly charged photoions produced from three rare gases (Rg = Ar, Kr, Xe) as
) Rg (
1 )
, Rg ( )
( ) 2
Rg (
Rg abs Rg
2 / 3
abs +
+ ⋅
Φ ′
⋅ +
= B z
z
lF L
z R P m
T k π σ
η . (3)
Second, a functional form of absfrom the least-squares fitting of the data points of
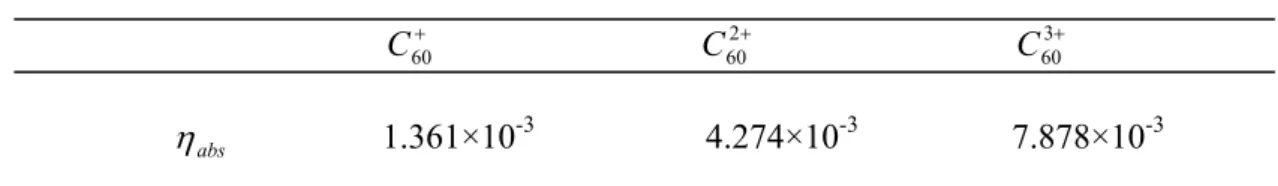
abs(Rgz+) is determined to the proposed formula (eq. 2). Here, R(Rgz+) is the signal count rate of Rgz+produced from Rg, mRgis the mass of a rare gas atom, and PRg is the sample pressure in the ionization region. The length of the ionization volume L′ along the light path differs from L for C60in eq. (1b). The partial cross sections σabs(Rgz+) for the formation of singly and doubly charged rare gas ions are taken from the literature [23].The abs(C60z+) values for C60+, C602+, and C603+are calculated using the formula of Twerenbold et al. and summarized in Table I. The overall detection efficiency is crucially dependent on m/z, since the ion acceleration voltage of 2.1 kV is not sufficient for a saturated operation of the MCP assembly. We used the
abs(C60z+) values in Table I to evaluate the absolute partial cross sections from eq. (1b) for the formation of the ions in a charge state z from C60.
4.3. Results and Discussion 4.3.1 Photoionization cross section
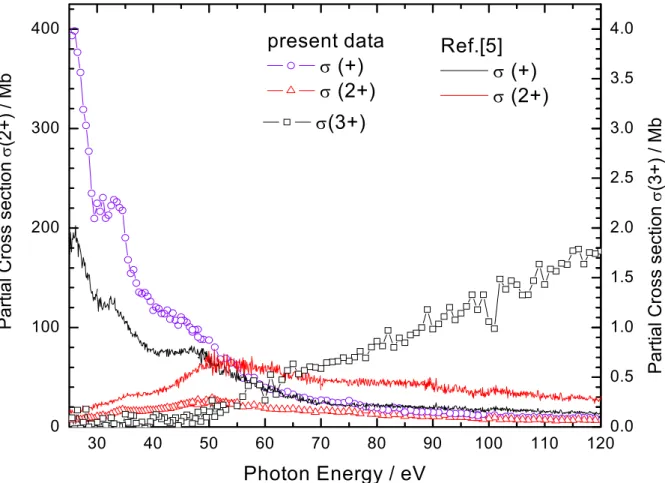
The absolute partial cross sections σabs(+), σabs(2+), and σabs(3+) calculated from eq. (1b) are represented, respectively, by circles, triangles, and squares in Fig.
σ
maximum at hv ~ 20 eV [1], and thereafter tends to decrease with increasing hv. Moreover, the curve displays several fine structures such as the two peaks at 26 and 34 eV and the flat area ranging 40–50 eV. These structures originate from ionization via the shape resonances as single electron excitation to vacant orbitals [4]. (It is worthwhile to clarify that we have observed these features (fine peaks at hv = 26 and 34 eV) repeatedly even after normalizing our photoion counts to the photon flux measured by using gold mesh. Thus these structures are not artifact as claimed by Scully et al. [24].) The σabs(2+) curve shows a broad maximum of 24.8 Mb at hν ~ 50 eV above which it monotonically decreases. In contrast, σabs(3+) has an onset at around 40 eV and steadily increases with hν. Each partial cross section includes the contribution of not only the parent but also fragment ions produced by the sequential loss of a C2unit. Hence, it is equal to the cross section involving all the ionic species in a particular charge state. The solid and dotted curves in Fig. 4.2 show the relative partial cross sections for the formation of singly and doubly charged ions, respectively, reported by Kou et al. [5]. The former curve is normalized to σabs(+) at hν = 80 eV. At all photon energies, the dotted curve is noticeably higher than σabs(2+), because Kou et al. disregarded the m/z dependence of the overall detection efficiency of the apparatus.
In Fig. 4.3, open circles represent the sum of σabs(+) , σabs(2+), and σabs(3+) which is nearly equal to σabs,I.Figure 4.3 also contains the σabs,Iand σabs,Acurves reported by Reinköster et al. [6]and Colavita et al. [9], respectively. The dashed curve by Reinköster et al. was normalized to σabs,Iby Yoo et al. at 40.8 eV [2],while the dotted curve by Colavita et al. is based on the theoretically determined absolute cross section. The present curve of σabs,I= σabs(+) + σabs(2+) + σabs(3+) is in fair agreement with the dashed and dotted curves in the hν range from ~ 45 to 120 eV. This may