論 文
Welfare Assessment of Entry of New Retail Formats
and Deregulation for Restriction
on Large Retail Scale Stores in Japan
†Keiichiro HONDAa, Toshiyuki MATSUURAb,*, Takeshi MIZUTAc
Abstract
This study attempts to measure the welfare gain caused by new retailer entries and the deregulation of entry restriction. In 1990s and 2000s, the retail sector in Japan experienced significant reallocation dynamics. Two retail formats have expanded their market share: one is specialty supermarket stores that expanded their market shares partially due to the deregulation of large-scale stores, and the other is convenience stores that take advantage of their distinctive service quality and efficient operation system. We estimate the consumer benefit by incorporating the differences in service quality as well as differences in price among retail formats and demonstrate that welfare improvements are primarily explainedby changes in price andservice quality.
JEL Classification Code:L13, L81, L51
Keywords:Competition, Welfare Analysis, Retail Industry, Entry Regulation
†This research is conducted as a part of the project prepared by Economic and Social Research Institute ( ESRI ) of Cabinet Office of Japan. We thank to Kyoji Fukao, Colin Hottman, Paul Schreyer, Shigeru Sugihara, Kohei Kawaguchi and other seminar participants at ESRI for their helpful comments. The data used in this paper is provided by Ministry of Economy, Trade and Industry and Ministry of Internal Affairs and Communications through ESRI. This paper is the extended version of one of the authorʼs working paper, Matsuura and Sunada (2011). This paper uses the updated and more detailed sales and price data in more detailed regional classification. Furthermore, this paper uses the different specification of utility function. Keiichiro Honda gratefully acknowledges the financial support from the Japan Society for Promotion of Science (Grant-in-aid for Young Scientist B 26780152). The view expressed in this paper are solely those of the authors, and neither represent the organization to which the authors belong nor the Cabinet Office.
a Prefectural University of Kumamoto
b Keio University
c Hitotsubashi University
* Corresponding author; Keio Economic Observatory, Keio University, 2-15-45 Mita, Minato-ku, Tokyo, 108-8345, Japan, TEL:+81-3-5427-1479, FAX:+81-3-5427-1640.
小売業における新業態参入と大型店舗の規制緩和の厚生評価
本田圭市郎・松浦寿幸・水田岳志
〈要 旨〉
本研究は、我が国のサービス業で大きなシェアを占める小売業において、新業態の 参入や参入規制の緩和が、消費者の経済厚生に与えた影響の測定を試みるものであ る。1990 年代から 2000 年代にかけて、日本の小売業は二つの業態のシェア拡大とい う劇的な変化に直面した。一つは、大型店への規制緩和により拡大したスーパーマー ケットであり、もう一つは独自のサービス品質と効率的なオペレーションを行うコン ビニエンスストアである。本研究では、これらを含めた小売業内の業態間で価格や サービス品質が異なることを考慮した需要関数を推定し、消費者余剰の変化を測定し た。その結果、1990 年代と 2000 年代の消費者余剰の変化は、主に価格とサービス品 質の変化によって説明され、特に価格の寄与が大きいことが明らかになった。規制緩 和は、小売店の価格水準の低下を通し、消費者余剰へ影響していると考えられる。
JEL 分類コード: L13, L81, L51
キーワード:競争、厚生分析、小売業、参入規制
1.Introduction
The entry and exit dynamics of firms are considered a major source of economic growth. Entering firms often have new innovative business models and relatively high productivity. Competition caused by a surge of entering firms not only stimulates incumbentsʼ incentive for innovation but also force inefficient firms to exit markets. In the service sector, it is known that the reallocation effects of entry andexit play an important role in productivity growth. For example, in the case study of the U.S. retail industry, Foster et al. (2006) investigatedthe impact of entry andexit on the aggregate-level productivity growth during the 1990s and showed that the relatively more productive entering retail outlets have displaced the less productive exiting retail outlets throughout the 1990s, accounting for the labor productivity growth during the decade.
In this study, we measure the welfare gain caused by the entry of new retailers in Japan. During the 1990s and2000s, the Japanese retail sector experienceda significant reallocation due to entry and exit dynamics. Two types of retail formats expanded their market shares throughout the 1990s. One was the mid-sized specialty supermarket store featuring discount pricing strategy that expanded its market share partially due to the deregulation of entry restriction for large-scale stores in the late 1990s. The other retail format that expandedits share was the so-calledconvenience store that offeredinnovative services by making active use of information technology. In this study, we estimate the welfare impact of the entry of these new retail formats.
However, measuring the performance of service industries, such as the retail industry, is fraught with many difficulties. Within the retail industry, for example, each firm differentiates its service by offering a distinct range of products with additional service. Since entering firms often bring new innovative services, it is necessary to measure accurately the quality of service provided by each firm in order to assess the impact of the entry of new service providers. Moreover, as a result of product differentiation, each firm is likely to have some market power. In such cases, the hedonic method, which is the most commonly used approach to measure quality under the perfect competition assumption, cannot be appliedto this sector since the hedonic approach is applicable only for perfect competition setting.
In the case of Japanese retail industry, the two entering retail formats mentioned
above adopt different policies: while specialty supermarket stores use discount pricing strategy, convenience stores feature service quality. Thus, to measure the welfare gain causedby new retailer entries, we needto employ a model that accommodates the differences in price and quality of output. In fact, there are many empirical frameworks that enable us to estimate the demand structure in differentiated product settings by utilizing the market-level or aggregateddata. The most well-known framework is the logit family model. Berry ( 1994 ) introduced a useful empirical framework using extreme-value distribution of consumer preferences, and Berry et al. (1995) applied the random coefficient model to the U.S. automobile market. In this study, we employ the nestedlogit demandfunction for retailing services andquantify welfare improvement. In previous studies, Sunada (2010) estimated the changes in service quality andconsumer welfare for shopping using the CES demandfunction. However, his specification does not take into account regional factors and market dynamics such as changes in number of outlets. We extendSunadaʼs specification to incorporate the regional differences in price and service quality, while estimating consumer benefits from increasedmarket dynamics.
Welfare assessment of the entry of new retail formats will provide us with policy implications. In Japan, although the entry of large-scale stores hadbeen restrictedby the Large Scale Retail Store Law (LSRS Law, hereinafter) until the early 1990s, it was gradually relaxedandfinally repealedin 2000. However, the impact of deregulation seems to have been limited. While specialty supermarket stores ─ relatively large discounting foodretailing stores ─ have increasedtheir market shares, Generalized Merchandise Store (GMS), which have much larger floor space and deal with a wider range of products, failedto increase its market share. In fact, Carrefour andWal-Mart, the French andthe U.S. multinational retail chains, struggledin the Japanese retail market because of low profitability. Carrefour exitedJapan in 2005, andWal-Mart has not yet succeeded in expanding its market share. Based on these facts, some economists argue that the abolition of the LSRS Law has not createdenough impact on the Japanese retail industry. In this study, by measuring consumer preferences with regardto price andservice quality, we also assess the impact of deregulation and explore why gigantic GMSs, such as Carrefour andWal-Mart, failedto dominate the Japanese retail market despite the abolition of the LSRS Law.
The structure of this paper is as follows. We introduce the historical and institutional background of the Japanese retail industry in the next section. We present our model
in section 3. In section 4, we explain our data set. Section 5 provides estimation results andsection 6 discusses the implications from estimation results. A summary and conclusion are presentedin the final section.
2.Background
There is a conventional notion that the Japanese retail industry is quite peculiar. This is because Japan has more retailers per capita than other countries. Most stores are small andfamily-ownedfirms, the so-calledMom andPop stores. For example, according to Ito (1992), while retail store per 1000 residents (retail density) for the U. S. andGermany was 8.3 and6.7 respectively, it was 14.5 for Japan in 1982. Workers per retail store for Japan, Germany, andthe U.S. were 3.7, 5.9, and8.1, respectively. Throughout the 1980s and 1990s, retail density in Japan has been gradually decreasing andreached11.3 in 1997, which was still quite high since the U.S. retail density in 1997 was around6.0.
The discussion on these facts has attractedattention from researchers andpolicy makers since the 1980s. There are two opposing views on the reason for the large number of retailers in Japan. The first view is that since transportation andinventory costs for consumers are high in Japan, they prefer shopping at nearby small retail stores almost every day. For example, Flath ( 1990 ) andFlath andNariu ( 1996 ) empirically investigatedthe effect on retail density using passenger car per capita and the average housing size as proxies for consumersʼ transportation andinventory costs. Their research demonstrated that Japanʼs retail density is not exceptionally high.
The secondview is that entry restrictions on large-scale stores have affected consumer behavior, andtherefore consumption tendencies andpreferences have been distorted. For example, McCraw and OʼBrien (1986) argued that since public transportation has been well developed, there is no reason for consumers to choose nearby small retailers. They attributedhigh retail density to entry restrictions imposedby the LSRS Law on large-scale stores. In fact, Nishimura andTachibana (1996) analyzedthe effects of the LSRS Law on retail store productivity andshowed that LSRS Law has brought some distortions in the Japanese retail market.
In the 1990s, the trendchangedfrom protectionism to deregulation as a result of the
“Japan-U.S. Structural Impediments Initiative,”which was aimedat opening up the Japanese retail market andpromoting competition. In 1994, the LSRS Law was eased
to give more freedom for new retail stores with less than 1000 m2of floor space to entry the retail market. Finally, in 2000, the LSRS law was completely repealed1.
Along with the process of deregulation, the number of large stores has increased in the late 1990s. Figure 1 presents the transition of the number of foodandbeverage retail outlet with more than 500 m2of floor space from 1985 to 2007. Especially, we see the surge of entry of large outlets with more than 1,000 m2of floor space just after the relaxation of LSRS law, namely 1994.
Figure 2 indicates the changes in sales shares among food retail formats. Two retail formats expanded their market share during regulatory transition periods: specialty supermarket stores andconvenience stores2. Specialty supermarket stores are mid-sized stores that occupy more than 250 m2floor space andprimarily deal with foodproducts. Since they are relatively large stores, their expansion might be attributedto by the deregulation. Convenience stores are relatively small stores that operate for more than 14 hours a day and deal with not only food products but also a broadrange of items. The shares of specialty supermarket stores andconvenience stores have substantially increasedfrom 33.0% to 44.0% andfrom 10.2% to 14.4%, respectively. On the other hand, the share of Generalized Merchandized Stores (GMS) that have a floor space of more than 3000 m2anddeal with a broadrange of items, has remainedunchangedthrough the late 1990s and2000s3.
1 For details of LSRS Law, see Appendix A.
2 The definition of retail formats are summarized in Appendix B.
Figure 1:The number of Large Stores from 1985 to 2007
2125 2125
3720 3720
2260 2260 25572557
3122 3122
3911
3911 44814481 41894189 43624362 6389 6389 5476 5476
6106 6106
7112 7112
7054 6765 7054 6765 3998
3998 4888 4888
3761 3761
Source: Census of Commerce(Ministry of Economy, Trade and Industry)
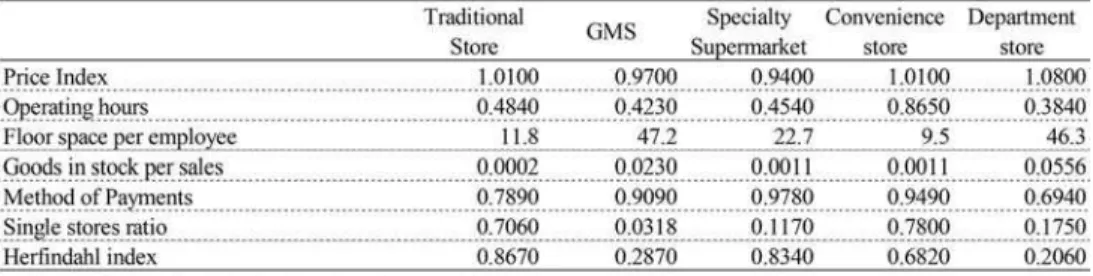
The emergence of specialty supermarket stores may be attributedto their price policy as well as the deregulation. Table 1 shows a substantial price gap between retail formats. While specialty supermarket stores attract consumers by offering products with the lowest prices, convenience stores offer relatively high prices.
Convenience stores in Japan are quite different from what wouldbe expectedin Europe andthe U.S. For example, while the majority of small stores cannot adopt advanced information technology in Japan, major convenience store operators actively make use of these technological advances such as the POS System, which enables them to organize an efficient distribution system. Currently, major chains organize deliveries to each retail outlet 3 to 5 times a day and provide consumers with fresh and sometimes highly perishable foodproducts. Some convenience store operators collect records of each customerʼs gender and age for each purchase, and make active use of
3 Although GMS and Department stores deal with not only food and beverage but also clothing, furniture, and other household goods, sales data in Figure 2 are restricted to sales of food and beverage products.
Figure 2:The sales share of food and beverage by retail formats
Note: See Appendix B for the definition of retail formats. Table 1:Price gap by products and retail formats
Source: National Survey of 1997, Ministry of Internal Affair and Communication. Note: For the details of the definition of retail formats, see Appendix B.
this information for their original brand product development and merchandising. According to Larke and Causton (2005), Seven-Eleven Japan, the largest convenience store operator, sells its own branded merchandise, which amounts to 50% in total sales. Moreover, long business hours and additional services are also fundamental to convenience storesʼ operation. In Japan, most convenience stores generally operate 24 hours a day, and offer additional services such as making photocopies, photo developing, postal package handling, and payment of utility charges.
These dynamic market transitions affect consumer welfare. However, previous studies have not empirically examined their impact during periods of regulatory transition. Since previous studies such as Flath (1990), Nariu and Flath (1996), and Nishimura and Tachibana (1996) are all cross sectional studies, it does not distinguish the cause from the effect. Our welfare assessment basedon the structural estimation of demand function for shopping will reveal how the dynamics of entry and exit has impactedthe retail market andto what extent entry restrictions have been influential.
3.Model
Consumer Choice
We suppose that consumers have a choice between two levels of differentiated retailing services. The structure of consumer choice is presentedin Figure 3. First, an individual consumer decides whether to purchase a product from each of g=1,…, G groups ( for example, GMS, specialty supermarket store, or convenience store ). Second, the consumer decides from which outlet j=1,…, N in that group to purchase. Suppose that the outlets available in each group g are denoted by J⊂1, … , N. Utility for consumer h is given by the following equation:
u=βz−αp+ξ+ε α>0. (1)
where p is the price of retail outlet j. AndWhile z is a vector of the observable characteristics of service quality for retail outlet j, ξis unobservable service quality for outlet j.
Following from Berry (1994), the random error term εis defined as follows:
ε=ζ+1−ρe, for j∈J, (2)
where the errors e are iidextreme values. ζis common random variable to all the products h in group g. And ρ is the parameter which induces a correlation between the products in group g.
Following Berry (1994), we obtain the share of retail outlet j as
s=e
D
× D
∑D
, for j∈ J (3)
where the term D=∑e is the “inclusive value.” The first term on the right hand side of equation (3) is the share that an individual will chose the outlet j∈Jin retail group g. The secondterm is the share of choosing any outlet from group g.
Here, we assume the equality of price p, andservice quality zand ξwithin group g; in other words, we assume p=p=p, z=z=zand ξ=ξ=ξfor j, k∈J.4Then, we obtain
D=∑e =e N
where Ng is the number of outlet in retail group g. The aggregatedmarket share for type g retail group is derived as follows:
s=sN= e
N
∑eN
. (4)
We introduce outside goods that have u=0 andinclusive value D=1. From equation (3), itʼs share can be written as s= ∑D . Taking log of the ratio of sto s, we obtain
ln s−ln s=β z−α p+ 1−ρ ln N+ξ. (5)
where ξrepresents the unobservable service characteristics of type g retail format, which is a random variable with the mean value of zero. In our regression analysis, we treat this term as an error term. The dependent variable is the difference of logged share of retail format g and logged share of outside goods. Independent variables include the price, quality of the service and the number of outlet for retail format g. Note that if ρ=1, the model is degenerated into logit model and increase in Ndoes not affect the share of group g.5On the other hand, when 0 <ρ<1, the sales share of group gincreases as entry of new outlets in group g.
4 This specification was proposed and used by Berry and Waldfogel (1999), which quantifies the social inefficiency of free entry in radio broadcasting.
5 When ρ=1, increases in Naffects only the sales share of outlet j in each group of retail format g.
Extension: Welfare
We now demonstrate how we can estimate the changes in consumer welfare that arise from the expansion of various services. The change in consumer surplus that results from a change in the vector of price andquality, namely from uto uʼ is given by
ΔCS=1
α ln 1+∑
e
′N
−ln 1+∑eN ., (6)
where u=β z−αp+ξ.6 Using estimatedcoefficients, β, α andresidual ξ, this framework enables us to decompose the source of the changes in consumer surplus into three factors; changes in price, quality andthe number of outlet. As we mentioned, the deregulation promotes the entry of large retail stores. We can access the impact of the deregulation by comparing the consumer surplus with and without increases in the number of GMS andSpecialty supermarket stores.
4.Data and Estimation Methodology
Our dataset is the regional data set for food retailing outlets covering 1997, 2002, and 2007. The primary data source is the Census of Commerce, which is compiledby the
6 The residual of equation (5), ξis considered as one of components of quality. This treatment is often used in previous studies such as Khandelwal (2010).
Figure 3:Structure of consumersʼ choice
Ministry of Economy, Trade and Industry. The Census of Commerce covers all the establishments belonging to the wholesale andretail industry. From the Census, we obtained the data for the sales at six-digit product level and establishment characteristics. One limitation of the Census is the lack of price information. Therefore, we referredto the National Survey of Prices ( Ministry of Internal Affairs and Communications), which provides the commodity-level price information. Both data sets are available at establishment level. However, Since National Survey of Price is sampling survey, it is difficult to match these two statistics at establishment-level. Thus, we aggregate both data sets at regional level. Besides, the Census of Commerce andthe National Survey of Prices use the different definition of retail formats. When aggregating establishment-level data, we adjust the retail format type for National Survey of Prices to match the one in the Census of Commerce.7As for price data, we first calculate commodity-level average price by region, retail format and year. Then, Price indices by region andretail formats are constructedby aggregating the commodity-level price with the weight of the Consumer Price index (as compiled by the Ministry of Internal Affairs andCommunications). Our regional unit is Metro- politan Area which is defined in National Survey of Price by dividing each prefecture into three or four areas andincludes 189 areas.
For market share, we use sales for foodproducts by each retail format because we focus on the choice behavior of foodretailing stores. Value of sales is deflatedby price index constructed by National Survey of Price. As for the share of outside goods, we use the ratio of the expenditure for eating-out in total foodrelatedexpenditure by prefecture andyear, which is obtainedfrom Family Income and Expenditure Survey (Ministry of Internal Affairs andCommunications).
For service quality indicators, we referred to previous studies that address the definition of retail output, e.g., Oi (1992) andBetancourt andGautschi (1988). In these previous studies, retail outputs are considered as a mix of distribution services, such as assortment andassurance. Betancourt andGautschi (1988) discussedthe economic function of retail organization andproposedthe concepts of distribution service from an empirically-based perspective. According to their definition, distribution service is classifiedinto the following four categories: (1) accessibility of location, (2) assort- ment, (3) assurance of product delivery in the desired form and at the desired time, (4)
7 For details on our definition of retail formats, see Appendix B.
information and ambience. We refer to these concepts andconstruct the following service quality indicators based on different retail format characteristics: operating hours, goods in stock per sales, broad assortment index, single store ratio, floor space per employee, andratio of cash payment to total sales.
As proxy for time accessibility or assurance of product delivery, we use “operating hours” which is normalized by dividing 24 hours. We expect “operating hours” to have a positive effect on market share. “ Goods in stock per sales ” is the inverse of the merchandise turnover ratio, and is defined as the ratio of value of stocks to sales of products. Low “goods in stock-sales” ratio implies adoption of just-in-time delivery system, which enables retailers to provide fresh food products to customers. For assortment, we prepare a herfindahl index for products sales which is defined as the following;
HI=∑ω,
where ω indicates the sale share of products k for retail outlet j8. The more retail outlets deal with the product lines, the index HI will approach 0. On the other hand, those retail outlets dealing with only 1 product line have HI=1. Product information is available at six-digit level. This index is calculated by each establishment, and aggregatedby region andretail formats with the sales share weight. This index covers not only foodandbeverage products but also all the commodity line, such as apparel products, drags and toiletries and other miscellaneous products.
“Single store ratio” is defined as the share of single store to total number of outlets by retail format, region andyear. It is expectedto have negative effects on market share, because single stores are inferior to multiple stores in terms of providing price information, availability, andother characteristics. “Log of floor space per employee” is proxy for broad assortment services or information supply to customers. Retail outlets with larger floor space offer a broader variety of products. On the other hand, in order to provide consumers with sufficient price and product information, managers have to increase the number of employees. The expectedsign of the coefficient will be positive or negative depending on consumer preferences. “Ratio of cash payment to total sales” is defined as the ratio of cash settlement to total sales, which suggests an index for a variety of payment. While the majority of non-traditional or chain stores usually offer a
8 Product line is defined according to the 2-digit commodity code.
variety of payment methods, such as debit card, credit card, or prepaid electric money card, traditional stores do not. Thus, a negative sign is expected for the coefficient. Finally, to capture unobservable format-specific service quality, retail format dummy variables are included in the equation. Finally, to capture the service characteristics common across sales formats that adopt self-service system, such as GMS, Specialty supermarket stores, and convenience stores, we include the dummy variable,
“Self-service format.”
Table 2 provides a summary of the variables we use as service characteristics by retail formats. Three items are noteworthy. First, while Convenience stores have the secondhighest price level, their distinctive services are reflectedby longer operating hours and low goods in stock per sales. Second, looking at floor space per employee, there are clear differences between large and small retail formats. While floor space per employee for GMS and Department store exceeds 40, those for Traditional stores andConvenience stores are 11.8 and9.5, respectively. Third, Traditional stores offers higher price andthey are inferior to other retails formats in terms of service quality, such as operating hours.
Since an error term, which is the unobservedservice characteristics, may correlates with price andthe number of outlets, the price andnumber of outlets are consideredas endogenous variables and OLS estimates are not consistent. Therefore, instrumental variables are needed. As discussed in Berry, et al. (1995), Hausman (1997), andNevo ( 2001 ), we use standard instrumental variables, such as (1) the mean of service characteristics of other types of retail formats and(2) degree of competition in their local market; the number of outlets in other sales format locating in same area. As for the first instruments, since we assume that retailing firms determine their service characteristics before their location decisions and subsequent price competition, we
Table 2:Average service characteristics for food retailing outlets in 1997
consider their competitorsʼ service characteristics are exogenous. The latter variable is an instrumental variable for the loggednumber of outlet, lnN. This measure will be correlatedwith the loggednumber of outlet, but uncorrelatedwith the unobservable service characteristics, ξ.
5.Estimation Results
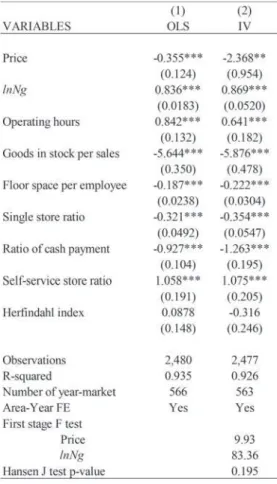
The estimation results are presentedin Table 3. We estimate the model using both OLS (Column 1) and GMM (Column 2) methods including retail format dummies, and area-year dummies. Three things are noteworthy. First, OLS estimates for the
Table 3:Estimation result of market share equation
Note: 1)Figures in brackets are standard errors. 2)***, **, and * represent level of significance at 1%, 5%, and 10%, respectively.
coefficients of price are smaller than those by GMM in absolute value, suggesting that OLS estimates may suffer from endogenous bias. Second, the coefficients for log of number of outlets, which correspondto 1−ρ, are all estimatedbetween 0 and1, which is consistent with our theoretical framework. Third, first stage F test statistics are sufficiently high andthe test of over identification is not rejectedfor column 2.
Focusing on other variables in column 2, we can observe that the operating hours has significantly positive impact on market share. Coefficients for Goods in stock per sales, Floor space per employee, Single store ratio andRatio of cash payment are all negative andsignificant. A negative coefficient for goods in stock per sales suggest that since low goods in stock per sales implies the adoption of just-in-time delivery systems, consumers highly value retailing outlets that provide fresh food products. The coefficient for floor space per employee, which is also negative andsignificant, may implies that Japanese consumers prefer to smaller stores.
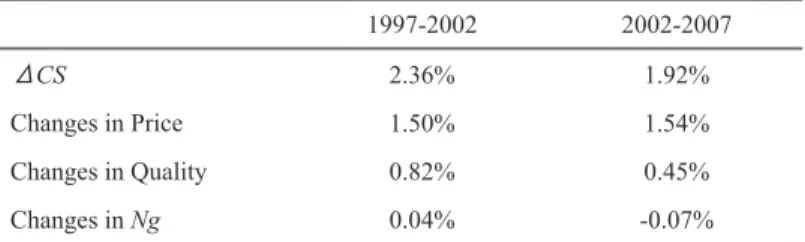
Table 4 presents the changes in consumer surplus andits decomposition. The changes in the consumer surplus from 1997 to 2002 andfrom 2002 to 2007 are 2.36% and1.92%. We decompose the changes in consumer surplus into changes in price, quality andthe number of outlets by holding two out of three attributes constant. For the periodbetween 1997 and2002, more than half of which are explainedby changes in price, which amounts to 1.50 percent point. As we mentionedin Figure1, we have seen the surge of increase in the number of retail store whose floor space is more than 500 m2andless than 1000 m2between 1997 and 2002. Price may decrease due to increases in competitive pressure.
We also foundsignificant contribution of changes in quality (0.82 percent point) from 1997 to 2002. This result may indicate increases in new retail format such as convenient stores contribute to consumer welfare. On the other hand, changes in the number of outlets was 0.04% between 1997 and2002 and-0.07% between 2002 and 2007.
Table 4:Decomposition of Annual Average Changes in Consumer Surplus
Changes in Price Changes in Quality Changes in Ng
䂴CS 2.36% 1.92%
1.50% 0.82% 0.04%
1.54% 0.45% -0.07% 2002-2007 1997-2002
6.Discussion
Combinedwith the estimation results andservice characteristics by retail format in Table 2, the reason why GMS failedto expandmarket share despite deregulation can be explainedby insufficient price competitiveness andfailure to differentiate its service characteristics from those of specialty supermarket stores. For example, in Table 2, while the price index for GMS is 0.97, for specialty supermarket stores it is 0.94. The indices for operating hours and goods in stock per sales for GMS are also the same with those for specialty supermarket stores. Negative coefficient on floor space per employment reflects the fact that Japanese consumers do not place particular importance to huge floor space for daily food shopping. According to Aoyama (2007), retailing MNEs such as Wal-Mart andCarrefour, have succeededin expanding their markets overseas by collaborating with manufacturers and adopting factory direct models, which enable them to undercut competitorsʼ prices. However, in case of Japan, their offers were refusedby Japanese manufacturers, andthey failedto adopt the model. Thus, both Carrefour andWal-Mart hadno cost advantages in Japan. Moreover, taking advantages of huge floor space, Carrefour and Wal-Mart stuck to their low-cost operations, such as the stack-them-up-and-sell-them-cheap strategy, whereby products are displayed without being taken out of corrugated boxes. However, that strategy failedbecause Japanese consumers were not familiar with bulk purchase.
7.Concluding Remarks
In this study, we measuredthe welfare gain causedby the entry of new retailers. During the 1990s, the retail sector in Japan experiencedsignificant reallocation dynamics. Two retail formats expanded their market share. The first, specialty supermarket stores, partially expanded their market shares due to the deregulation of large-scale stores. The second, convenience stores, took advantage of their distinctive service quality andefficient operation system. In our analysis, since retail service providers usually differentiate their service quality, we incorporated the differences in their service characteristics as well as in their price; consumer benefit was measured by estimating the nestedlogit demandfunction.
Our results revealedthat changes in consumer surplus during the 1990s and2000s are predominantly explainedby changes in the price andquality of service. In particular, we observedthe significant contribution of changes in the price during the regulatory transition periodfrom 1997 to 2002. We foundthat the deregulation of entry restrictions forcedretail stores to lower their price level. Moreover, the result suggestedthat deregulation influences consumer surplus.
Furthermore, estimatedparameters for the demandfunction imply that Japanese consumers place more importance on long hours of operation rather than larger floor space for daily food shopping. This might be one of the reason why retailing MNEs, such as Wal-Mart andCarrefour, faceddifficulties in expanding market share in Japan. Although this paper provides thoughtful insights, various avenues exist for future researches. First, following Berry et al. (1995), with some additional assumptions on the competition among firms, marginal cost or markup can be recoveredfrom the estimateddemandfunction. Accessing the impact of deregulation on markup might be an interesting exercise. Second, using the quality indicator calculated by our demand estimates, we will be able to construct the quality adjusted price index and real output of retail service. Furthermore, we will be able to estimate a quality adjusted productivity indicator for the retail industry. Third, exploring the regional differences in the regulation of large-scale stores might provide policy implications. While large-scale store law was a nationwide regulation, additional entry restrictions were imposedby the local government in some cities andprefectures when the law of large-scale store was effective. Using the information on additional entry restrictions, one may be able to access the impact of deregulation at a regional level.
References
Aoyama, Y (2007). Oligopoly andthe structural paradox of retail TNCs: An assessment of Carrefour andWal-Mart in Japan, Journal of Economic Geography, 7 (4), 471-490. Berry, S. T. (1994). Estimating discrete-choice model of product differentiation, RAND
Journal of Economics, 25 (2), 242-262.
Berry, S. T., J. Levinsohn, andA. Pakes (1995). Automobile prices in market equilibrium, Econometrica, 63 (4), 841-890.
Berry, S. T., and J. Waldfogel (1999). Free entry and social inefficiency in radio broad- casting, RAND Journal of Economics, 30 (3), 397-420.
Betancourt, R. andD A. Gautschi, (1988). The economics of retail firms, Managerial and Decision Economics, 9 (2), 133-144.
Flath, D. (1990). Why are there so many retail stores in Japan? Japan and the World
Economy, 2 (4), 365-386.
Flath, D. andT. Nariu, (1996). Is Japanʼs retail sector truly distinctive? Journal of Com- parative Economics, 23 (2), 181-191.
Foster, L., J. Haltiwanger, andC. J. Krizan, (2006). Market selection, reallocation and restructuring in the US retail trade sector in the 1990s, Review of Economics and Statistics, 88 (4), 748-758.
Hausman, J. (1997). Valuation of new goods under perfect and imperfect competition, In T. F. Bresnahan and R. J. Gordon (Eds.), The Economics of New Goods. National Bureau of Economic Research Studies in Income and Wealth, 58, (pp. 207-248 ). Chicago: University of Chicago Press.
Ito, Takatoshi (1992). The Japanese Economy. Cambridge, Massachusetts: The MIT Press. Khandelwal, A. (2010). The long and short (of) quality ladders, Review of Economic
Studies, 77 (4), 1450-1476.
Larke, R. andM. Causton (2005). Japan: A Modern Retail Superpower. New York: Palgrave Macmillan.
Matsuura, T., and M. Sunada (2011). Welfare assessment of new retail formats: Evidence from Japanʼs retail industry, Keio-Kyoto GCOE Discussion Paper, DP2010-018. McCraw, T. K., andP. A. OʼBrien (1986). Production anddistribution: competition policy
and industry structure, In T. K. McCraw (Ed.), America versus Japan: A Comparative Study (pp. 77-116). HarvardBusiness School Press.
Nevo, A. (2001). Measuring market power in the ready-to-eat cereal industry, Econometrica, 69 (2), 307-342.
Nishimura, K. G., andT. Tachibana. (1996). Entry regulations, tax distortions andthe bipolarizedmarket: the Japanese retail sector, In R. Sato, R. V. Ramachandran andH. Hori ( Eds. ) Organization, Performance, and Equity: Perspectives on the Japanese Economy (pp. 1-57), Boston: Kluwer Academic Publication.
Oi, W. (1992). Productivity in the distributive trades: The shopper and the economies of massedreserves, In Z. Grilliches (Ed.), Output Measurement in the Service Sector (pp. 161-193), Chicago: University of Chicago Press.
Sunada, M. (2010). Measuring the cost of living index, output growth, and productivity growth of the retail industry: An application to Japan, Review of Income and Wealth, 56 (4), 667-692.
Appendix A:Historical overview of Large Scale Retail Law
In Japan, the business of large-scale retailers has been highly restrictedby law to protect the businesses of small-scale retailers. The protection of small retail businesses originatedfrom the “Department Store Law” establishedin 1937. Although the law was once repealedafter WWII by GHQ, it came to life again in 1956 in almost the same manner as before. In 1974, the law was enforcedas the “Large Scale Retail Store Law (LSRS law)” targeting not only department stores but also large super- stores. At the same time, the new law had the added purpose of restraining new entrants with large capital from abroad. The law hadnot only protectedsmaller businesses but also restrictedcompetition among large retailers through controlling the entry of new businesses.
In 1978, the law was reinforced. When a large-scale retailer started a new business in a certain area, it first hadto notify the Minister of International Trade andIndustry. The minister wouldthen investigate the potential effects of the new entry on small-scale retailers in that area. If the investigation detected potentially negative effects, the minister wouldurge the entrant to modify its business plan basedon factors such as floor space, business days, closing times, or the number of holidays.
The role of the minister was just to provide guidelines. Representatives in regional business districts carried out substantial adjustments. Furthermore, local govern- ments were allowed to impose additional entry regulations on large stores.
In the 1990s, the trendshiftedfrom protectionism to deregulation as a result of “The Japan-US Structural Impediments Initiative,” which aimed at opening up the Japanese market andpromoting competition. In 1994, the LSRS Law was easedto give more freedom to new entrants into the retail industry with less than 1000 m2of floor space. inally in 2000, the law was completely repealed.
Appendix B:Definition and Concordance of Retail Formats
(1)The definition of retail formats
Note
1 ) Self-service stores are defined as establishments that adopt the self-service system in 50% or more of the sales floor. The “Self-service system” means that the establishment meets the following conditions;
i) Merchandise is put on the shelf unwrappedor prepackagedwith price labeled on them.
ii) Shopping baskets or shopping carts are provided to customers. iii) Customers pay for all of the purchases at the check-out counters.
2) Department andGeneral Supermarkets are stores that retail clothing, food, and housing products, in which retail sales for each of these categories is over 10% but under 70%.
3) Specialty supermarkets are those stores which retail clothing, food, or housing products whose retail sales is 70% or over.
( 2 )Concordance table of retail formats between National Survey of Prices and Census of Commerce