Banking Crises: An Equal Opportunity Menace
Carmen M. Reinhart
University of Maryland, NBER and CEPR
Kenneth S. Rogoff
Harvard University and NBER
December 17, 2008
© 2008 by Carmen M. Reinhart and Kenneth S. Rogoff.
Abstract
The historical frequency of banking crises is quite similar in high- and middle-to-low-
income countries, with quantitative and qualitative parallels in both the run-ups and the
aftermath. We establish these regularities using a unique dataset spanning from Denmark’s
financial panic during the Napoleonic War to the ongoing global financial crisis sparked by
subprime mortgage defaults in the United States.
Banking crises dramatically weaken fiscal positions in both groups, with government
revenues invariably contracting, and fiscal expenditures often expanding sharply. Three years
after a financial crisis central government debt increases, on average, by about 86 percent. Thus
the fiscal burden of banking crisis extends far beyond the commonly cited cost of the bailouts.
Our new dataset includes housing price data for emerging markets; these allow us to show that
the real estate price cycles around banking crises are similar in duration and amplitude to those in
advanced economies, with the busts averaging four to six years. Corroborating earlier work, we
find that systemic banking crises are typically preceded by asset price bubbles, large capital
inflows and credit booms, in rich and poor countries alike.
JEL E6, F3, and N0
Carmen M. Reinhart
University of Maryland
School of Public Policy
and Department of Economics
4105 Van Munching Hall
College Park, MD 20742
and NBER
[email protected]
Kenneth S. Rogoff
Thomas D Cabot Professor of Public Policy
Economics Department
Harvard University
Littauer Center 232
Cambridge, MA 02138-3001
and NBER
[email protected]
*
The authors are grateful to Vincent Reinhart, Keyu Jin, Tarek Hassan, Vania Stavrakeva for
useful comments and suggestions on an earlier draft, and to Cesar Sosa, Chenzi Xu and Jan
Zilinsky for excellent research assistance.
Introduction
Until very recently, the study of banking crises has typically focused either on earlier
historical experiences in advanced countries, mainly the banking panics before World War II, or
else has focused on modern-day emerging market experiences.
1This dichotomy is perhaps
shaped by the belief that for advanced economies, destabilizing, systemic, multi-country
financial crises were a relic of the past.
2Of course, the recent global financial crisis emanating
out of the United States and Europe has dashed this misconception, albeit at great social cost.
As this paper will demonstrate, banking crises have long been an equal opportunity
menace. We develop this finding using a core sample of sixty-six countries (plus a broader
extended sample for some exercises).
3We examine banking crises ranging from Denmark’s
financial panic during the Napoleonic War to the current “first global financial crisis of the 21
stcentury.” The incidence of banking crises proves to be remarkably similar in the high- and
middle-to-low-income countries. Indeed, the tally of crises is particularly high for the world’s
financial centers: the United Kingdom, the United States, and France. Perhaps more surprising
still are the qualitative and quantitative parallels across disparate income groups. These parallels
arise despite the relatively pristine modern sovereign default records of the rich countries.
Three features of our expansive dataset are of particular note. First, our data on global
banking crises go back to 1800, extending the careful study of Bordo, et al. (2001) that covers
1
See Calomiris and Gorton (1991) and Gorton (1988) on pre–WWII banking panics; Sundararajan and Baliño
(1991) for several emerging market case studies; Jácome (2008) on banking crises in Latin America.
2
Studies that encompass episodes in both advanced and emerging economies include Bordo et al. (2001),
Demirgüç-Kunt and Detragiache (1998) and Kaminsky and Reinhart (1999).
3
The core sample spans 66 advanced and emerging market economies in Africa, Asia, Europe, Latin and North
America and Oceania; see Appendix Table A1. The extended sample includes all countries, see Table A3.
back to 1880. Second, to our knowledge, we are the first to examine the patterns of housing
prices around major banking crises in emerging markets, including Asia, Europe and Latin
America. Our emerging market data set facilitates comparisons, across both duration and
magnitude, with the better-documented housing price cycles in the advanced economies, which
have long been known to play a central role in financial crises.
4We find that real estate price
cycles around banking crises are similar in duration and amplitude across the two groups of
countries. This result is surprising given that almost all other macroeconomic and financial time
series (income, consumption, government spending, interest rates, etc.) exhibit higher volatility
in emerging markets.
5Third, our analysis employs the comprehensive historical data on central government tax
revenues and debt compiled in Reinhart and Rogoff (2008a,c). These new data afford a new
perspective on the tax and debt consequences of the banking crises (Previously, the kind of
historical data on debt necessary to analyze the aftermath of banking crises across countries was
virtually non-existent for years prior to 1990.
6)
We find that banking crises almost invariably lead to sharp declines in tax revenues as
well significant increases in government spending (a share of which is presumably dissipative).
On average, government debt rises by 86 percent during the three years following a banking
crisis. These indirect fiscal consequences are thus an order of magnitude larger than the usual
bank bailout costs that are the centerpiece of most previous studies. That fact that the
magnitudes are comparable in advanced and emerging market economies is also quite
remarkable. Obviously, both the bailout costs and the fiscal costs depend on a host of political
4
See Reinhart and Rogoff (2008b) for an analysis of all post–WWII banking crises in advanced economies.
5
See, for instance, Agénor, McDermott, and Prasad (2000).
6
Bordo and Meissner (2006) offer domestic debt data for selected years across 30 countries for 1880–1913, while
Jeanne and Guscina (2006) provide domestic debt for 19 countries for 1980–2005. The Reinhart and Rogoff
(2008c) time series for sixty-six countries spans 1913–2007, and much earlier for a large subset of these countries.
and economic factors, including especially the policy response as well as the severity of the real
shock which, typically, triggers the crisis.
7The paper proceeds as follows. Section II provides an overview of the history of
banking crises, with particular emphasis on the post-1900 experience. We also document the
incidence and frequency of banking crises by country and by region. We discuss the links
between banking crises, financial liberalization, the degree of capital mobility, and sovereign
debt crises and discuss international financial contagion.
Section III examines some of the common features in the run-up to banking crises
across countries and regions over time. The focus is on the systematic links between cycles in
international capital flows, credit, and asset prices—specifically, home and equity prices. The
next section examines some of the common features of the aftermath of banking crises. We
document the toll that the crisis takes on output and government revenues, as well as the
typically profound effect on the evolution of government debt during the years following the
crisis. The concluding section takes up the question of “graduation.” Specifically, to what
extent do countries ever “graduate” from (stop experiencing) serial major financial crises as they
seem to graduate from serial sovereign debt crises?
87
Reinhart and Rogoff 2008a,c show that output growth typically decelerates in advance of a crisis.
8
An example of graduate from serial default is France, which defaulted 8 times on its external debt between 1500
and 1800, but has not defaulted since.
I. Banking Crises in Historical Perspective
We begin this section by providing an overview of the evolution of banking crises
through history. To do so, it is necessary to first identify and date banking crisis episodes. Our
approach, which follows the standard methodology in the literature (e.g., Kaminsky and
Reinhart, 1999, Bordo, et al., 2001, and Caprio and Klingebiel, 2005, among others), is
documented in detail in the appendix, along with our principal bibliographical sources.
9One dimension that distinguishes this study from previous efforts is that our dating of
crises extends far before the much-studied modern post–World War II era. Specifically, we start
in 1800. Our work was greatly simplified back to 1880 by the careful study of Bordo, et al.
(2001), but for the earlier period we had to resort to old and often obscure works. The earliest
advanced-economy banking crisis in our sample is France 1802; early crises in emerging markets
befell India, 1863, China (several episodes during the 1860s–1870s), and Peru in 1873.
10It may come as a surprise to the reader that previous attempts to document banking crises
for the pre–World War II period are so limited. The problem is that because domestic banking
crises do not typically impinge on large powerful creditors in the international financial centers,
they do not leave the same imprint on the global press as, say, sovereign external defaults. For
this reason, we acknowledge that despite our best efforts, our chronology may be missing a
number of banking crises in emerging markets prior to World War II.
11Fortunately, banking
crisis episodes in the developed world tend to be better documented even throughout the 19
thcentury.
9
See also Reinhart and Rogoff (2008a).
10
The work of Andrea McElderry (1976) and Cheng (2003) was invaluable in developing the timeline for China.
The Peruvian case comes from a little-known 1957 book published in Lima by Carlos Camprubí Alcázar.
11
The challenges encountered in dating banking crises are along similar lines as those faced when trying to
construct a chronology of sovereign default on domestic debt, see Reinhart and Rogoff (2008c).
The Big Picture: Banking and Sovereign Debt Crises
Figure 1 plots the incidence of banking crises among the countries in our sample (which
account for about 90 percent of world GDP). Specifically, the figure shows the percentage of all
independent countries during 1900–2008 having a banking crisis in any given year. The tally
weighs countries by their share of global GDP. This weighted aggregate is meant to provide a
measure of the “global” impact of individual banking crises. As such, a crisis in the United
States or Germany is accorded a much higher weight than a crisis in Angola or Honduras, all of
which are part of our 66-country sample.
Figure 1
P roportion of Countries with Banking Crises, 1900-2008 Weighted by Their Share of World Income
0 5 10 15 20 25 30 35 40 45
1900 1903 1906 1909 1912 1915 1918 1921 1924 1927 1930 1933 1936 1939 1942 1945 1948 1951 1954 1957 1960 1963 1966 1969 1972 1975 1978 1981 1984 1987 1990 1993 1996 1999 2002 2005 2008
Percent of counties
The Gre at De pression
Emerging Markets, Japan the Nordic Countries, and US(S&L) World War I
The Panic of 1907
The First Global Financial Crisis of 21st Century
Sources: Bordo et al. (2001), Caprio et al. (2005), Kaminsky and Reinhart (1999), Jácome (2008), Maddison (2003),
and additional sources listed in Appendix II, which provides banking crises dates.
Notes: Sample size includes all 66 countries listed in TableA1 that were independent states in the given year. Three
sets of GDP weights are used, 1913 weights for the period 1800–1913, 1990 for the period 1914–1990, and finally
2003 weights for the period 1991–2006. The entries for 2007–2008 list crises in Austria, Belgium, Germany,
Hungary, Japan, the Netherlands, Spain, the United Kingdom, and the United States. The figure shows a three-year
moving average.
It is no surprise that the worldwide Great Depression of the 1930s posts the highest
readings of banking crises during this 109-year stretch. Earlier, less widespread, “waves” of
global financial stress are evident during and around the Panic of 1907 that originated in New
York, as well as the crises accompanying the outbreak of the First World War. Another striking
feature of Figure 1 is the relative calm during the late 1940s to the early 1970s. This calm may
be partly explained by booming world growth, but perhaps more so by the repression of the
domestic financial markets (in varying degrees) and the heavy-handed use of capital controls that
followed for many years after World War II. (We are not necessarily implying that such
repression and controls are the right approach to dealing with the risk of financial crises.)
Since the early 1970s, financial and international capital account liberalization took
root worldwide. So, too, have banking crises. After a long hiatus, the share of countries having
banking difficulties first began to expand in the 1970s. The break-up of the Bretton Woods
system of fixed exchange rates together with the sharp spike in oil prices catalyzed a prolonged
global recession, resulting in financial sector difficulties in a number of advanced economies. In
the early 1980s, a collapse in global commodity prices combined with high and volatile interest
rates in the United States contributed to a spate of banking and sovereign debt crises in emerging
economies, most famously in Latin America and then Africa.
The United States had its savings and loan crisis beginning in 1984. During the late
1980s and early 1990s, the Nordic countries experienced some of the worst banking crises the
wealthy economies had known in post–WWII following a surge in capital inflows and real estate
prices. In 1992, Japan’s asset price bubble burst and ushered in a decade-long banking crisis.
Around the same time, with the collapse of the Soviet bloc, several formerly communist
countries in Eastern Europe soon joined the ranks of nations facing banking sector problems. As
the second half of the 1990s approached, emerging markets quickly faced a fresh round of
banking crisis. Problems in Mexico and Argentina (1994–1995) were followed by the famous
Asian crisis of 1997–1998, and then the troubles of Russia and Colombia, among others.
12Argentina in 2001 and Uruguay in 2002 closed that upswing in the banking crisis cycle.
A brief tranquil period came to an abrupt halt in the summer of 2007 when the subprime
crisis in the United States began in earnest, soon morphing into a global financial crisis.
1312
While China’s heavy-handed capital controls shielded it from contagious currency crashes during Asia’s turmoil,
it did not protect it from a systemic and costly banking crisis emanating primarily from large-scale lending to
inefficient and bankrupt state-owned enterprises.
13
Figure 1 does not fully capture the extent of the present upsurge in financial crises, as Ireland and Iceland (both
having banking crises at the time of this writing) are not part of our core 66-country sample.
A high incidence of global banking crises has historically been associated with a high
incidence of sovereign defaults of external debt. Figure 2 plots the (GDP-weighted) share of
countries experiencing a banking crisis, as shown in Figure 1 and described above, against the
comparably calculated share of countries experiencing a default or restructuring in their external
debt. Sovereign defaults begin to climb with the onset of WWI (as do banking crises) and
continue to escalate during the Great Depression and World War II. The decades that follow are
relatively quiet, until debt crises sweep emerging markets beginning in the 1980s.
14It remains to
be seen whether the recent global surge in financial sector turbulence will lead to a similar
outcome in the sovereign default cycle. Figure 2 suggests that a sharp rise in sovereign defaults
would hardly be surprising.
14
Note that in Figure 2 the debt crises of the 1980s do not loom as large as the previous cycle of defaults, as only
middle- and low-income countries faced default, while in addition to emerging market economies several advanced
economies defaulted during the Great Depression and several more defaulted during WWII.
Figure 2
Proportion of Countries with Banking and Debt Crises Weighted by Their Share of World Income
0 5 10 15 20 25 30 35 40 45
1900 1904 1908 1912 1916 1920 1924 1928 1932 1936 1940 1944 1948 1952 1956 1960 1964 1968 1972 1976 1980 1984 1988 1992 1996 2000 2004 2008
Percent of counties
0 5 10 15 20 25 30 35 40 45
Banking Crises Debt Crises
Sources: Bordo et al. (2001), Caprio et al. (2005), Jácome (2008), Kaminsky and Reinhart (1999), Lindert and
Morton (1989), Macdonald (2003), Maddison (2003), Purcell and Kaufman (1993), Reinhart, Rogoff, and Savastano
(2003), Suter (1992), and Standard and Poor’s (various years).
Notes: Sample size includes all countries, out of a total of sixty-six listed in Table 1 that were independent states in
the given year. Three sets of GDP weights are used, 1913 weights for the period 1800–1913, 1990 for the period
1914–1990, and finally 2003 weights for the period 1991–2006. The entries for 2007–2008 list crises in Austria,
Belgium, Germany, Hungary, Japan, the Netherlands, Spain, the United Kingdom, and the United States. The figure
shows a three-year moving average.
Banking Crises: An Equal Opportunity Menace
In earlier papers, we have shown that the frequency of a default (or restructuring) on
external debt is significantly lower for advanced economies than for emerging markets. For
many high-income countries, that frequency has effectively been zero since 1800.
15Even
countries with a long history of multiple defaults prior to 1800, countries such as France and
Spain, present evidence of having “graduated” from serial default on external debt.
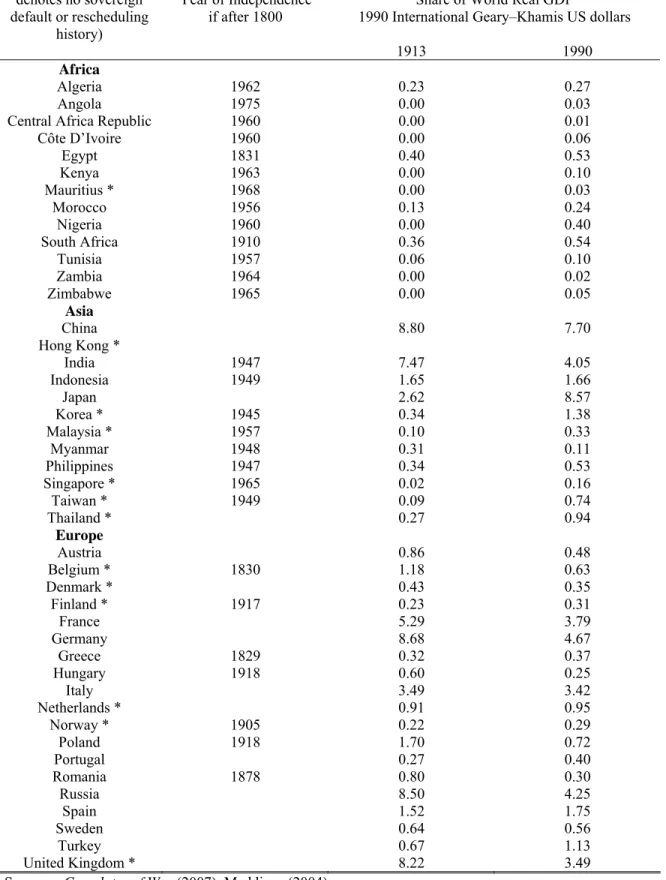
The second column in Tables 1 and 2 highlights the vast differences between emerging
markets (notably in Africa and in Latin America—but even in several countries in Asia) and
high-income Western Europe, North America and Oceania. The third column of Tables 1 and 2
present the analogous calculation for each country for banking crises (i.e., number of years in
banking crises, according to the extended dataset developed here, divided by the number of years
since independence or since 1800—if independence was earlier). One striking observation from
Tables 1 and 2 is that the average length of time spent in a state of sovereign default is far above
the average amount of time spent in a financial crisis. A country can circumvent its external
creditors for an extended period. It is far more costly to leave a domestic banking crisis hanging,
due to the crippling effects on trade and investment.
15
We do recognize, however, that the wide-spread abrogation of gold clauses—on domestic debt—during the
1930s’ Great Depression by the United States and other developed economies were de facto sovereign defaults
Table 1. Debt and Banking Crises: Africa and Asia,
Year of Independence–2008
Country Share of years in default
or rescheduling since independence or 1800
Share of years in a banking crisis since independence or 1800
Africa
Algeria 13.3 6.4
Angola 59.4 17.6
Central African Republic 53.2 38.8
Cote D’Ivoire 48.9 8.2
Egypt 3.4 5.6
Kenya 13.6 19.6
Mauritius 0.0 2.4
Morocco 15.7 3.8
Nigeria 21.3 10.2
South Africa 5.2 6.3
Tunisia 9.6 9.6
Zambia 27.9 2.2
Zimbabwe 40.5 27.3
Asia
China 13.0 9.1
India 11.7 8.6
Indonesia 15.5 13.3
Japan 5.3 8.1
Korea 0.0 17.2
Malaysia 0.0 17.3
Myanmar 8.5 13.1
Philippines 16.4 19.0
Singapore 0.0 2.3
Sri Lanka 6.8 8.2
Taiwan 0.0 11.7
Thailand 0.0 6.7
1
For countries that became independent prior to 1800 the calculations are for 1800–2006.
Sources: Authors’ calculations, Bordo et al. (2001), Caprio et al. (2005), Kaminsky and Reinhart (1999), Jácome
(2008), Standard and Poor’s, Purcell and Kaufman (1993), Reinhart, Rogoff and Savastano (2003) and sources cited
therein. See also Appendix II.
Table 2. Debt and Banking Crises: Europe, Latin America, North America, and Oceania,
Year of Independence–2008
Country Share of years in default
or rescheduling since independence or 1800
Share of years in a banking crisis since independence or 1800 Europe
Austria 17.4 1.9
Belgium 0.0 7.3
Denmark 0.0 7.2
Finland 0.0 8.7
France 0.0 11.5
Germany 13.0 6.2
Greece 50.6 4.4
Hungary 37.1 6.6
Italy 3.4 8.7
Netherlands 6.3 1.9
Norway 0.0 15.7
Poland 32.6 5.6
Portugal 10.6 2.4
Romania 23.3 7.8
Russia 39.1 1.0
Spain 23.7 8.1
Sweden 0.0 4.8
Turkey 15.5 2.4
United Kingdom 0.0 9.2
Latin America
Argentina 32.5 8.8
Bolivia 22.0 4.3
Brazil 25.4 9.1
Chile 27.5 5.3
Colombia 36.2 3.7
Costa Rica 38.2 2.7
Dominican Republic 29.0 1.2
Ecuador 58.2 5.6
El Salvador 26.3 1.1
Guatemala 34.4 1.6
Honduras 64.0 1.1
Mexico 44.6 9.7
Nicaragua 45.2 5.4
Panama 27.9 1.9
Paraguay 23.0 3.1
Peru 40.3 4.3
Uruguay 12.8 3.1
Venezuela 38.4 6.2
North America
Canada 0.0 8.5
United States 0.0 13.0
Oceania
Australia 0.0 5.7
New Zealand 0.0 4.0
Sources: Authors’ calculations, Bordo et al. (2001), Caprio et al. (2005), Kaminsky and Reinhart (1999), Jácome
(2008), Standard and Poor’s, Purcell and Kaufman (1993), Reinhart, Rogoff and Savastano (2003) and sources cited
therein. See also Appendix II.
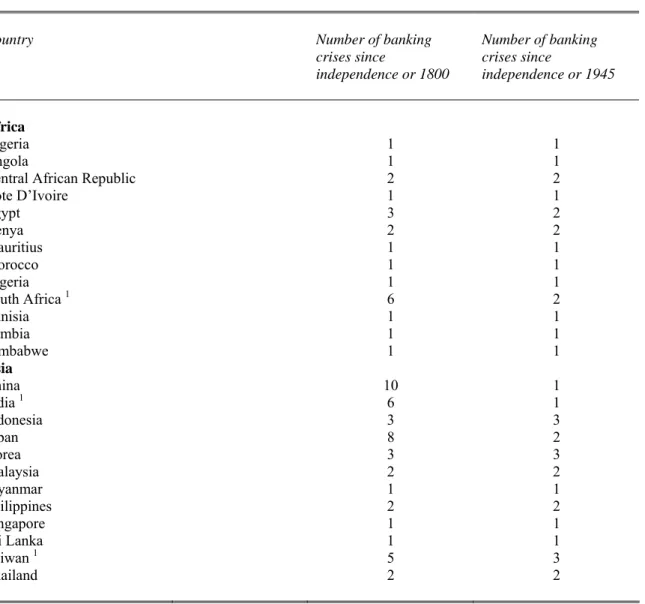
Tables 3 and 4 present a different perspective on the prevalence of banking crises. The
second column tallies the number of banking crises (rather than the number of years in crisis)
since independence or 1800; while the third narrows the window to the post–WWII period.
Several features are worth noting. For the advanced economies during the full sample, the
picture that emerges is one of serial banking crises. The world’s financial centers, the United
Kingdom, the United States and France stand out in this regard, with 12, 13, and 15 banking
crisis episodes, respectively. The frequency of banking crises drops off markedly for the
advanced economies and the larger emerging markets alike during post–WWII. However, all
except Portugal experienced at least one post-War crisis prior to the current episode. When the
present wave of crises is fully factored in, the apparent drop will likely be even less pronounced.
Thus, while many now-advanced economies have graduated from a history of serial default on
sovereign debt, or very high inflation (above 20 percent), graduation from banking crises has
proven, so far, virtually impossible. Indeed, Tables 1–4 illustrate that despite dramatic
differences in recent sovereign default performance, the incidence of banking crises is about the
same for advanced economies as for emerging markets. It also should be noted that as financial
markets have developed in the smaller, poorer economies, the frequency of banking crises has
increased.
1616
As we have already acknowledged, our accounting of financial crises in poorer countries may be incomplete,
especially for earlier periods, despite our best efforts.
Table 3. Frequency of Banking Crises: Africa and Asia through 2008
Country Number of banking
crises since
independence or 1800
Number of banking crises since
independence or 1945
Africa
Algeria 1 1
Angola 1 1
Central African Republic 2 2
Cote D’Ivoire 1 1
Egypt 3 2
Kenya 2 2
Mauritius 1 1
Morocco 1 1
Nigeria 1 1
South Africa
16 2
Tunisia 1 1
Zambia 1 1
Zimbabwe 1 1
Asia
China 10 1
India
16 1
Indonesia 3 3
Japan 8 2
Korea 3 3
Malaysia 2 2
Myanmar 1 1
Philippines 2 2
Singapore 1 1
Sri Lanka 1 1
Taiwan
15 3
Thailand 2 2
1
For South Africa the calculations are for 1850–2008; for India these are for 1800–2008.
Sources: Authors’ calculations, Bordo et al. (2001), Caprio et al. (2005), Kaminsky and Reinhart (1999), and
Jácome (2008). See also Appendix II.
Table 4. Frequency of Banking Crises: Europe, Latin America, North America, and Oceania,
Through 2008
Country Number of banking
crises since
independence or 1800
Number of banking crises since
independence or 1945 Europe
Austria 3 1
Belgium 10 1
Denmark 10 1
Finland 5 1
France 15 1
Germany 8 2
Greece 2 1
Hungary 2 2
Italy 11 1
Netherlands 4 1
Norway 6 1
Poland 1 1
Portugal 5 0
Romania 1 1
Russia 2 2
Spain 8 2
Sweden 5 1
Turkey 2 2
United Kingdom 12 4
Latin America
Argentina 9 4
Bolivia 3 3
Brazil 11 3
Chile 7 2
Colombia 2 2
Costa Rica 2 2
Dominican Republic 2 2
Ecuador 2 2
El Salvador 2 2
Guatemala 3 2
Honduras 1 1
Mexico 7 2
Nicaragua 1 1
Panama 1 1
Paraguay 2 1
Peru 3 1
Uruguay 5 2
Venezuela 2 2
North America
Canada 8 1
United States 13 2
Oceania
Australia 3 2
New Zealand 1 1
1
For countries that became independent prior to 1800 the calculations are for 1800–2006.
Sources: Authors’ calculations, Bordo et al. (2001), Caprio et al. (2005), Kaminsky and Reinhart (1999), and
Jácome (2008). See also Appendix II.
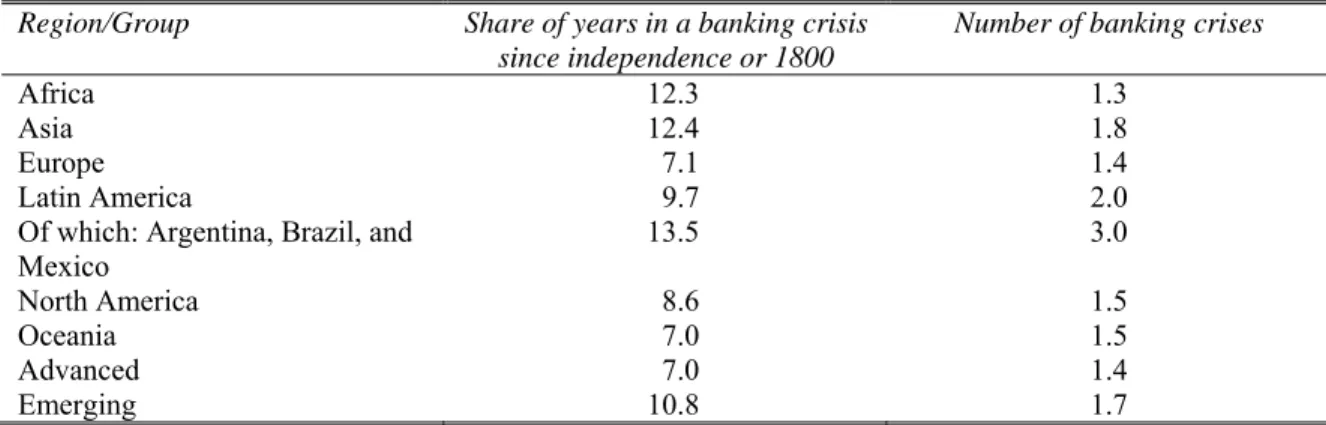
Summary Tables by Region of Frequency of Banking Crises, 1800-2007, and 1945-2007
Tables 5a and 5b summarize, by region, the evidence on the number of banking crises
and share of years in banking crisis. Table 5a starts in 1800. (The table only includes post
independence crises, which explains why emerging markets have lower cumulative totals since
1800.) Table 5b gives the evidence for post-1945.
Table 5a: Summary on the Incidence and Frequency of Banking Crises:
1800 (or independence)–2008
Region/Group Share of years in a banking crisis since independence or 1800
Number of banking crises
Africa 12.5 1.7
Asia 11.2 3.6
Europe 6.3 5.9
Latin America 4.4 3.6
Of which: Argentina, Brazil, and
Mexico
9.2 9.0
North America 11.2 10.5
Oceania 4.8 2.0
Advanced 7.2 7.2
Emerging 8.3 2.8
Table 5b: Summary on the Incidence and Frequency of Banking Crises:
1945 (or independence)–2008
Region/Group Share of years in a banking crisis since independence or 1800
Number of banking crises
Africa 12.3 1.3
Asia 12.4 1.8
Europe 7.1 1.4
Latin America 9.7 2.0
Of which: Argentina, Brazil, and
Mexico
13.5 3.0
North America 8.6 1.5
Oceania 7.0 1.5
Advanced 7.0 1.4
Emerging 10.8 1.7
Notes: Advanced economies are comprised of North America, Oceania, Japan and all European countries not listed
below as part of emerging Europe. Emerging economies consist of Africa, all Asian countries except Japan, Latin
America, and emerging Europe (Hungary, Poland, Romania, Russia, and Turkey).
Sources: based on Tables 1–4.
Whether the calculations are done from 1800 (Table 5a) or from 1945 (Table 5b), on average
there are no significant differences in either the incidence or number of banking crises
between advanced and emerging economies—banking crises are an equal opportunity
menace. In fact, prior to WWII the advanced economies with their more developed financial
systems were more prone to banking crises than many of the smaller low income counterparts.
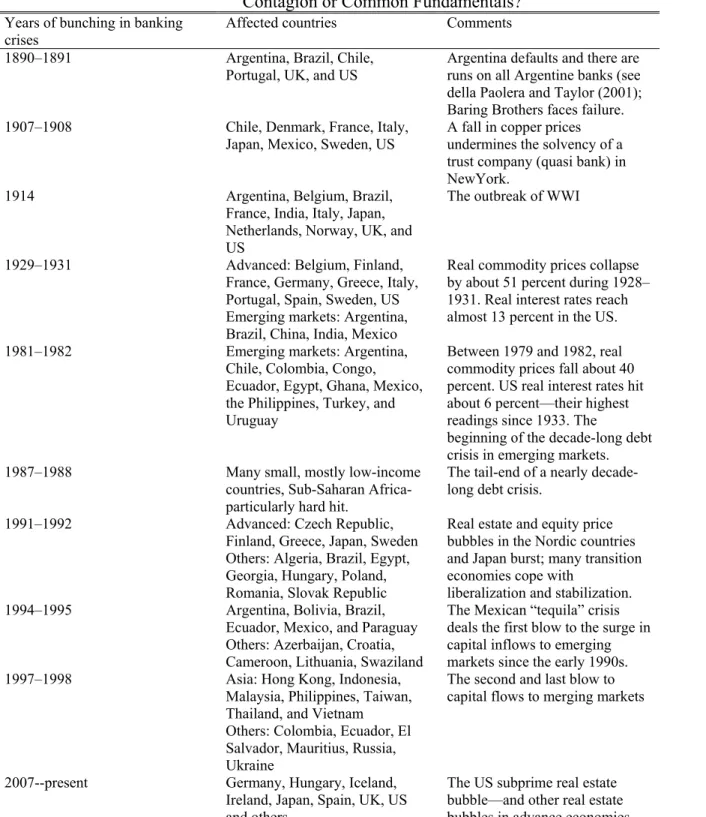
17The Bunching of Banking Crises: Contagion or Common Fundamentals?
In this section, we discuss the bunching of banking crises across countries that is so
evident in the late-2000s case, where both common shocks (the bursting of the global housing
bubble) and cross-country linkages (for example, because many countries bought U.S. subprime
mortgage debt) are evident.
Bordo and Murshid (2001) and Neal and Weidenmier (2003) have pointed out that cross-
country correlations in banking crises were also common during 1880–1913, a period of
relatively high international capital mobility under the gold standard.
18Table 6 looks at a
broader time span including the twentieth century; the table lists the years during which banking
crises are bunched; greater detail on individual country dates is provided in Appendix A3.
19The
famous Baring crisis of 1890 (which involved Argentina and the U.K. before spreading
elsewhere) appears to be the first episode of international bunching of banking crises; this was
followed by the panic of 1907, which began in the United States and quickly spread to other
17
On average, 7.2 crises for the advanced versus 2.8 for the emerging market countries (Table 5a).
18
Bordo and Murshid (2001) look at the period 1880–1913. Neal and Weidenmier (2003) emphasize that periods of
apparent contagion can be more readily interpreted as responses to common shocks, an issue we return to in the
context of the present crisis. But, perhaps, the bottom line as regards a historical perspective on financial contagion
is best summarized by Bordo and Murshid (2001), who conclude that “there is little evidence to suggest that cross-
country linkages are tighter in the aftermath of a financial crisis for the recent period” (as opposed to 1880–1913, the
earlier heyday of globalization in financial markets that they study).
19
Table 6 does not include the bunching of other “types” of crises, such as the wave of sovereign defaults during
1825 or the currency crashes/debasements of the Napoleonic Wars.
advanced economies (particularly, Denmark, France, Italy, Japan, and Sweden). These episodes
are reasonable benchmarks for modern-day financial contagion.
20Of course, other pre–World War II episodes of banking crisis contagion pale when
confronted with the Great Depression (which also saw a large bunching in sovereign debt
defaults, as seen earlier in Figure 2).
20
See, Neal and Weidenmeir (2003) and Reinhart and Rogoff (2008a).
Table 6. Global Banking Crises, 1890–2008:
Contagion or Common Fundamentals?
Years of bunching in banking
crises
Affected countries Comments
1890–1891 Argentina, Brazil, Chile,
Portugal, UK, and US
Argentina defaults and there are
runs on all Argentine banks (see
della Paolera and Taylor (2001);
Baring Brothers faces failure.
1907–1908 Chile, Denmark, France, Italy,
Japan, Mexico, Sweden, US
A fall in copper prices
undermines the solvency of a
trust company (quasi bank) in
NewYork.
1914 Argentina, Belgium, Brazil,
France, India, Italy, Japan,
Netherlands, Norway, UK, and
US
The outbreak of WWI
1929–1931 Advanced: Belgium, Finland,
France, Germany, Greece, Italy,
Portugal, Spain, Sweden, US
Emerging markets: Argentina,
Brazil, China, India, Mexico
Real commodity prices collapse
by about 51 percent during 1928–
1931. Real interest rates reach
almost 13 percent in the US.
1981–1982 Emerging markets: Argentina,
Chile, Colombia, Congo,
Ecuador, Egypt, Ghana, Mexico,
the Philippines, Turkey, and
Uruguay
Between 1979 and 1982, real
commodity prices fall about 40
percent. US real interest rates hit
about 6 percent—their highest
readings since 1933. The
beginning of the decade-long debt
crisis in emerging markets.
1987–1988 Many small, mostly low-income
countries, Sub-Saharan Africa-
particularly hard hit.
The tail-end of a nearly decade-
long debt crisis.
1991–1992 Advanced: Czech Republic,
Finland, Greece, Japan, Sweden
Others: Algeria, Brazil, Egypt,
Georgia, Hungary, Poland,
Romania, Slovak Republic
Real estate and equity price
bubbles in the Nordic countries
and Japan burst; many transition
economies cope with
liberalization and stabilization.
1994–1995 Argentina, Bolivia, Brazil,
Ecuador, Mexico, and Paraguay
Others: Azerbaijan, Croatia,
Cameroon, Lithuania, Swaziland
The Mexican “tequila” crisis
deals the first blow to the surge in
capital inflows to emerging
markets since the early 1990s.
1997–1998 Asia: Hong Kong, Indonesia,
Malaysia, Philippines, Taiwan,
Thailand, and Vietnam
Others: Colombia, Ecuador, El
Salvador, Mauritius, Russia,
Ukraine
The second and last blow to
capital flows to merging markets
2007--present Germany, Hungary, Iceland,
Ireland, Japan, Spain, UK, US
and others
The US subprime real estate
bubble—and other real estate
bubbles in advance economies
The Late 2000s Global Financial Crisis
The current conjuncture is illustrative of the two channels of contagion, linkages and
common shocks. There is little doubt that the U.S. crisis has spilled over into other markets
through direct linkages. For example, German and Japanese financial institutions (and others
ranging as far as Kazakhstan) sought more attractive returns in the U.S. subprime market,
perhaps owing to the fact that profit opportunities in domestic real estate were limited at best and
dismal at worst (Figure 3). Indeed, after the fact, it has become evident that many financial
institutions outside the United States had nontrivial exposure to the U.S. subprime market.
21This is a classic channel of transmission or contagion, through which a crisis in one country
spreads across international borders. In the present context, however, contagion or spillovers are
only part of the story.
That many other countries are experiencing economic difficulties at the same time as the
United States also owes importantly to the fact that many of the features that characterized the
run-up to the subprime crisis in the United States were present in many other advanced
economies. Specifically, many countries in Europe and elsewhere (New Zealand, for example)
were having their own home-grown real estate bubbles (Figure 3). This, in and of itself, makes
these countries vulnerable to the usual nasty consequences of asset market crashes—irrespective
of what may be happening in the United States.
21
Owing to the opaqueness of balance sheets in many financial institutions in these countries, the full extent of
exposure is, as yet, unknown.
Figure 3
Percent Change in Real Housing Prices:
2002-2006
-50 0 50 100 150 200 250
Ukraine
Estonia
Lithuania
Latvia
South Africa
Poland
Iceland
Spain
Denmark
France
Belgium U.S.
Ireland
Hungary
Canada
Hong Kong
Slovenia
Sweden
U.K.
China
Finland
Australia
Norway
Italy
Serbia
Thailand
Argentina
Taiwan
Czech
Netherlands
Colombia
Switzerland
Malaysia
South Korea
Portugal
Malaysia
Singapore
Austria
Philippines
Indonesia
Germany
Japan
Percent Change
Japan
Red, indicates financial crisis during 2007-2008
New Zealand
Sources: Bank of International Settlements and sources listed in Table A4. China data covers 2003–2006.
Banking Crises, Capital Mobility, And Financial Liberalization
Also consonant with the modern theory of crises is the striking correlation between freer
capital mobility and the incidence of banking crises, as shown in Figure 4. Periods of high
international capital mobility have repeatedly produced international banking crises, not only
famously as they did in the 1990s, but historically. The figure plots a three-year moving
average of the share of all countries experiencing banking crises on the right scale. On the left
scale, we graph the index of capital mobility, due to Obstfeld and Taylor (2004), updated and
back cast using their same design principle, to cover our full sample period. While the Obstfeld–
Taylor index may have its limitations, we feel it nevertheless provides a concise summary of
complicated forces by emphasizing de facto capital mobility based on actual flows.
For the post-1970 period, Kaminsky and Reinhart (1999) present formal evidence on the
links of crises with financial liberalization. In 18 of the 26 banking crises they study, the
financial sector had been liberalized within the preceding five years, usually less. In the 1980s
and 1990s most liberalization episodes were associated with financial crises of varying severity.
Only in a handful of countries (for instance, Canada) did financial sector liberalization proceed
smoothly. Specifically, the paper presents evidence that the probability of a banking crisis
conditional on financial liberalization having taken place is higher than the unconditional
probability of a banking crisis; probit analysis confirmed these results. Using a 53-country
sample for the period 1980–1995 Demirgüç-Kunt and Detragiache (1998) also show, in the
context of a multivariate logit model, that financial liberalization has an independent negative
effect on banking sector stability and that this result is robust across numerous specifications.
2222
See also, Drees and Pazarbasioglu (1998) for an insightful discussion of the Nordic experience with financial
liberalization.
The stylized evidence presented in Caprio and Klingebiel (1996) suggests that inadequate
regulation and lack of supervision at the time of the liberalization may play a key role in
explaining why deregulation and banking crises are so closely entwined. Again, this is a theme
across developed countries and emerging markets alike.
Figure 4
Capital Mobility and the Incidence of Banking Crisis: All Countries,
1800-2008
0 0.1 0.2 0.3 0.4 0.5 0.6 0.7 0.8 0.9 1
1800 1810 1820 1830 1840 1850 1860 1870 1880 1890 1900 1910 1920 1930 1940 1950 1960 1970 1980 1990 2000
Index
0 5 10 15 20 25 30 35
Percent
1860
Capital Mobility (left scale)
Share of Countries in Banking Crisis, 3-year
Sum (right scale)
1914
1945 1825 1980
1918 High
Low
Sources: Bordo et al. (2001), Caprio et al. (2005), Kaminsky and Reinhart (1999), Obstfeld and Taylor (2004), and
these authors.
Notes: This sample includes all countries (even those not in our core sample of 66). The full listing of banking
crises dates are shown in Appendix II. On the left scale, we updated our favorite index of capital mobility,
admittedly arbitrary, but a concise summary of complicated forces. The smooth red line shows the judgmental index
of the extent of capital mobility given by Obstfeld and Taylor (2004), back cast from 1800 to 1859 using their same
design principle.
III. Capital Flow Bonanzas, Credit Cycles and Asset Prices
This section examines some of the common features of banking crises across countries,
regions and time. The focus is on the regularities among cycles in international capital flows,
credit, and asset prices (specifically, housing and equity prices).
Capital flow bonanzas and crisis vulnerability
One common characteristic of the run-up to banking crises is a sustained surge in capital
inflows. Reinhart and Reinhart (2008) delineate a criterion to define a capital flow bonanza,
catalogue (country-by-country) “bonanza”
23episodes for 1960–2006, and examined the links
between bonanza spells and banking crises, employing the crisis dates defined and dated in the
Appendix to the present paper.
24From the Appendix crises dates and the bonanza dates, two country-specific probabilities
were calculated. The unconditional probability of a banking crisis, along the lines of those
shown in Tables 1 and 2 (except for 1960–2007), and the probability of a banking crisis within a
window of three years before and after the bonanza year or years—that is, as the conditional
probability of a crisis. If capital flow bonanzas make countries more crises prone, the
conditional probability, P(Crisis│Bonanza) should be greater than the unconditional probability
of a crisis, P(Crisis).
23
Reinhart an Reinhart define a capital flow bonanza as follows They settled on an algorithm that provided uniform
treatment across countries but was flexible enough to allow for significant cross-country variation in the current
account. As in Kaminsky and Reinhart (1999), we select a threshold to define bonanzas that is common across
countries (in this case the 20
thpercentile).
23This threshold included most of the better known episodes in the
literature but was not so inclusive as to label a bonanza more “routine” deteriorations in the current account.
Because the underlying frequency distributions vary widely across countries, the common threshold produces quite
disperse country-specific cutoffs. For instance, in the case of relatively closed India, the cutoff to define a bonanza
is a current account deficit/GDP in excess of 1.8 percent, while for trade-oriented Malaysia the comparable cutoff is
a deficit/GDP ratio of 6.6 percent.
23.
2324
They performed a comparable exercise for currency, debt, and inflation crises.
Table 7 reproduces a subset of the results a Reinhart and Reinhart for banking crises. It
presents aggregates of the country-specific conditional and unconditional probabilities for three
groups (all countries, high income, and middle and low income).
The probability of a banking crisis conditional on a capital flow bonanza is higher than the
unconditional probability. The bottom row of Table 6 provides the share of countries for which
P(Crisis│Bonanza) ≥ P(Crisis) as an additional indication of how common place is it across
countries to see bonanzas associated with a more crisis-prone environment. For banking crises,
the majority of countries (61 percent) register a higher propensity to banking crises around
bonanza periods.
We conjecture that the 61 percent figure would be higher if one were to include post-
2007 data in Table 7. Many countries experiencing the most severe banking crises have also run
large sustained current account deficits. These include many developed countries, such as the
United States, the United Kingdom, Spain, Iceland and Ireland.
Table 7. Are Capital Flow Bonanza Episodes More Prone to Banking Crisis?
1960–2007
Probability of a banking crisis (in percent), 66-country sample
Conditional on a bonanza (three-year window) 18.4
Unconditional 13.2
Difference
5.2Memorandum item:
Percent of countries for which conditional probability is greater than
unconditional
60.9
Notes: The three-year window encompasses three years before the bonanza years (see Reinhart and Reinhart, 2008,
Table 2), the year (or years if these are consecutive) of the bonanza, and the three years following the episode.
Italics denote significance at the one-percent confidence level.Source: Reinhart and Reinhart (2008), based on Tables 2 and 4 and authors’ calculations.
The findings on capital flow bonanzas in Reinhart and Reinhart (2008) are also consistent
with empirical regularities surrounding credit cycles. Mendoza and Terrones (2008), who
examine cycles in credit in both advanced and emerging market economies using a very different
approach from that just discussed, find that credit booms in emerging market economies are
often preceded by surges in capital inflows. They also conclude that while not all credit booms
end in financial crises, most emerging market crises were preceded by credit booms. They link
credit booms to rising asset prices, an issue we turn to next.
25Equity and housing price cycles and banking crises
In this section, we summarize the literature on asset price bubbles and banking crises,
extending it to incorporate new data on housing prices in emerging markets, as well as data on
the unfolding crises in the advanced economies.
The now-infamous real estate bubble in the United States that began to deflate at the end
of 2005 occupies center stage as a culprit of the present financial crisis. But the subprime
episode is far from unique in that regard. In Reinhart and Rogoff (2008b), we document the
trajectory in real housing prices around all the post–WWII banking crises in advanced
economies, with particular emphasis on the “Big 5” crises (Spain, 1977, Norway, 1987, Finland
and Sweden, 1991 and Japan, 1992).
26The pattern that emerges is clear: a boom in real housing
prices in the run-up to the crisis is followed by a marked decline the year of the crisis and in
subsequent years. Bordo and Jeanne (2002), also studying the advanced economies during
1970–2001, find that banking crises tend to occur either at the peak of the boom in real housing
prices, or right after the bust. Gerdrup (2003) presents a compelling narrative of the links
between Norway’s three banking crises during 1890s–1993 and the booms and busts in housing
prices.
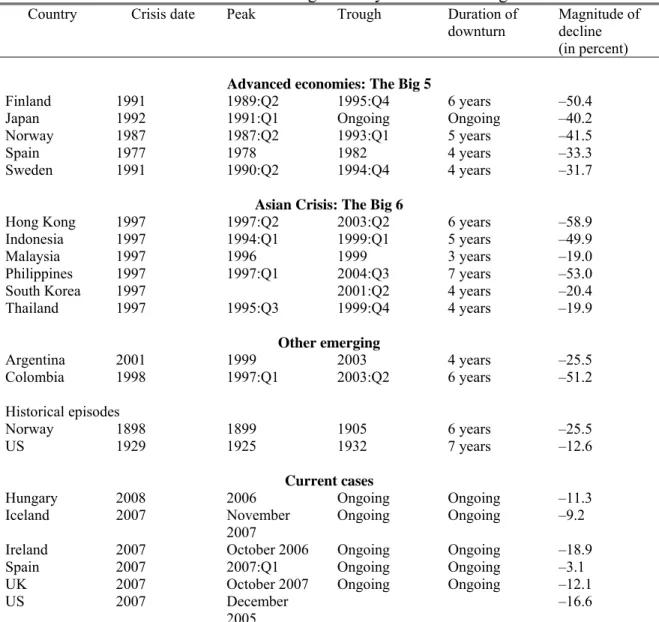
Table 8 illustrates the magnitude and duration of the downturn in housing prices that has
historically accompanied major banking crises in both advanced and emerging economies.
25
See also Kaminsky and Reinhart (1999), who also examine the growth in real credit to the private sector around
both banking and currency crises.
26
The years refer to the beginning of the crisis.
While the links between banking crises and the housing price cycle have been examined in both
our earlier work and numerous other papers (most frequently case studies), this is the first paper
to provide systematic evidence on the behavior of housing prices for emerging market economies
around some of their major banking crises. The crisis episodes include the “Big 6” Asian crises
of 1997–1998, Indonesia, Korea, Malaysia, the Philippines, Thailand, and the much buffeted
Hong Kong.
Table 8. Real Housing Price Cycles and Banking Crises
Country Crisis date Peak Trough Duration of
downturn
Magnitude of
decline
(in percent)
Advanced economies: The Big 5Finland 1991 1989:Q2 1995:Q4 6 years –50.4
Japan 1992 1991:Q1 Ongoing Ongoing –40.2
Norway 1987 1987:Q2 1993:Q1 5 years –41.5
Spain 1977 1978 1982 4 years –33.3
Sweden 1991 1990:Q2 1994:Q4 4 years –31.7
Asian Crisis: The Big 6
Hong Kong 1997 1997:Q2 2003:Q2 6 years –58.9
Indonesia 1997 1994:Q1 1999:Q1 5 years –49.9
Malaysia 1997 1996 1999 3 years –19.0
Philippines 1997 1997:Q1 2004:Q3 7 years –53.0
South Korea 1997 2001:Q2 4 years –20.4
Thailand 1997 1995:Q3 1999:Q4 4 years –19.9
Other emergingArgentina 2001 1999 2003 4 years –25.5
Colombia 1998 1997:Q1 2003:Q2 6 years –51.2
Historical episodes
Norway 1898 1899 1905 6 years –25.5
US 1929 1925 1932 7 years –12.6
Current cases
Hungary 2008 2006 Ongoing Ongoing –11.3
Iceland 2007 November
2007
Ongoing Ongoing –9.2
Ireland 2007 October 2006 Ongoing Ongoing –18.9
Spain 2007 2007:Q1 Ongoing Ongoing –3.1
UK 2007 October 2007 Ongoing Ongoing –12.1
US 2007 December
2005
–16.6
Sources: Bank of International Settlements and the individual country sources described in the Data Appendix.
Other emerging market episodes include Argentina’s mega-crisis in 2001–2002, and
Colombia’s 1998 crisis, which produced the worst recession since the national income accounts
were tabulated in the early 1920s. In the current conjuncture of unfolding crises, we include
Hungary, in addition to the advanced economies that have had recent housing market bubbles
(Iceland, Ireland, Spain, the United Kingdom, and the United States).
27Two features stand out from the summary statistics presented in Table 8. First is the
persistence of the cycle in real housing prices in both advanced economies and emerging
markets, typically four to six years.
28The second feature that stands out from Table 8 is that the
magnitudes of the declines in real housing prices around banking crises from peak to trough
are not appreciably different in emerging and advanced economies. This comparability is quite
surprising given that most macroeconomic time series exhibit drastically greater volatility in
emerging markets, and thus it merits further attention.
29Certainly, the first results presented
here on comparing housing price booms and busts around banking crisis dates appears to
strongly support the contention that banking crises are an equal opportunity menace.
The prolonged housing price downturns following financial crises are in stark contrast to
the behavior of real equity prices, as illustrated in Figures 5a and 5b in which the pattern of
decline and recovery is more v-shaped.
27
Historical comparisons are hard to come by, as most real housing price series are of recent vintage. We do
include in this category two episodes: the United States during the Great Depression and Norway’s crisis at the turn
of the century (1898).
28
See Ceron and Suarez (2006), who estimate its average duration at six years
29
For example, Agenor, McDermott, and Prasad (2000) provide evidence that output and real consumption are far
more volatile in emerging markets; Kaminsky, Reinhart and Vegh (2003) present evidence that the amplitude of the
cycle in real government spending is orders of magnitude greater in emerging markets.
Figure 5a
Real Equity Prices and Banking Crises:
18 Advanced Economy Episodes
80 85 90 95 100 105 110 115 120 125 130 135
t-4 t-3 t-2 t-1 T t+1 t+2 t+3
Index
Average for banking crises in advanced economies
Index t-4=100 Average for the "Big 5"
Crises
Notes: The Big 5 crises are: Spain, 1977; Norway, 1987; Finland, 1991, Sweden, 1991; and Japan 1992.
Source: Global Financial Data and author’s calculations.
Figure 5b
Equity Prices and Banking Crises:
40 Emerging Market Episodes
90
100
110
120
130
140
150
160
170
180
t-4 t-3 t-2 t-1 T t+1 t+2 t+3 t+4
Inde x
16 percent and 10 percent declines
The recovery in equities is far swifter than that of the housing market.
t-4 = 100
Source: Global Financial Data and author’s calculations.
Notes: Four of the 40 episodes are pre–World War II (1921–1929).
These figures show the evolution of real equity prices from four years prior to the crisis
to three years afterwards for emerging and advanced economies separately. As the figures make
plain, equity prices typically peak before the year of the banking crisis and decline for 2–3 years
as the crisis approaches and, in the case of emerging markets in the year following the crisis.
However, the pattern tends to be v-shaped and the recovery complete, in the sense that three
years after the crisis real equity prices are on average higher than the pre-crisis peak.
One can conjecture that one reason why major banking crises are such protracted affairs
is that these episodes involve the real estate market’s persistent cycle in a way that “pure stock
market crashes” (for instance, Black Monday in October 1987 or the burst of the IT bubble in
2001) do not.
30Financial Sector Expansion and Financial Crisis
Philippon (2007) analyzes the expansion of the financial services sector (including
insurance) in the United States, which averaged 4.9 percent of GDP during 1976–85, rising to
7.5 percent 1996–2005. His paper argues that this gain was not sustainable and a decline of at
least 1 percent of GDP was probable. In the wake of the subprime crisis, the shrinkage of the
financial sector during 2008 and 2009 is likely to be significantly larger. The pre-crisis
explosion and post-collapse implosion of the financial sector surrounding a banking crisis is also
not new or unique to the United States.
Figure 6 plots the number of banks in the United States in the run-up and aftermath of the
Great Depression. Perhaps, the bubble in equity and real estate prices also extended to the
number of financial institutions. This expansion in the run-up and contraction in the aftermath in
30
This is consistent with the regularity that house prices are far more predictable (i.e., inertial) than equity prices.
the number of financial institutions is evident during other banking crises—especially in those
cases where financial liberalization preceded the banking crisis.
Figure 6
Number of Banks in the US (1834-1945) and the
International Spread of Banking Crisis, 1929-1931
0 5000 10000 15000 20000 25000 30000 35000
1900 1902 1904 1906 1908 1910 1912 1914 1916 1918 1920 1922 1924 1926 1928 1930 1932 1934 1936 1938 1940 1942 1944 Thousands
1925, Peak in real house prices
1929, Peak in stock
market
Sources: Historical Statistics of the Unites States.
IV. The Fiscal and Growth Consequences of Banking Crises
Looking at the fiscal and growth consequences of banking crises, we again find some
surprising parallels between developed countries and emerging markets. Our analysis of the
fiscal consequences, in particular, is a sharp departure from the previous literature, which has
focused almost entirely on imputed “bailout costs” to the government which, as we shall argue,
are extremely difficult to measure. Instead, we will focus on the fiscal costs to the government,
particularly the huge build-ups in debt that follow banking crises. We are able to do so by
tapping the extensive new cross-country annual dataset on domestic debt compiled in Reinhart
and Rogoff (2008c). This data allow us to show the remarkable surge in debt that occurs in the
wake of crises.
That elusive concept of bailout costs
As we have noted, much of the literature that studies banking crisis episodes is fixated on
providing estimates of the fiscal or bailout costs of these crises (see, for example, an excellent
discussion in Frydl, 1999, and various papers in Norges Bank, 2006).
31At the time of this
writing, the International Monetary Fund estimates that the fiscal costs of the U.S. subprime
crisis will tally about $1.4 trillion, or around 11 percent of GDP.
32However, estimates of bailout
costs vary markedly across studies, depending on the methodology and vary even more across
time, depending on the length of horizon used to calculate the fiscal impact of the crisis, a point
stressed in Frydl (1999).
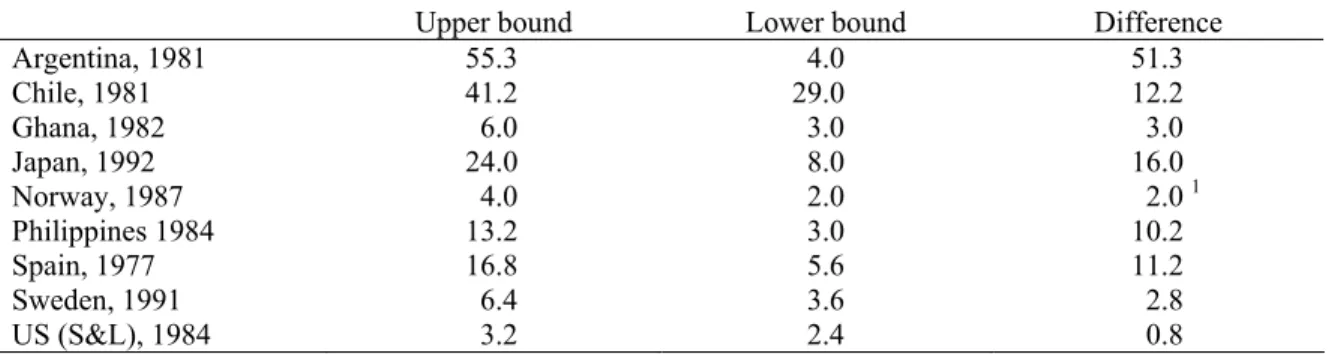
33Table 9 presents the upper and lower bounds of estimates of the
bailout costs for some of the better-known banking crises in both advanced and emerging
economies in nearly all regions. The discrepancies across estimates are large and, in some cases,
31
See also Caprio et al. (2005), and Hoggarth et al. (2002), and Sanhueza (2001).
32
See International Monetary Fund, October 2008 World Economic Outlook and Global Financial Stability Report.
33