Inventing to Prepare for Future Learning:
The Hidden Efficiency of Encouraging
Original Student Production
in Statistics Instruction
Daniel L. Schwartz and Taylor Martin
School of EducationStanford University
Activities that promote student invention can appear inefficient, because students do not generate canonical solutions, and therefore the students may perform badly on standard assessments. Two studies on teaching descriptive statistics to 9th-grade stu-dents examined whether invention activities may prepare stustu-dents to learn. Study 1 found that invention activities, when coupled with subsequent learning resources like lectures, led to strong gains in procedural skills, insight into formulas, and abilities to evaluate data from an argument. Additionally, an embedded assessment experiment crossed the factors of instructional method by type of transfer test, with 1 test includ-ing resources for learninclud-ing and 1 not. A “tell-and-practice” instructional condition led to the same transfer results as an invention condition when there was no learning re-source, but the invention condition did better than the tell-and-practice condition when there was a learning resource. This demonstrates the value of invention activi-ties for future learning from resources, and the value of assessments that include op-portunities to learn during a test. In Study 2, classroom teachers implemented the in-struction and replicated the results. The studies demonstrate that intuitively compelling student-centered activities can be both pedagogically tractable and effec-tive at preparing students to learn.
The renowned instructional theorist Robert Gagne built his work on the observa-tion that different forms of instrucobserva-tion are suited to different learning outcomes. For example, he proposed repetition for developing motor skills and reinforcement
Requests for reprints should be sent to Dan Schwartz, Stanford University, School of Education, 485 Lasuen Mall, Stanford University, CA 94305–3096. E-mail: [email protected]
for attitudes (Gagne & Briggs, 1974). His work predated the cognitive revolution, and emphasized the training and measurement of behavior rather than understand-ing. Since then, cognitive science has examined instructional models for teaching conceptually grounded procedural skills that students can efficiently retrieve and apply to solve problems. More recently, researchers have drawn attention to peo-ple’s readiness to learn in new situations (e.g., Brown & Kane, 1988; Greeno, 1997; Griffin, Case, & Siegler, 1994; Hatano & Inagaki, 1986; Lehrer, Strom, & Confrey, 2002; Singley & Anderson, 1989; Wineburg, 1998). Bransford and Schwartz (1999), for example, argued that even the best instruction in prob-lem-solving procedures is unlikely to prepare students for many situations they may encounter. Therefore, instead of focusing exclusively on student problem solving, they suggested that it is also important for instruction to focus on students’ abilities to learn from new situations and resources. Preparing for future learning requires the development of new instructional methods and the development of as-sessments that can evaluate whether students have been prepared to learn.
The goals of this article are threefold. One goal is to rethink the value of ties that ask students to invent original solutions to novel problems. These activi-ties are intuitively compelling (e.g., DiSessa, Hammer, Sherin, & Kolpakowski, 1991), yet students typically generate suboptimal solutions, and therefore do poorly on subsequent assessments of problem solving. This has led many to ques-tion their value and some to advocate correcting student errors as quickly as possi-ble (e.g., Anderson, Conrad, & Corbett, 1989; for discussion see Barron et al., 1998; Vollmeyer, Burns, & Holyoak, 1996). We argue, however, that invention ac-tivities, when designed well, may be particularly useful for preparing students to learn, which in turn, should help problem solving in the long run.
The second goal is to describe a pair of 2-week design experiments with ninth-grade students who learned about descriptive statistics. We wanted to see if invention activities do indeed have benefits for subsequent learning. We also thought it was important to determine whether invention activities can lead to ex-cellent outcomes, even within a relatively short time frame and in a school setting that has little history with these types of activities. To be a compelling demonstra-tion, we included assessments of both the procedural fluency emphasized by many standardized tests (Tyack & Cuban, 1995) and the conceptual reasoning empha-sized by many educational researchers (see Boaler, 1997, on the faulty assumption that these outcomes are mutually exclusive).
In the first study, we taught the curriculum, and in the second study, we examined whether it worked for classroom teachers. Our instructional design, called Inventing to Prepare for Learning (IPL), was styled on our arguments for why student produc-tion can prepare students to learn. We were particularly interested in whether invent-ing activities would help students learn from the direct instruction that is likely to oc-cur at other points in the class. So, rather than making our instruction slavishly follow either a procedurally driven, direct-instruction model or a discovery driven,
dent-products model, we tested whether fostering student invention would prepare students to learn from direct instruction. Practically, this is important for teachers, because it alleviates the burden of carefully guiding students to discover the correct solutions—the teacher can simply explain the solution after the students have been “prepared.” Theoretically, this is important because it provides a counterexample to the misconception that direct instruction is against constructivist principles and should therefore be avoided (see Schwartz & Bransford, 1998). Constructivism is a theory of knowledge growth that applies whether one is sitting quietly listening to a lecture or actively inventing representations. The question is not whether one form of instruction is constructivist or not, but rather, what activities best prepare students to construct understanding, for example, from an explicit “telling.”
The third goal of this article is to describe the results of a formal experiment that compared the value of problem-solving assessments versus preparation for learn-ing assessments. As is often the case, our design studies could not implement the many control conditions and process measures necessary to isolate the active in-structional ingredients. However, on the last day of each design study, we could conduct controlled “assessment experiments” to examine the potential advantages of measures that probe for students’ preparedness to learn. The experiments, which we describe later, try to address a pragmatic and methodological barrier to helping people adopt a preparation for future learning perspective. Most educators assess student knowledge, or the value of an instructional method, by giving students tests of sequestered problem solving (Bransford & Schwartz, 1999). Like mem-bers of a jury, students are shielded from contaminating sources of information that could help them learn to solve problems during the test. Consequently, educators tend to use methods of procedural and mnemonic instruction that support these types of sequestered tests, and they find evidence that their methods of instruction are effective. At the same time, they do not find evidence that student-driven activi-ties support learning as measured by these tests. For example,service learningis a genre of learning experiences that sends students to the community to help in nurs-ing homes or engage in similar service activities. There is slim evidence that these activities show benefits on standard assessments (Eyler & Giles, 1999). Yet, most people who complete service learning talk about its exceptional value. To break the self-reinforcing cycle of procedural instruction and sequestered assessments, it is necessary to show the value of another form of assessment that can differentiate important forms of knowing that educators should care about. If applied to the ex-ample of service learning, this form of assessment might find that experiences in the community prepare students to learn from formal treatments on theories of community, compared to students who do not have such experiences.
The introduction comes in five sections that explain how we addressed the three goals. In the first section, we describe the types of early knowledge that are insuffi-cient for full-blown problem solving, but which we think are important for being prepared to learn about statistics. The second section describes why we think
duction activities, like inventing solutions, can be particularly beneficial for devel-oping early knowledge, and how IPL materials facilitate this process. Notably, not any student production will help—“doing” does not guarantee “doing with under-standing.” For example, Barron et al. (1998) found that children, when asked to de-sign a school fun fair as a math project, spent their time excitedly dede-signing attrac-tive fun booths rather than thinking about the quantitaattrac-tive issues of feasibility and expense. Therefore, it is important to design productive experiences that help stu-dents generate the types of early knowledge that are likely to help them learn. We describe how IPL tries to maximize the potential benefits of invention. The third section offers an example of what student invention looks like. The fourth section introduces the larger instructional cycle, including the teacher’s role in that cycle. Finally, the fifth section introduces our ideas about assessing preparation for future learning, and we describe the assessment experiment and its logic.
EARLIER FORMS OF KNOWLEDGE THAT PREPARE PEOPLE TO LEARN
To learn from direct instruction, students use prior knowledge to make sense of what is told to them—essentially, this is a transfer process, but one where learners are transferring in rather than out of the observed situation. Transfer is not some-thing that happens only after an experimental or educational intervention (e.g., Lobato, 2003). When researchers assert that new learning builds on previous learn-ing, they are assuming that some sort of transfer is involved. The research on pre-conceptions provides an example of paying attention to what people “transfer in,” because it studies how prior knowledge affects learning (e.g., Clement 1993; Hunt & Minstrell, 1994). When preparing students to learn, the instructional challenge is to help students transfer in the right knowledge.
One solution is to design instruction that can connect to students’ prior experi-ences (e.g., Moll, 1986). For example,The Adventures of Jasper Woodbury (Cog-nition & Technology Group at Vanderbilt, 1997) includes a visual narrative that helps children transfer in complex real-world knowledge to motivate and anchor the ways they think about and interact with new mathematical content.
A complementary solution, which we focus on here, is to help students develop useful forms of prior knowledge that are likely to help them interpret the meaning of subsequent lessons. Cognitive science, which has largely examined mature forms of knowledge and expertise, suggests the value of procedural schemas that students can efficiently retrieve and apply. For example, to learn statistical formu-las, students need strong arithmetic knowledge. However, there are also earlier forms of knowledge that do not directly support fluent problem solving, but are still extremely important for learning.
In the domain of statistics, one critical form of early understanding is the ability to see the important quantitative properties of a situation. If students do not notice
relevant features—for example, if they treat probabilistic outcomes as single events rather than distributions (Konold, 1989)—then they will not understand what a statistical explanation is referring to. Furthermore, without an understand-ing of the relevant features, students may transfer in vague intuitions that do not have sufficient precision to motivate the form or function of a particular statistical formalization (Mokros & Russell, 1995). For example, if students think of data in terms of instances and do not notice sample size as an important feature, they will not be prepared to understand why variability formulas divide by the sample size. Helping students notice sample size can help them appreciate that dividing byn
takes the average and permits comparisons across samples of different sizes. A second important form of early understanding consists of an awareness of the quantitative work a mathematical procedure or tool needs to accomplish (even though students may not yet know a specific procedure to accomplish this work ef-ficiently). This knowledge is critical to an eventual understanding of a conven-tional mathematical procedure and how it does its work. Without this prior knowl-edge, students may transfer in the interpretation that a procedure or formula is simply something to follow. For example, Moore and Schwartz (1998) asked col-lege students who had recently learned to compute the standard deviation to evalu-ate the strengths and weakness of unusual procedures for measuring variability. The students did not think about the quantitative work the procedures could ac-complish, but instead, over 50% of the students said, “That’s not how you’re sup-posed to do it!” The students had no quantitative insight and rigidly deferred to the authority of the rule they had been taught. Even though “following the rules” leads to learning, the knowledge is brittle. Students cannot reconstruct the formula if they forget an element; they cannot adapt the formula to a new situation, and they cannot reason deeply about the appropriateness of the formula for a given situation (Silver, 1986). For example, in the context of learning to use mathematical inscrip-tions, Lehrer, Schauble, Carpenter, and Penner (2000) “observed the rigidity in students’ reasoning that occurred when inscriptions were given to children as the solution to a problem they did not yet recognize“ (p. 359). For instruction in statis-tics, students should at least appreciate that the value of an inscription will depend on its abilities to usefully characterize data for the task at hand.
INVENTIVE PRODUCTION AND THE DEVELOPMENT OF EARLY KNOWLEDGE
There are two related ways that we believe inventive production can support the development of early knowledge. One is that production can help people let go of old interpretations. The other is that production can help people develop new inter-pretations.
As we mentioned previously, people always transfer in some sort of knowledge to make sense of a situation. This presents a challenge for developing early
edge. The knowledge people bring can interfere with their ability to learn what is new about a situation. They may assimilate the new possibilities to their old ways of thinking. For example, Martin and Schwartz (2004) asked 9- to 10-year-old children to solve fraction equivalence problems like “indicate ¼ of 8.” In one con-dition, the children saw pictures of pieces, and they had to circle the correct num-ber of pieces to show the answer. Children typically transferred in a whole numnum-ber interpretation; they circled one piece or four pieces to indicate ¼ of 8. In the other condition, the same children received pieces that they physically manipulated. In this condition, the children managed to reinterpret the pieces. By collecting the pieces into piles and pushing them around, they began to see the pieces as groups that could be counted in their own right. For example, they came to reinterpret two pieces as one group, which enabled them to eventually count out four groups and solve the problem of finding ¼. When the children moved the pieces physically, they were correct nearly three times as often as when they could not. Interestingly, when the pieces were pregrouped for the children (e.g., four groups of two pieces), they could not interpret the meaning of this grouping by just looking, and they still did better when they could move the pieces around.
Production (which in this case took the form of manipulating pieces) seems to help people let go of old interpretations and see new structures. We believe this early appreciation of new structure helps set the stage for understanding the expla-nations of experts and teachers—explaexpla-nations that often presuppose the learner will transfer in the right interpretations to make sense of what they have to say. Of course, not just any productive experience will achieve this goal. It is important to shape children’s activities to help them discern the relevant mathematical features and to attempt to account for these features. We employ two design features to shape student activity: contrasting cases and inventing mathematical representa-tions.
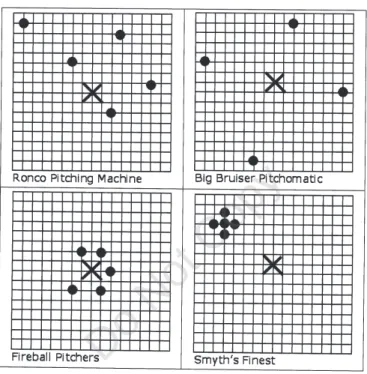
One way to help students learn new quantitative properties (as opposed to see-ing the ones they already know) is to use contrastsee-ing cases of small data sets. For example, Figure 1 provides an activity used to prepare students to learn about the mean deviation formula. Each grid shows the result of a test using a different base-ball-pitching machine. The black circles represent where a pitch landed when aimed at the target X. Students work in small groups to develop a reliability index. Their task is to develop a formula or procedure that computes a single value to help shoppers compare reliability between the machines, much as an appliance receives an efficiency index. The contrasts between the four machines draw attention to is-sues of sample size, outliers, density, and the distinctions between variability, cen-tral tendency, and accuracy.
Contrasting cases are useful for developing early knowledge, because they can help learners notice new features and develop new interpretations. Our use of con-trasting cases as an instructional tool draws on the ecological psychologists’ re-search on perceptual learning. Although we believe that learning mathematics
pends on many nonperceptual processes (which is why we use the word
interpretationinstead ofperception), the perception literature is particularly infor-mative about how people come to learn new things. A significant body of research describes learning to perceive in terms of noticing what differentiates one thing from another (Garner, 1974; J. J. Gibson & Gibson, 1955; Marton & Booth, 1997), and contrasting cases are a powerful way to help people discern differentiating properties (Bransford, Franks, Vye, & Sherwood, 1989; E. J. Gibson, 1940). For example, comparing wines side-by-side helps people discern features they did not previously notice. Howard Gardner (1982) described an art exhibit that juxtaposed original paintings and forgeries. At first people could not tell the difference, but
FIGURE 1 Contrasting cases—Inventing a reliability index for baseball pitching machines. The four grids include contrasts to draw attention to features of distributions that measures of variability need to handle, such as sample size.
over time, they began to notice the features that differentiated the original. Simi-larly, in our materials, students learn to discern relevant features by comparing data sets. Contrasting cases of small data sets, by highlighting key quantitative distinc-tions relevant to specific decisions, can help students notice important quantitative features they might otherwise overlook.1
To make contrasting cases effective, learners need to undertake productive ac-tivities that lead them to notice and account for the contrasts in the data. The ecological psychologists used contrasting cases to develop theoretical evidence against behaviorist (and cognitive) accounts of perception (J. J. Gibson & Gib-son, 1955). For example, Eleanor J. Gibson (1969) used contrasting cases to show that people could learn to perceive without overt, reinforced behaviors. Nevertheless, the ecological psychologists put great emphasis on the active, ex-ploratory nature of perception. For example, people can determine the shape of an object better if they move their hands over the object than if the object gets moved over their hands. Contrasting cases can help people “pick up” distinctive features, but people’s actions are important for helping them discern the struc-tures that organize those feastruc-tures.
Student inventions are a form of exploratory behavior. The consequences of this exploration for learning depend on a number of factors. One factor is the goal of the exploration. For example, by providing the students the goal of comparing the pitching machines, they notice contrasts in the data from each machine, yet they need to find a common structure to the data to make comparative decisions.
Another factor involves the actions and tools that are available, which affect what people notice and learn. For example, in the previously cited manipulative example, the children found a grouping structure because they could easily col-lect the pieces in their hands and move them around as a pile. Tools become a part of this story, because they are an extension of one’s ability to act and influ-ence the interpretations one develops. For example, wheelchair users interpret curbs and steps differently from their fellow ambulatory pedestrians (as impedi-ments, not facilitators).
The effect of tools on developing interpretations applies to symbolic tools, not just physical ones. By asking students to use mathematical tools and notations, we can help them form their interpretations of quantities (as well as the tools they use). For example, Schwartz, Martin, and Pfaffman (in press) asked 9- to 11-year-old children to answer to a number of balance scale problems that showed various weights at different distances from the fulcrum. Half of the children were asked to use words (a verbal tool) and half to use math (a quantitative tool) to justify their
1If the goal were to develop an understanding of inferential statistics instead of descriptive statistics,
larger data sets would be appropriate, although it would still be important to limit the number of possi-ble contrasts so students could discern the quantitative properties of importance.
answers. Even though no children received feedback on their justifications, the children who used math learned to interpret the balance scale as having two rele-vant dimensions (weight and distance), whereas the children who used words only saw the dimension of weight.
One quality of mathematical tools that we try to emphasize in IPL is their gener-ality. As students invent a representation, we encourage them to make sure the rep-resentation is general, rather than particular. For example, they need to find a single indexing procedure that can handle all the grids, not just one or two. The capacity of mathematical notations and graphs for general representation can help students notice the structure of variability beneath the surface differences between the pitching machines (e.g., it depends on the absolute distances between points re-gardless of their position). Our approach is similar in spirit to Lesh’s (2003) model elicitation activities, whereby students solve problems that help them see the value of general models that can handle the most cases possible.
Another quality of mathematical tools is that they encourage precise interpreta-tions. This creates specificity in observation and revision. In IPL, we take advan-tage of mathematical specificity by encouraging students to match their invented solutions against their evolving intuitions. For example, with the pitching grids, students are encouraged to see if their reliability index ranks all four grids at appro-priate intervals from one another (instead of just making pair-wise comparisons). This ranking depends on both the generality of mathematical structure and the pre-cision of an interval scale. If there is a mismatch between intuition and their index, it fuels the search for revised inventions that work in detail.
The third benefit of mathematical tools is that one can reflect on the structure of the tool explicitly and how it accomplishes its work. The early knowledge that prepares students to learn cannot just be about quantitative properties, it also needs to be about symbolic representations. Quantitative perceptions and their symbolic representations have different functions and each needs development (Varelas & Becker, 1997). Brain research, for example, indicates activation in different brain regions when people estimate quantities versus when they sym-bolically compute specific values (Dehaene, 2000). The opportunity to grapple with mathematical representations prepares the students to appreciate the ele-gance of an expert solution; for example, how the standard deviation solves the problem of different sample sizes by diving byn. To help students develop an in-terpretation of the work mathematical procedures need to accomplish, IPL places an emphasis on communicative clarity. Students know that they will have to put their solutions on the boards around the room. They also know that other students will present their solutions (without any coaching) and explain what de-cision they think the group made. This places a premium on representations that transparently carry meaning, and it helps students develop new interpretations about representations themselves.
AN EXAMPLE OF INVENTIVE PRODUCTION
In this section, we provide an extended example of how contrasting cases and mathematical invention play out in practice. Teachers ask students to work in small groups. Their early knowledge and inventions develop through an adaptive process (Chiu, Kessel, Moschkovich, & Munoz-Nunez, 2001; Lesh & Doerr, 2000). Stu-dents evolve their inventions and make revisions when they discover an internal flaw or perceive new quantitative properties that their invention cannot handle. Figure 2 provides a representative sample of the graphical inventions that different students produced on their way to developing a procedure for computing a reliabil-ity index. As students map between the data, the graphical representations, and their mathematical procedures, they go through a process of invention, noticing, and revision that helps them develop insight into the relation between representa-tions and the quantities they represent.
To help the adaptive process, the teacher walks about the room, occasionally in-teracting with each group. We do not encourage teachers to guide students to the conventional solution, because this can shortcut the students’ opportunity to de-velop the prior knowledge that will help them understand the conventional solution at a later time. Instead, we suggest three primary moves for the teachers, which am-plify the three benefits of production previously stated. One move is to ask the stu-dents to explain what they are doing. This places a premium on clarity and consis-tency. A second move is to ask students whether the results of their mathematical procedures correspond to their “common sense.” This ensures that students pay at-tention to specific symbol-referent mappings, instead of simply computing arbi-trary values. The third move is to push students towards more general solutions. The teacher encourages the students to find solutions that generalize across differ-ent legitimate configurations of quantity.
Our illustrative example comes from a group of boys working on the pitching machine problem. By this time, the group had already done invention activities in-volving graphing and central tendency. This was the first time they had worked on a problem that focused on variance, and the first time they had to develop a formula for computing a single value. The three boys were in a ninth-grade algebra class at a high achieving school in a white-collar suburb. For the most part, these boys were like other students in the classes we studied—they wanted to do well in school, and they had been relatively successful within the “traditional” pedagogy employed by the math department. We feature these boys because their cycles of production and noticing are compact and entertaining. The example comes from the second study.
Table 1 provides a transcript of the densest period of their invention activities. Only a few desultory exchanges have been removed for parsimony. We have folded the transcript into an outline that annotates the different types of learning-relevant activities. The outline headings are an overlay on the transcript; we do not mean to imply that interaction takes the hierarchical structure of an outline.
139
140
I. Invention Interaction 1
A. Inventing (distances from a point to all others)
1. S1: See you start at one point and count to others from it. B. Noticing limitations
1. Using contrasting cases to notice features of distributions (sample sizes)
(a) S3: Yeah but the other thing … Do you realize that over here there are only 4 balls that they tested?
(b) S1: Sure.
(c) S3: Over here there are 5.
2. Noting Problems with method (arbitrary starting point)
(a) S1: Yeah, but it doesn’t matter. You only have to use the number of balls in the calculation, or some that follows the… [inaudible]
(b) S3: So?
(c) S1: The problem is, for example, here if you start counting from here you’ll get a very different answer than if you start counting from here.
(d) S3: Exactly. (e) S2: Yeah. II. Invention Interaction 2
A. Inventing (distances from target)
1. S1: So I would find something that includes all of them. Like distance from the target. 2. S2: Yeah like [inaudible]
3. S1: Shortest distance from the target over longest distance from target is something I’d consider … sorry, longest over shortest.
B. Noticing limitations
1. Using Contrasting Cases to Notice Features of Distributions (outliers) (a) S2: Right here [Smythe] they’re all grouped together.
(b) S1: Yeah.
(c) S2: But this outlier so we just … (d) S3: The closest is 2.
(e) S2 I know. (f) S1: The largest is … (g) S2: I know but you have …
(h) S1: The longest over the shortest distance. C. Proposing a refinement (exclude outliers)
1. S2: Yeah or we could just eliminate … just eliminate that one. 2. S1: That will give you the most reliability …
D. Noticing limitations
1. Noticing problems with method (answer does not match intuition)
(a) S1: … the problem is … Then you’ll say this [Big Bruiser] is very reliable because the distances [shortest and longest] are the same. I was trying …
2. Using contrasting cases to notice features of distributions (accuracy vs. variability) (a) S3: Although this one [Ronco] would be very reliable because all of them are closer to
the target. Like for this one [Smyth], we can always move the target this way, so that you know every single ball … .
(continued)
141
A. Asking for clarification
1. T: What is your conclusion? Which one is the most reliable? 2. S3: Smyth’s finest.
3. T: Which one is the least? 4. S1: Big Bruiser Pitchomatic. 5. S2: Yeah.
6. S3: Ronco.
7. S1: Big Bruiser Pitchomatic. This one is. This one!? 8. S3: That one is less… less reliable and this one is most. B. Seeing if method matches intuition (rank ordering)
1. T: And what about these two? 2. S1: Oh, you want us to rank them. 3. S3: These two are in the middle.
4. T: But your rule should reflect your ranking.
5. S1: Well sure, we have to now come up with a rule that affects our pre-defined bias. 6. T: So, if you say this is the most reliable and your rule only comes up with this... is the
highest number somewhere in the middle then? C. Withholding answer (letting students try again)
1. S1: The problem is now that what we have to do—now that we are mathematically bigoted —we have to justify it.
2. T: That’s right.
3. S1: So how should we go about doing this? 4. T: That’s an interesting question.
5. S1: So what you’re going to say now is, “figure it out for yourself.” 6. T: That’s right. You got it.
7. S1: I figured how this class works already. IV. Invention Interaction 3
A. Inventing (distance between outliers)
1. S1: We have to either come up with an arbitrary formula and make our biases out of that, or we can do this and try to make a formula, which I like doing more, but it also involves work. 2. S2: Or, we call the angel of statistics.
3. S3: Wait, wait. She once said it doesn’t matter about the accuracy. Just think about it as the target’s gone.
4. S1: Ok.
5. S1: So distance between longest. So, we’ll just take the longest distance between 2 squares. 6. S3: Ok, over here there’s, there’s the 7. How long it is. But how about like the …
7. S1: For this one the longest distance between 2 squares is here and here, which is some big number I’m not going to calculate, ‘cause I’m lazy.
B. Proposing a refinement (Pythagorean theorem to find area between outliers) 1. S3: Let’s, let’s look at it as a triangle, and then we can find the area of it. 2. S1: Of the triangle?
3. S3: So that we … . No, or you see this is a triangle actually. We take the Pythagorean theorem.
(continued)
We join the group after they have begun work on the problem. Student 1 pro-posed that they should pick one point in each grid and find its distance to all the other points (I.A.1). This was a common early solution among all the groups, though it usually did not survive. Student 3, perhaps noticing an ambiguity in the method, commented that the contrasting grids had different sample sizes (I.B.1). The proposed method was silent about sample size, and Student 3 saw that a solu-tion may need to handle different numbers of pitches. Before the students could consider the implications of sample size, Student 1 noticed that his method yielded different answers depending on which point they started from (I.B.2). The insight that an arbitrary component can undermine a method was an important one. Across all the groups, the realization often occurred when two or more students used an underspecified method that generated different answers, and they discovered that they were making different assumptions about which points to include. Other times, the teacher helped students see the implications of an arbitrary component. Here, Student 1 realized the flaw in his method.
Student 1 proposed that they find the distance between the target and the point farthest from the target. He then quickly refined the proposal to state that they
TABLE 1 (Continued)
C Proposing a refinement (Pythagorean theorem to find distance between outliers) 1. S1: What are you trying to find out? The area?
2. S3: No. How long this is from this point to this point, which is the longest point. 3. S1: You find the distances between the farthest apart circles on the grid and call that our
index. The smaller the number, the more reliable. Sound good? 4. S2: Yeah.
D. Proposing a refinement (use a ruler to find distances) 1. S1: How are we going to do this?
2. S2: Get a ruler.
3. S1: But that’s not mathematical. E. Working on computations
1. All: <Students interact as they compute solutions> V. Teacher Engagement 2
A. Asking for Clarification 1. T: What are you doing?
2. S1: We find the varied surface, find which of them has the longest distances between them and use this as a reliability index, where the smallest is better.
B Pushing towards generalization (contrasting cases of two different patterns but same outliers) 1. T: So, you’re allowing the outlier to drive them.
2. S1: Yes.
3. T: Is there any reason for that?
4. S1: Because the farther out the outlier is, the less reliable … [inaudible]
5. T: So imagine I have something like this, OK? [Teacher draws two dots]. And I have another one, like a zillion times. [Teacher draws two dots as before, but puts very many dots next to one of them.] So is that right … these would get the same score?
Note. T = teacher; S = student.
should divide the longest distance by the shortest (II.A). Student 2, who was look-ing at the contrastlook-ing grids, noticed that a slook-ingle outlier could make a pitchlook-ing ma-chine appear unreliable, even though most of the points were tightly clustered. He offered the refinement that they exclude outliers (II.C.1). This “Windsorizing” re-finement was passed over, because Student 1 noticed that dividing the largest dis-tance by the smallest disdis-tance generated a small number when the disdis-tances are about the same (II.D.1). Student 1 seemed to imply that his method would violate his intuitions of which grid is the most variable.
Student 3, who was focusing more on the contrasting cases than the method proposed by Student 1, made a critical distinction. He distinguished accuracy from variability. He noticed that the Smyth machine had a very tight cluster of points, even though they were relatively far from the target. He made a constructive argu-ment that if Target X were moved closer, the pitching machine would appear more reliable (II.D.2.a). The students did not have an opportunity to work through the implications of this observation, because the teacher arrived at the group.
The teacher asked the students which machines they thought were the most and least reliable (III.A). Student 1 and Student 3 gave different answers. It is not clear whether they were using the same method, or whether Student 1 was using his method and Student 3 was using his intuition. The teacher took this as an opportu-nity to emphasize that the computed answers needed to correspond to their intu-itions. To do this, the teacher asked how the students would rank the grids they had not yet tried (III.B.1). The teacher followed up with the assertion that the method should yield results that correspond with their intuitive ranking (III.B.4). Student 1, who was fond of metacommentary, appeared to say that the method needed to implement their intuitive ranking of the grids (he said “affect our predefined bias”). The teacher expressed the point a second way by intimating that a grid that got the highest reliability score should not be in the middle of their intuitive rank-ing (III.B.6). Student 1 reiterated his understandrank-ing of the task, by ironically sug-gesting that after they made-up some mathematical solution, they then have to go back and justify it (III.C.1). This is not a bad characterization of the task. One can imagine many ways of justifying a mathematical procedure—clarity, parsimony, generality. Based on what the teacher said, a sufficient justification was that the procedure yields answers that are consistent with their qualitative beliefs about the reliability of the four grids. This was a good starting point, and the goal of the teacher’s immediate interaction. However, in a subsequent discussion (IV), the teacher pointed out that the method had to work for more than just these four grids, and she created a data set their method could not handle.
Student 1 asked for clarification for how to justify or create their mathematical invention (III.C.2). The teacher withheld giving an answer so the students could explore the problem space more fully. Student 1 answered his own question (III.C.5) and closed the interaction with the teacher by stating, “I figured out how this class works already.” The student understood that the students had the respon-sibility of inventing mathematical solutions. The remainder of the transcript
ishes the interaction (and includes the charming line at IV.A.2 when one student suggested they “call the angel of statistics,” a sentiment many of us have shared). Hopefully, the transcript indicates how invention led students to consider features of distributions, plus the work a good method must be able to accomplish with re-spect to those features. For example, the students noticed that their method could not choose points arbitrarily, that it needed to work for all the cases, that it should handle different sample sizes and outliers, and that there is a difference between variability and accuracy. The students were developing their quantitative perceptions about what “counts” in reliability and they used these developing perceptions to evaluate their methods. By hypothesis, the group invention activities and the simple teacher interventions can be sufficient to prepare students to learn and appreciate the signifi-cance of a conventional solution once it becomes available.
THE IPL INSTRUCTIONAL CYCLE
As we mentioned previously, we think the hidden value of invention activities is that they prepare students to learn. A long view of preparation for learning would aim for learning that occurs beyond the class in which instruction occurs. Instructors, for example, can teach general methods for learning that include study and critical thinking skills, habits of mind, and norms for generating con-jectures and argumentation. Ideally, such skills and attitudes would help students learn in other classes, college, and everyday life. Our research takes a more modest approach suited to the size of the interventions. It prepared students to learn procedures from traditional instructional methods that are likely to occur at other points within the same instructional unit, and then to use those procedures wisely. Therefore, the effects of our preparation are unlikely to generalize so that students are more prepared to learn, for example, in geometry or history. Thus, we take a “strong knowledge” approach (Newell & Simon, 1972) that develops topic specific preparedness.
Figure 3 schematizes the basic instructional cycle in IPL. The instructional cy-cle incorporates a number of pedagogical moves culled from the literature on early statistics instruction. For example, teachers ask students to have public discussions evaluating the strengths and weaknesses of their solutions, and they ask students to use representations to organize and support decisions involving data (e.g., Burrill & Romberg, 1998; P. Cobb, 1999; Derry, Levin, Osana, & Jones, 1998; Lajoie, 1998; Lehrer & Schauble, 2000; Lesh & Doerr, 2000; Shaughnessy, Garfield, & Greer, 1996). We emphasize the invention component of this cycle, but we believe the other elements are important as well.
The cycle is composed of invention-presentation couplets, plus direct instruc-tion and practice afterwards. Students often complete several inveninstruc-tion-presenta- invention-presenta-tion couplets, depending on the demands of the topic; Figure 3 shows two. In the
invention phase of each couplet, students work in small groups to invent their own solutions and representations to compare data sets. The transcript provided a feel for this interaction. Afterwards, each group draws its finished representation on the board. Other students, chosen at random, come to the board to explain a represen-tation and its implied conclusion, as if they had been part of the group. The need to make representations that “stand independently” encouraged students to develop more precise and complete representations, and it alerted them to the importance of communicable knowledge. In addition, just as the contrasting data sets helped students perceive important properties of distributions, the contrasting solutions that filled the board helped students notice important features of representations (Carpenter, Franke, Jacobs, Fennema, & Empson, 1997). The teacher’s role during these presentations is primarily to help student articulation and point out signifi-cant differences between representations. However, different teachers have differ-ent styles. The only hard constraint is that the teacher cannot describe the conven-tional method.
After students complete the invention couplets, the teacher provides a brief lec-ture (or assignment) that describes a conventional method for representing and comparing the data in the invention phase. For the cycle in Figure 3, the teacher de-scribed the formula for the mean deviation and students practiced on a new task.
The IPL cycle was designed to be a lenient instructional model that can support many different paths of interaction and invention. For example, during the small group activities, groups had different styles of social interaction, often came up with different solutions, and did not always notice the same quantitative properties. Nevertheless, the processes of noticing and evolving representations were consis-tent through these variations. So, rather than constructing a narrow path for suc-cess, as might be the case for materials that have a single correct answer, IPL is meant to provide a broad path that permits variation without spilling into chaos.
FIGURE 3 The Inventing to Pre-pare for Learning cycle. Each left-side arrow represents an invention activity that students complete in small groups, usually for 30 min. Each right-side arrow represents class dis-cussions about the inventions that stu-dents made. Stustu-dents can complete several invention-presentation cou-plets. The couplets prepare students to learn from direct instruction (a lecture in this figure), which follows the in-vention and presentation activities. Finally, students briefly practice.
The same breadth of useful interaction extends to the role of the teacher. IPL mate-rials are meant to permit flexibility in teaching styles. One design goal for IPL is to provide a method that is consistent with National Council of Teachers of Mathe-matics (2000) prescriptions, but that does not hinge on the exceptional skills and supports necessary to conduct much reform-based instruction. A key move in achieving this goal is freeing the teacher from the rhetorical task of exerting selec-tive pressure towards a canonical solution. This can soften the natural inclination of the teacher to “deliver” during the invention-presentation couplets. It is a precar-ious task to lead a classroom of students, often with different ideas in mind, to the standard solution or to provide just-in-time instruction without “spilling the beans” and destroying the active process of knowledge evolution. Because the purpose of these activities is to prepare students to learn, the teacher does not have to guide classroom discussion and invention towards a conventional solution. It is sufficient to help students notice properties of distributions and the work that their represen-tations are trying to accomplish.2As we show in the following studies, the pay off
can come later, when the teacher provides direct instruction or resources that offer the conventional solution invented by experts.
THE ASSESSMENT EXPERIMENT
A focus on preparation for learning requires the development of new types of assess-ment. We pointed out that many assessments employ “sequestered problem solv-ing,” in which students work without access to resources for learning (Bransford & Schwartz, 1999). Although sequestered problem solving may be a good measure of mature understanding, it can be a blunt instrument for assessing whether someone is ready to learn. The observation echoes Vygotsky’s (1987) arguments for evaluating a child’s zone of proximal development.
Like a gardener who in appraising species for yield would proceed incorrectly if he considered only the ripe fruit in the orchard and did not know how to evaluate the condition of the trees that had not yet produced mature fruit, the psychologist who is limited to ascertaining what has matured, leaving what is maturing aside, will never be able to obtain any kind of true and complete representation of the internal state of the whole development. (p. 200)
Assessments that evaluate how well students can learn, given resources or scaffolds, are calleddynamic assessments(Fueurstein, 1979). Without dynamic
2Students do not have to discern all the relevant properties that differentiate the contrasting data
sets. Elsewhere, we have found that noticing a reasonable subset provides a critical mass that prepares students to appreciate additional properties when they are addressed in a subsequent learning opportu-nity (Schwartz & Bransford, 1998).
assessments, it is difficult to evaluate whether an instructional method has suc-cessfully prepared students for future learning. Dynamic assessments can help reveal the hidden value of learning activities that appear inefficient, given tradi-tional assessments of memory and problem solving. For example, Schwartz and Bransford (1998) asked students to analyze simplified data sets from classic memory experiments and to invent their own graphs to show what they discov-ered. After students completed these activities, they did poorly on true–false tests, compared to students who wrote a summary of a chapter on the same memory experiments. However, when students in both conditions received a learning resource in the form of a follow-up lecture, the results reversed them-selves. On a subsequent assessment, the invention students showed that they learned much more deeply from the lecture. The invention students made twice as many correct predictions about a novel experiment than the summarize stu-dents. (We know the gains made by these inventing students were due to learn-ing from the lecture, because another group of inventlearn-ing students did not hear the lecture and did quite poorly on the prediction task.) Dynamic assessments, in this case, of students’ abilities to learn from a lecture, can help identify forms of instruction that support learning.
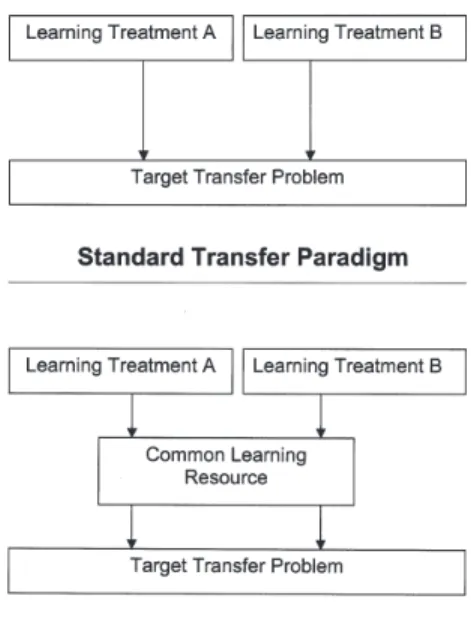
The study of transfer is an excellent domain to help clarify and evaluate the po-sition we are advocating towards instruction and assessment. The top of Figure 4 summarizes the transfer paradigm used in many experiments. Students learn Topic X by Instructional Treatment A or B. Afterwards, they receive a transfer problem
FIGURE 4 Preparation for future learning suggests a different form of transfer study. The top panel schematizes the standard transfer par-adigm in which students learn and have to transfer to solve a new prob-lem. The bottom panel shows a trans-fer paradigm for assessing prepared-ness for learning. Students from both instructional treatments have to trans-fer to learn from a common resource and then transfer what they learn to solve a subsequent transfer problem.
that is structurally similar to Topic X, but that has a different surface form. Re-searchers then compare whether A or B leads to better performance on the seques-tered transfer problem to draw conclusions about effective instruction or knowl-edge. This is a useful paradigm, because transfer tasks are often more sensitive to differences in understanding than direct tests of memory (e.g., Michael, Klee, Bransford, & Warren, 1993).
The preparation for learning perspective suggests an alternative experimental paradigm shown at the bottom of Figure 4. As before, students study Topic X in one of two ways. The difference is that students from both conditions then receive equal opportunities to learn from a new resource. For example, they might receive a worked example relevant to Topic X. After the common opportunity to learn, stu-dents then receive a transfer problem that depends on material included in the learning resource. Researchers can then compare performance on the final transfer problem to determine which method of instruction better prepared students to ben-efit from the learning opportunity. We label this approach adouble transfer para-digm, because students need to transfer what they learned from the instructional method to learn from the resource, and they need to transfer what they learned from the resource to solve the target problem. This seems like a more complete model of transfer, because it considers both the “transfer in” that helps people to learn and the “transfer out” that helps them apply that learning.
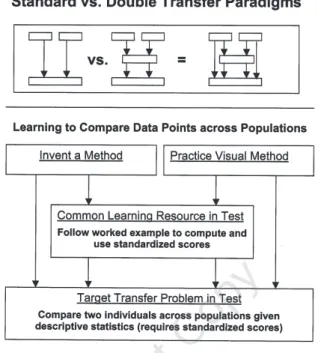
In the two design studies, we conducted a controlled assessment experiment that directly compared the value of the standard and double transfer methods for evaluating learning. Figure 5 provides an overview of the assessment experiment. The experiment started on the last day after the students had studied variability.3
The topic of the experiment was standardized scores, which are a way of normaliz-ing data (e.g., gradnormaliz-ing on a curve) and comparnormaliz-ing data across two distributions (e.g.,zscores). In the instructional phase of the study, students received a problem that included raw data and histograms (Appendix A). The students had to compare people from the two distributions. For example, did Bill break the high-jump world record more than Joe broke the long-jump record? In the invention treatment stu-dents had to create their own way to solve this problem. They did not receive feed-back and there were no class presentations. Thus, this treatment isolates the value of invention activities. In the tell-and-practice treatment, students learned a visual procedure for marking deviation regions to make the comparison (see Appendix B). They practiced the procedure to solve the problem. These two treatments con-stituted the instructional factor of the design.
The second factor was whether students received a resource in the posttest. Those students who received the resource problem in the posttest completed the
3We confined the experimental comparison of the two instructional treatments to a single day. We,
and the teachers, agreed that it was inappropriate to put half the students into a 2-week treatment that we hypothesized would not prepare the students to learn.
double transfer paradigm, whereas those who did not, completed the standard paradigm. The resource was a worked example that showed how to compute standardized scores (Appendix C). The example showed how Cheryl determined if she was better at the high dive or low dive. The students had to follow the ex-ample to determine if Jack was better at high jump or javelin. To see if students learned from the worked example, there was a target transfer problem later in the test. Here is an example:
Susan and Robin are arguing about who did better on their final exam last pe-riod. They are in different classes, and they took different tests. Susan got an 88 on Mrs. Protoplasm’s biology final exam. In her class, the mean score was
FIGURE 5 The assessment experiment used to compare the standard and double transfer par-adigms. Students completed one of two instructional treatments: invention-based (inventing their own solution without feedback) versus tell-and-practice (learning a demonstrated visual procedure and practicing). Half of the students in each treatment had to solve the target transfer problem directly, per the standard paradigm. The other half of the students in each treatment re-ceived a learning resource embedded in the test, and then had to solve the target transfer prob-lem, per the double transfer design. The question is whether the inclusion of the embedded re-source changes the results on the target transfer problem. The assessment experiments attempt to show (a) the double transfer paradigm detects levels of knowing missed by the standard para-digm, and (b) some forms of instruction prepare students to learn better than others.
a 74 and the average deviation was 12 points. The average deviation indi-cates how close all the students were to the average. Robin earned an 82 on Mr. Melody’s music exam. In that class, the mean score was a 76 and the av-erage deviation was 4 points. Both classes had 100 students. Who do you think scored closer to the top of her class, Susan or Robin? Use math to help back up your opinion.
During instruction, the students received problems with raw data, but this prob-lem only includes descriptive measures. To compare Robin and Susan, one finds the standardized score of each by subtracting the class average from the student’s score and dividing by the class variability. The worked example resource in the test showed this method. The question was which instructional treatment would best prepare students to learn from the worked example, and ideally, transfer this learn-ing to solve the target problem. Though worked examples are a common method for teaching procedures, students do not always learn as well from them as they might (e.g., Chi, de Leeuw, Chiu, & Lavancher, 1994; Reder, Charney, & Morgan, 1986). We thought that the students in the invention condition would develop the early knowledge that would help them learn, whereas the tell-and-practice stu-dents would not. Specifically, we predicted the stustu-dents from the tell-and-practice instructional condition would perform the same on the target transfer problem whether or not they received the embedded resource. They would not be prepared to learn from the worked example, and they would interpret it as a “plug and chug” problem. In contrast, we thought the students in the invention condition would in-terpret the significance of the worked example. The invention students who re-ceived the resource problem would do best on the target transfer problem—better than the invention students who did not receive the resource, and better than the tell-and-practice students who did receive the resource. If true, this would show the value of the double transfer paradigm and the value of activities that encourage stu-dents to invent their own solutions.
EXPERIMENT 1
To examine the value of IPL instruction, the study assessed the extent to which sev-eral classes of ninth-grade algebra students had been prepared to learn about statis-tics. Sometimes, we told the students exactly what they were supposed to learn (e.g., in a lecture), and we determined if they learned from this telling. Other times students had to learn new statistical concepts during the test. The tests did not sig-nal that they included resources from which students could learn; students needed to recognize that, which makes these dynamic assessment items instances of spon-taneously transferring to learn.
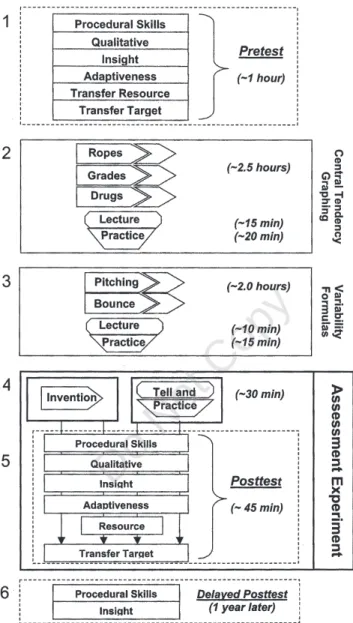
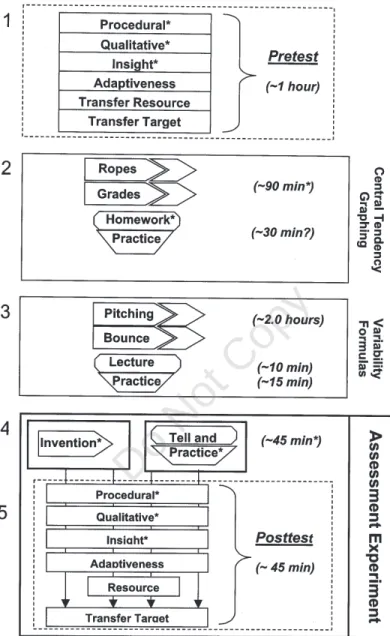
There were two main components to the study. There was the larger design study that all students completed, plus a set of measures to determine its effective-ness. There was also the assessment experiment on transfer appended to the end of the study. Figure 6 shows the overall instructional intervention, including the con-tent of each cycle and the approximate times. Box 1 shows that the study began with a pretest (see Method). Students then completed an IPL cycle on graphing and central tendency (Appendix D), which culminated in a lecture on graphing data (Box 2). They practiced briefly. They then completed an IPL cycle on the topic of variability, which culminated in a short lecture on the mean deviation (Box 3). We were particularly interested to know if students were prepared to learn from this brief lecture. In the final day of instruction, the classes were assigned to different instructional treatments to begin the formal assessment experiment comparing the single and double transfer paradigms (Box 4). Students then took a posttest to as-sess the effects of the overall design study (Box 5). Additionally, half the tests in-cluded the resource item and half did not, thereby completing the assessment ex-periment. Finally, a subset of students took a delayed posttest (Box 6).
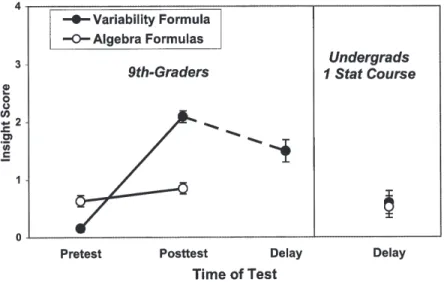
We developed a number of new assessments to evaluate the IPL instruction. Some of these assessments were quite difficult. For example, one item required students to invent a way to measure the variability of bivariate data, which we never broached during the lessons. This makes it difficult to interpret the size of gains from pre- to posttest. Therefore, we collected benchmarks. We gave the same test to college students who had taken one semester of college statistics to gauge the difficulty of the items. A limitation of this comparison, however, is that the ninth-grade students had recently completed statistics instruction but not all the college students had. Therefore, a subset of the ninth-grade students took a delayed posttest on select items a year later.
Method
Participants. Six classes of ninth-grade algebra students from a highly suc-cessful public school (based on state test scores) participated at the end of the school year. According to their teachers and the school district guidelines, the stu-dents had worked on central tendency in earlier grades, but generally had not worked on graphs or measures of variability, except perhaps the range. One hun-dred students provided informed consent to report their data, of which 95 were present at both pre- and posttest. The students received instruction in their regular classes. Students who missed some instruction were still included in the data anal-ysis to make sure the gains were reflective of what would appear in a normal schooling situation. A random subset of 30 students also took a delayed posttest 1 year later. Additionally, the study recruited 25 undergraduates from a public uni-versity rated in the top 20 byUS News and World Report. The college students had taken one college statistics course within the past 2 years. By luck, the college
152
FIGURE 6 The complete set of activities in Experiment 1. (1) Students began with a pretest (see Appendix E). (2) They then completed the graphing and central tendency Inventing to Pre-pare for Learning cycle that included three invention activities, a lecture, and practice (see Ap-pendix D). (3) Next, they completed a cycle on variability that began with the task shown in Fig-ure 1. (4) After the variability cycle, the classes separated into two treatments to begin the transfer assessment experiment. (5) Afterwards, they took the posttest. Half of the posttests in-cluded a resource relevant to the target transfer problem and half did not. (6) One year later, a subset of 30 students completed a delayed posttest with select measures.
dents represented four different introductory statistics courses, which ensured a good sample of instructional methods that had each covered variance.
Design. The study employed a pre–posttest design, with a subset of students also completing a delayed posttest. For the larger design study, all students com-pleted the IPL curriculum. For the assessment experiment that began on the final day of instruction, the six classes were randomly assigned to the two instructional treatments, invention versus tell-and-practice. Within each class, half of the stu-dents were randomly assigned to receive a posttest with the worked example re-source (see Table 2 for sample sizes). (For the pretest, all the students received the resource problem to permit a “level playing field” covariate for evaluating perfor-mance on the posttest transfer problem.) All told, this created a 2 × 2 × 2 design of Instructional Treatment × Presence/Absence of Resource in Posttest × Pre-test/Posttest Performance on the Transfer Problem.
During the instructional phase of the assessment experiment, the invention con-dition worked with a sports problem and the tell-and-practice concon-dition used a grading problem (Appendix A). There were also two forms of the target transfer problem (Appendix E). One transfer problem used a sports context and one used a grading context. (Students completed one form at pretest and the other at posttest, counter-balanced across conditions.) If the tell-and-practice students performed relatively better on the grade transfer problem, and the invent students performed relatively better on the sports transfer problem, then it would seem probable that the specific problem context led to transfer. However, if students from the two con-ditions did not show superiority for one problem version over another, it suggests that students were not using the surface similarity between the instruction and test problems. In Experiment 2, students received instruction using both contexts to re-move the confound.
Procedure. Students completed pre- and posttests a few days before and af-ter the inaf-tervention. The inaf-tervention used roughly 6 hr of classroom time spread over 2 weeks. Daniel Schwartz instructed the classes, which were videotaped by Taylor Martin. During small group work, we walked around the room to discuss the problems with the students. The classroom teachers were mostly present throughout, and although they were free to talk with students during group work, they tended to observe rather than participate.
For the invention activities, the students worked in small groups of 2 to 5 stu-dents for each task (composed according to their classroom teacher’s judgment, the basis of which varied across teachers). Students worked with three graphing data sets in turn. Afterwards, the instructor provided a lecture on bar charts of means, histograms, box and whisker plots, and stem and leaf graphs. Students de-cided which they preferred for each of the data sets, and they practiced each format on a new problem. Students then worked on two formula activities that emphasized
variability. Afterwards, the instructor displayed the mean deviation formula on the board and stated that in just a few minutes they would understand the formula per-fectly. The formula for the mean deviation is4:
x-X n
å
/The lecture included the students’ first introduction to an iterative operator (sigma) and a summary symbol like x-bar (the mean). The instructor described the formula and how it operated over small data sets. To support this explanation, the instructor mapped the steps graphically by indicating the position of the mean un-der an orun-dered list of data and by drawing horizontal lines indicating the distances of each point from the mean. The lecture was intentionally brief to see if students had been prepared to learn: 5 to 10 min (plus 15 min of subsequent practice). The instructor wandered the room helping students as necessary. After the lesson on the mean deviation, the students began the assessment experiment.
For the three tell-and-practice classes, the teacher introduced grading on a curve and then told the students a procedure for marking deviation regions on a histo-gram to compare scores (Appendix B). Students practiced on a new data set for comparing grades. For the three invention classes, the students did not receive the introduction to grading on a curve, and the students tried to invent a way to deter-mine whether a long jump or pole vault competitor had broken their sport’s prior world record by a greater relative amount. Students worked in small groups. There were no class presentations, no sharing of solutions, and the students did not re-ceive any feedback on their inventions. No students invented a correct solution in the invention condition.
Assessments. Students completed paper and pencil tests (Appendix E). The test had two forms. Several questions appeared with different cover stories or dif-ferent numbers on each form. Students completed one form at pretest and another at posttest (counterbalanced). Question order was randomized for each student with the constraint that the target transfer problem always appeared at least two problems after the resource item. The delayed posttest included problems that evaluated the students’ understanding and memory of the mean deviation.
4The mean deviation procedure first finds the mean of the data, represented byx-bar. It iteratively subtracts the mean from each value; these values indicate the distance or deviation of each point from the mean or center of the data. It uses absolute value of each distance, because variability in this case is about the size of the deviations and not their direction. The formula sums all the distances and divides by the sample sizen. The division byncomputes the average deviation and helps handle the problem of comparing across different sample sizes, plus it makes the measure of variability in the same scale as the mean.
Measures of procedural skills asked students to compute the mean, median, mode, and mean deviation, and to make a graph. For the qualitative reasoning items, students had to reason about the relation between different descriptive sta-tistics of central tendency.
The symbolic insight problems were novel assessments and required students to see through a formula to the quantitative work it does or does not do. There were two types. One type showed a formula and directly asked why it includes a specific operation. For example, the test showed the mean deviation and asked students why the formula divides byn. One problem asked about the mean devi-ation and two problems asked about algebra formulas that the students had al-ready studied (Pythagorean theorem and slope formula). Although very simple and decontextualized, the format may offer a quick way to determine whether students understand how a formula accomplishes its quantitative work.
The second type of insight problem (the IQ problem) provided students with data and a summary statistic, and it tested whether students evaluated the statistic as a good characterization of the data. The problem presents an industrialist’s argu-ment about preferring to hire blue people over green people because they have higher IQs. The problem provides the mean IQ of the two groups and the raw data, and asks student to evaluate the argument. The question was whether students would blindly accept the average IQ as a fair statistic, or whether they would exam-ine the data and notice it was bimodal for the green people, which invalidates the use of the mean as a statistic.5We constructed the item in response to a book that
had recently received attention by comparing the IQs of different races. We thought it was useful to have students think about the conclusions one can draw about individuals from a comparison of group means.
We used a single item to assess whether students were developing an adaptive base of knowledge (cf. Hatano & Inagaki, 1986). Students needed to determine who was the more consistent scorer per number of minutes played, given a scat-ter plot of the data. The instructional activities never introduced instances of covariation. This item is like many tests of sequestered problem solving, because it does not include explicit resources for learning. However, it differs in that it is a dynamic assessment—students need to learn a new concept in the course of the problem solving, and it does include an implicit resource to support learning; namely, a line that shows the predicted scoring. If students have a good under-standing of variability, they might recognize that they can compute the average deviation of each point from the regression line.
The last form of assessment was the target transfer problem and was part of the assessment experiment previously described.
5One could reason that in the long run, the industrialist was right. One would get a higher IQ on
av-erage with blue people, despite the bimodal distribution of green people. Nobody did this.
Results
We progress through the results in the order of their importance to the demonstration that invention activities can prepare students to learn. We first review the comparison of the standard and double transfer paradigms in the assessment experiment and then the assessment of adaptiveness. Both directly test students’readiness to learn in new situations. We then examine how well the students learned to think about the quanti-tative referents of formulas and summary statistics. Finally, we evaluate whether stu-dents learned basic procedural skills, even though the direct instruction and practice with the procedures was quite brief.
Throughout, we have adopted a significance level ofp< .05. To score student responses, we developed coding schemes post hoc. For each item, one of five pri-mary coders used a subset of the answers to develop a scheme that captured the full range of solutions. In the following, we detail the most relevant and interesting. More typically, we simply indicate the percentage of students who gave answers that were both accurate and appropriate (i.e., correct), allowing for minor compu-tational errors. Once a coding scheme was established, a secondary coder trained on a subset of tests. The primary and secondary coders checked reliability using 40 new tests drawn randomly from the pre- and posttests. For each of the test items in this study and the next, intercoder agreement was 95% or above. The primary cod-ers subsequently scored all the data for their problems.
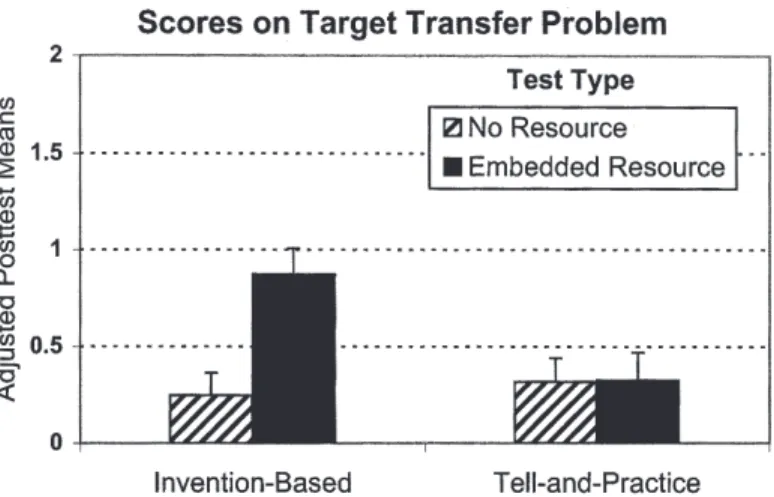
Assessment experiment. In the assessment experiment, the question was which condition would do best on a target transfer problem that required standard-ized scores. A correct computational solution to the target transfer problem re-ceived a score of 2, a qualitatively correct solution (including a graphing solution) received a 1, and all other responses received a 0.
At pretest, where all students received the worked example resource in their test, 17% attained a score of 1 or 2 on the transfer problem,M= 0.32,SD= 0.72, with no differences between conditions. At posttest, half of the students in each in-structional condition received the worked example (which they followed quite well; 91.7% computed the correct answer with no significant differences between conditions). Figure 7 shows the adjusted posttest means on the target transfer prob-lem. Students in the tell-and-practice condition performed the same, whether or not they received the resource in their test. In contrast, the students in the invention condition did much better, but only if they had the resource in their test. Stated an-other way, students in the invention and tell-and-practice conditions performed about the same when they did not receive the resource, but looked different when they did. This demonstrates the value of the double transfer paradigm, because it detected levels of understanding missed by the single transfer paradigm. A re-peated measures analysis compared the pre- to posttest gains on the target problem for the crossed factors of instructional method and the presence/absence of the