著者
Capi t ai ne Er w
an, M
ous s a N
aw
el O
ul d, Louot
Chr i s t ophe, Bar det Syl vi a M
. , Kano H
i deaki ,
D
uponc hel Ludovi c , Leveque Phi l i ppe, Couder c
Vi nc ent , Lepr oux Phi l i ppe
j our nal or
publ i c at i on t i t l e
Bi om
edi c al O
pt i c s Expr es s
vol um
e
9
num
ber
1
page r ange
245- 253
year
2017- 12
権利
( C) 2017 O
pt i c al Soc i et y of Am
er i c a. U
s er s m
ay
us e, r eus e, and bui l d upon t he ar t i c l e, or us e
t he ar t i c l e f or t ext or dat a m
i ni ng, s o l ong
as s uc h us es ar e f or non- c om
m
er c i al pur pos es
and appr opr i at e at t r i but i on i s m
ai nt ai ned. Al l
ot her r i ght s ar e r es er ved.
U
RL
ht t p: / / hdl . handl e. net / 2241/ 00150668
Fast epi-detected broadband multiplex CARS
and SHG imaging of mouse skull cells
E
RWANC
APITAINE,
1,6N
AWELO
ULDM
OUSSA,
1C
HRISTOPHEL
OUOT,
1S
YLVIAM. B
ARDET,
1H
IDEAKIK
ANO,
2,3,4, L
UDOVICD
UPONCHEL,
5P
HILIPPEL
ÉVÊQUE,
1V
INCENTC
OUDERC,
1 ANDP
HILIPPEL
EPROUX1,*1XLIM UMR 7252, CNRS-Université de Limoges, 123 avenue Albert Thomas, 87060 Limoges Cedex,
France
2Department of Applied Physics, Graduate School of Pure and Applied Sciences, University of Tsukuba,
1-1-1 Tennodai, Tsukuba, Ibaraki, 305-8573, Japan
3Institute of Applied Physics, University of Tsukuba, 1-1-1 Tennodai, Tsukuba, Ibaraki, 305-8573, Japan 4Tsukuba Research Center for Interdisciplinary Materials Science (TIMS), University of Tsukuba, 1-1-1
Tennodai, Tsukuba, Ibaraki, 305-8571, Japan
5LASIR UMR 8516, CNRS-Université Lille 1, Sciences et Technologies, 59655 Villeneuve d’Ascq Cedex,
France
6erwan.capitaine@xlim.fr *philippe.leproux@xlim.fr
Abstract: We present a bimodal imaging system able to obtain epi-detected mutiplex coherent
anti-Stokes Raman scattering (M-CARS) and second harmonic generation (SHG) signals coming from biological samples. We studied a fragment of mouse parietal bone and could detect broadband anti-Stokes and SHG responses originating from bone cells and collagen respectively. In addition we compared two post-processing methods to retrieve the imaginary part of the third-order nonlinear susceptibility related to the spontaneous Raman scattering.
© 2017 Optical Society of America under the terms of theOSA Open Access Publishing Agreement
OCIS codes:(300.6230) Spectroscopy, coherent anti-Stokes Raman scattering; (180.4315) Nonlinear microscopy;
(170.3880) Medical and biological imaging.
References and links
1. L. L. McManus, G. A. Burke, M. M. McCafferty, P. O’Hare, M. Modreanu, A. R. Boyd, and B. J. Meenan, “Raman spectroscopic monitoring of the osteogenic differentiation of human mesenchymal stem cells,” Analyst136, 2471 (2011).
2. B. Blum, O. Bar-Nur, T. Golan-Lev, and N. Benvenisty, “The anti-apoptotic gene survivin contributes to teratoma formation by human embryonic stem cells,” Nat. Biotechnol.27, 281 (2009).
3. A. Downes, R. Mouras, P. Bagnaninchi, and A. Elfick, “Raman spectroscopy and CARS microscopy of stem cells and their derivatives,” J. Raman Spectrosc.42, 1864–1870 (2011).
4. E. Gentleman, R. J. Swain, N. D. Evans, S. Boonrungsiman, G. Jell, M. D. Ball, T. A. V. Shean, M. L. Oyen, A. Porter, and M. M. Stevens, “Comparative materials differences revealed in engineered bone as a function of cell-specific differentiation,” Nat. Mater.8, 763–770 (2009).
5. H. K. Chiang, F.-Y. Peng, S.-C. Hung, and Y.-C. Feng, “In situ Raman spectroscopic monitoring of hydroxyapatite as human mesenchymal stem cells differentiate into osteoblasts,” J. Raman Spectrosc.40, 546–549 (2009).
6. Y. J. Lee, S. L. Vega, P. J. Patel, K. A. Aamer, P. V. Moghe, and M. T. Cicerone, “Quantitative, Label-Free Characterization of Stem Cell Differentiation at the Single-Cell Level by Broadband Coherent Anti-Stokes Raman Scattering Microscopy,” Tissue Eng. Part C Methods20, 562–569 (2014).
7. A. D. Hofemeier, H. Hachmeister, C. Pilger, M. Schürmann, J. F. W. Greiner, L. Nolte, H. Sudhoff, C. Kaltschmidt, T. Huser, and B. Kaltschmidt, “Label-free nonlinear optical microscopy detects early markers for osteogenic differentiation of human stem cells,” Sci. Rep.6, 26716 (2016).
8. A. Volkmer, J.-X. Cheng, and X. Sunney Xie, “Vibrational Imaging with High Sensitivity via Epidetected Coherent Anti-Stokes Raman Scattering Microscopy,” Phys. Rev. Lett.87, 023901 (2001).
9. J.-x. Cheng, A. Volkmer, L. D. Book, and X. S. Xie, “An Epi-Detected Coherent Anti-Stokes Raman Scattering (E-CARS) Microscope with High Spectral Resolution and High Sensitivity,” J. Phys. Chem. B105, 1277–1280 (2001).
#307240 Journal © 2018
10. Z. Wang, W. Zheng, C.-Y. S. Hsu, and Z. Huang, “Epi-detected quadruple-modal nonlinear optical microscopy for label-free imaging of the tooth,” Appl. Phys. Lett.106, 033701 (2015).
11. A. Lukic, S. Dochow, H. Bae, G. Matz, I. Latka, B. Messerschmidt, M. Schmitt, and J. Popp, “Endoscopic fiber probe for nonlinear spectroscopic imaging,” Optica4, 496–501 (2017).
12. M. Müller and J. M. Schins, “Imaging the thermodynamic state of lipid membranes with multiplex CARS microscopy,” J. Phys. Chem. B106, 3715–3723 (2002).
13. G. W. H. Wurpel, J. M. Schins, and M. Müller, “Chemical specificity in three-dimensional imaging with multiplex coherent anti-Stokes Raman scattering microscopy,” Opt. Lett.27, 1093–1095 (2002).
14. M. Okuno, H. Kano, P. Leproux, V. Couderc, and H.-O. Hamaguchi, “Ultrabroadband multiplex CARS microspec-troscopy and imaging using a subnanosecond supercontinuum light source in the deep near infrared,” Opt. Lett.33, 923 (2008).
15. C. M. Hartshorn, Y. J. Lee, C. H. Camp, Z. Liu, J. Heddleston, N. Canfield, T. A. Rhodes, A. R. Hight Walker, P. J. Marsac, and M. T. Cicerone, “Multicomponent chemical imaging of pharmaceutical solid dosage forms with broadband CARS microscopy,” Anal. Chem.85, 8102–8111 (2013).
16. H. Segawa, M. Okuno, H. Kano, P. Leproux, V. Couderc, and H.-o. Hamaguchi, “Label-free tetra-modal molecular imaging of living cells with CARS, SHG, THG and TSFG (coherent anti-Stokes Raman scattering, second harmonic generation, third harmonic generation and third-order sum frequency generation),” Opt. Express20, 9551 (2012). 17. H. Segawa, Y. Kaji, P. Leproux, V. Couderc, T. Ozawa, T. Oshika, and H. Kano, “Multimodal and multiplex spectral
imaging of rat cornea ex vivo using a white-light laser source,” J. Biophotonics8, 705–713 (2015).
18. E. Capitaine, N. Ould Moussa, C. Louot, C. Lefort, D. Pagnoux, J.-R. Duclère, J. F. Kaneyasu, H. Kano, L. Duponchel, V. Couderc, and P. Leproux, “Coherent anti-Stokes Raman scattering under electric field stimulation,” Phys. Rev. B 94, 245136 (2016).
19. A. Awonusi, M. D. Morris, and M. M. J. Tecklenburg, “Carbonate Assignment and Calibration in the Raman Spectrum of Apatite,” Calcif. Tissue Int.81, 46–52 (2007).
20. G. S. Mandair and M. D. Morris, “Contributions of Raman spectroscopy to the understanding of bone strength,” Bonekey Rep.4(2015).
21. G. Zhang, D. J. Moore, C. R. Flach, and R. Mendelsohn, “Vibrational microscopy and imaging of skin: from single cells to intact tissue,” Anal. Bioanal. Chem.387, 1591–1599 (2007).
22. I. R. Hill and I. W. Levin, “Vibrational spectra and carbon–hydrogen stretching mode assignments for a series of n-alkyl carboxylic acids,” J. Chem. Phys.70, 842–851 (1979).
23. B. G. Saar, C. W. Freudiger, J. Reichman, C. M. Stanley, G. R. Holtom, and X. S. Xie, “Video-rate molecular imaging in vivo with stimulated Raman scattering,” Science330, 1368–1370 (2010).
24. E. M. Vartiainen, H. A. Rinia, M. Müller, and M. Bonn, “Direct extraction of Raman line-shapes from congested CARS spectra,” Opt. Express14, 3622 (2006).
25. A. Savitzky and M. J. Golay, “Smoothing and differentiation of data by simplified least squares procedures,” Anal. Chem.36, 1627–1639 (1964).
26. P. Deladurantaye, A. Paquet, C. Paré, H. Zheng, M. Doucet, D. Gay, M. Poirier, J.-F. Cormier, O. Mermut, B. C. Wilson, and E. J. Seibel, “Advances in engineering of high contrast CARS imaging endoscopes,” Opt. Express22, 25053–25064 (2014).
1. Introduction
The use of non-destructive, non-invasive and label-free methods is particularly interesting to realize medical diagnosis of diseases or to develop tissue engineering and regenerative medicine [1]. In bone tissue engineering, the discrimination of different cellular pools is crucial prior to the application of any clinical treatment [2, 3]. In this context spontaneous Raman [1, 3–5] and coherent anti-Stokes Raman scattering (CARS) [3, 6, 7] spectroscopies have proven that they could distinguish progenitor cells by detecting specific molecular vibrations.
To obtain a CARS signal, the difference between the optical frequencies of a pump and a Stokes laser beam,ωp−ωS, has to match the vibrational frequency of a molecule. The use of a
third beam as a probe wave can then, by four-wave mixing, lead to the generation of anti-Stokes signal both emitted in the forward and the backward directions. Usually, the role of the probe is given to the pump beam so that the frequency of the anti-Stokes wave isωaS=2ωp−ωS. In most
not collected due to destructive interferences. Consequently, epi-detection seems to be more suitable for living cells monitoring because the solvent does not participate in the generation of backward signal [9]. Furthermore, in this case, the implementation of the experimental setup is facilitated and the study ofin vivosamples become possible. Epi-CARS analysis of biological objects has been demonstrated by measuring single-frequency anti-Stokes wave [10, 11], but the simultaneous acquisition of different anti-Stokes wavelengths has not been achieved to our knowledge. To achieve multicolor epi-CARS, a supercontinuum radiation can be used as a broadband Stokes wave. In this manner, a broad anti-Stokes spectrum covering the fingerprint and the CH vibration regions can be instantaneously acquired. This system is well established in the forward configuration and called multiplex CARS (M-CARS) [12–14]. One publication introduces its implementation in epi-detection but it was only applied to the study of a mineral sample with long pixel dwell time [15]. In addition to the vibrational signal, second harmonic generation (SHG) from the pump beam, due to the presence of non-centrosymmetric components in the sample such as type I collagen fibrils, can also be acquired [16–18]. Thereby, CARS and SHG detection can provide rich and complementary molecular information.
We propose here a bimodal system, with epi-detected M-CARS and SHG, applicable to biological tissues. To demonstrate the ability of our setup, we study biopsies from mouse skull bone. We measure CARS spectra from 700 cm−1to 3200 cm−1 with a spectral resolution of 2 cm−1 and a short pixel dwell time of 5 ms. Maps of typical vibrations of skull bone cells and SHG signal coming from collagen fibrils are obtained. We then compare qualitatively two algorithms that can extract the resonant signal from raw CARS data and we evaluate their respective post-processing time. Finally we compare our results with two-photon fluorescence images obtained on similar biopsies with different staining methods in order to confirm the presence of skull bone cells.
2. Materials and methods
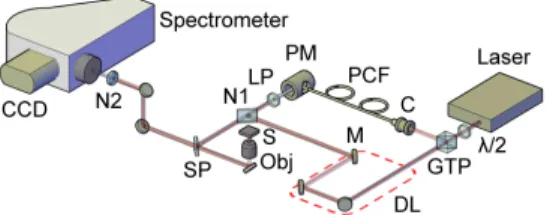
The schematic of the epi-detected M-CARS and SHG system is presented in Fig.1. We use a laser source (Spark Lasers, Sirius series, 1064 nm, 60 ps, 110 kHz, linearly polarized) to generate the pump radiation. By using a half-wave plate and a Glan-Taylor polarizer (GTP), a part of the pump is directed into a photonic crystal fiber (PCF) to generate an infrared supercontinuum Stokes wave from 600 nm to 1650 nm. To compensate for the difference of optical length between the pump and the Stokes beams and, thus, to assure their temporal overlapping, a delay-line is set on the path of the pump. A long-pass filter at 1050 nm (Thorlabs, FEL1050) is used on the Stokes beam to suppress wavelengths that could be confused with anti-Stokes signals. The two beams are then spatially combined by mean of a notch dichroic mirror (Semrock, NFD01-1064-25x36) which can reflect the pump in the direction of propagation of the Stokes. Then, the beams travel together toward a dichroic short-pass mirror at 1000 nm (Thorlabs, DMSP1000R) that reflects them toward a microscope objective (Olympus, UPlanSApo 60x, N.A. = 1.2, water immersion) that focuses them onto the sample. The backscattered signal, collimated by the objective, is transmitted by the short-pass filter in the direction of a spectrometer (Horiba, LabRam Evolution). A notch filter at 1064 nm (Thorlabs, NF1064-44) is set to suppress the remaining pump signal. The different anti-Stokes wavelengths are then diffracted by a grating (Horiba, 520 29, 600 gr.mm−1) and spanned on the CCD camera (Horiba, Synapse).
Fig. 1. Experimental setup of the epi-detected M-CARS and SHG imaging system (C: laser coupler; CCD: CCD camera; DL: delay line (delimited by the red dashed line); LP: long-pass filter; M: mirror; N1: notch dichroic mirror; N2: notch filter; Obj: objective; PCF: photonic crystal fiber; GTP: Glan-Taylor polarizer; PM: parabolic mirror; S: sample; SP: short-pass filter;λ/2: half-wave plate).
from the parietal region with a dental drill as illustrated in Fig. 2. One label-free fragment was counterstained with 50µM Rhodamine B (R6626, Sigma-Aldricht,λem 627 nm) for 10
min. For two-photon fluorescence measurements we used an upright multiphoton microscope (Olympus, BX61WI/FV1200MPE) coupled with a tunable femtosecond Ti:Sapphire laser (Coherent, Chameleon Ultra II) via 25x immersion objective (Olympus, XLPLN25XWMP, N.A. = 1.05).
Fig. 2. Schematic representation of the mouse parietal bone area studied in the experiment. The bregma and the lambda are both classical anatomical landmarks located on the midline of the outer surface of the skull, that are often used as reference points for stereotaxic surgery in this region. The bregma and the lambda are indeed the meeting point respectively between frontal and parietal bones, and between parietal and occipital bones. Here the cranium bone was extracted from the parietal region, down left from the lambda, as highlighted by the red circle.
3. Results and discussion
Using our CARS setup, we mapped an area of 260µm×260µm with a 1µm-step of the wild
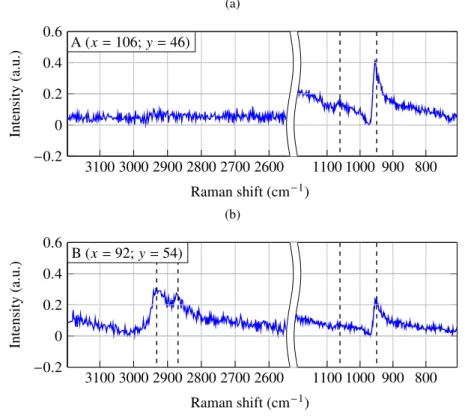
mouse parietal bone. The lateral resolution was 540 nm (FWHM). Because the grating and the CCD camera used could not collect the entire anti-Stokes spectrum and SHG response without loss of spectral resolution, we split the measurement into three sets of acquisitions: from 700 cm−1 to 1200 cm−1(5 ms per spectrum); from 2500 cm−1to 3200 cm−1(5 ms per spectrum); and from 510 nm to 555 nm (1 ms per spectrum). For each point of the mapping, two accumulations were made to avoid random spikes in spectra due to cosmic rays.
other vibrational modes. The frequency of all these maxima does not exactly match the frequency of the corresponding spontaneous Raman band. As a matter of fact, due to the dispersive aspect of the CARS spectra, the frequency of the peaks is shifted in the low-energy direction. In Table 1, we list the vibrational modes for the different CARS peaks of Fig. 3, including the corresponding Raman shifts and associated molecule types.
(a)
−0.2 0 0.2 0.4 0.6
Intensity
(a.u.)
800 900 1000 1100 2600
2700 2800 2900 3000 3100
A (x=106;y=46)
Raman shift (cm−1)
(b)
−0.2 0 0.2 0.4 0.6
Intensity
(a.u.)
800 900 1000 1100 2600
2700 2800 2900 3000 3100
B (x=92;y=54)
Raman shift (cm−1)
Fig. 3. Typical raw CARS spectra of mouse parietal bone for fingerprint and CH vibrational domains at two different points of acquisition ((a) and (b)). The spectra acquisition position inµm is given in the insets. The pump and Stokes average power at the sample is 66 mW and 4 mW, respectively.
It appears that PO3−4 symmetric stretching and CO in plane stretching of CO2−3 characterize the presence of apatite crystals with phosphate and carbonate content [5, 7, 19, 20]. CH2asymmetric
stretching indicates the presence of lipids [21]. CH3 symmetric stretching, which besides is
coupled to overtone of asymmetric deformation [22], points out proteins [23].
We used two types of post-treatment methods to suppress the non-resonant background (NRB) from the CARS spectra. We first used an algorithm based on the Maximum Entropy Method (MEM) [24] in order to retrieve the imaginary part of the third order nonlinear susceptibilityχ(3)
Table 1. Band assignment for CARS spectra of mouse cranial bone
CARS peak Raman shift
Assignment Comment Reference(s) maximum (cm−1) (cm−1)
950 961 PO
3−
4 symmetric Phosphate [5, 7, 19, 20]
stretching
1061 1070
CO2−3 symmetric
[5, 19, 20] stretching (enveloping Carbonate
PO3−4 asymmetric (primarily) stretching)
2869 2878
CH2asymmetric
Lipids [21] stretching
Overtone of asymmetric
Proteins [22] deformation in Fermi
resonance with CH3
symmetric stretching
2932 2950 CH3symmetric Proteins [23] stretching (primarily)
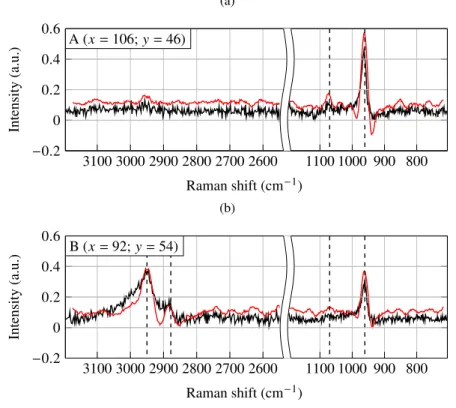
of the Raman peak and the derivative of the CARS peak (red curve). We can see that, compared to the position of a CARS peak, the position of its derivative is closer to the one of the Raman peak with a small increase of∆ωwithΓ. This indicates that we can use the derivative of a CARS peak to retrieve the position of the corresponding Raman line with good precision.
0 50 100 150 200
−10 −5 0 5
Γ(cm−1)
∆
ω
(cm
−
1 )
Fig. 4. Evolution of the difference∆ωbetween the positions of a Raman peak and a CARS peak maximum (blue curve) and between a Raman peak and the derivative of a CARS peak maximum (red curve) according toΓ, the spectral half-width of the Raman peak.
The measured CARS spectra presented before have been processed using the two methods. The resulting spectra are plotted in Fig. 5. We observe that in both cases the dispersive profile of the CARS peaks has disappeared but the spectral features carrying the vibrational information have remained. This correction of the dispersive aspect is highlighted by the shifting of each CARS peak towards the Raman shifts presented in the literature. The two methods provided almost the same maxima positions: 961 cm−1, 1070 cm−1, 2878 cm−1and 2950 cm−1for PO3−4 symmetric, CO in plane of CO2−3 stretching modes and the CH2asymmetric and CH3symmetric stretching
modes respectively. We also noted that the post-processing time of the derivative algorithm was shorter than that of the MEM algorithm: 25 ms per spectrum instead of 1 s per spectrum.
that the contrast was the same for the MEM and derivative algorithms. However a better signal to noise ratio of the maps was observed when using the derivative method. The intensity maps of PO3−4 , CO2−3 , CH2and CH3stretching modes obtained with the derivative method are displayed
in Fig. 6, as well as the SHG intensity map.
(a)
−0.2
0 0.2 0.4 0.6
Intensity
(a.u.)
800 900 1000 1100 2600
2700 2800 2900 3000 3100
A (x=106;y=46)
Raman shift (cm−1)
(b)
−0.2
0 0.2 0.4 0.6
Intensity
(a.u.)
800 900 1000 1100 2600
2700 2800 2900 3000 3100
B (x=92;y=54)
Raman shift (cm−1)
Fig. 5. Normalized and baseline corrected imaginary part of χ(3)extracted with MEM algorithm (black curve) and normalized derivative of the typical raw CARS spectra (red curve) for fingerprint and CH vibrational domains at two different points of acquisition ((a) and (b)).
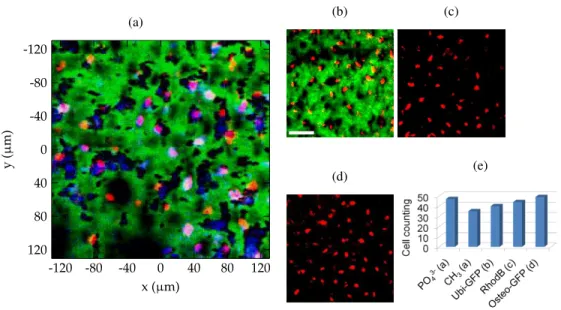
We merged three of those maps (PO3−4 at 961 cm−1in red, CH3at 2950 cm−1in blue, SHG in
green) into a single image, as depicted Fig. 7(a). In this image, the red and blue clusters represent hydroxyapatite and proteins signal respectively. Thus these clusters would indicate the presence of bone cells embedded in a fibrous collagen matrix, the latter coinciding with the SHG signal in green.
To confirm this hypothesis, two-photon fluorescence intensity mapping of the same type of sample with different labels was realized. Thanks to the resulting maps we can observe the characteristic features of indeterminate cells labelled with GFP and Rhodamine (Figs. 7(b) and 7(c)); and osteogenic cells labelled with GFP (Fig. 7(d)). In Fig. 7(b) the SHG signal originating from collagen is also plotted. This allows us to compare the previous M-CARS/SHG map with a reference measurement. The two images show a similarity between the size, shape and density of hydroxyapatite/proteins clusters on one hand (Fig. 7(a)), and of GFP labeled cells on the other hand (Fig. 7(b)). As well, the clusters and the cells both appear as embedded objects in the collagen matrix. We can thus affirm that the hydroxyapatite and proteins M-CARS signals originate from mouse bone cells. This highlights the relevance of epi-detected M-CARS for tracking biological cells in a complex environment.
(a) (b) (c) (d) (e)
Fig. 6. Intensity maps of a mouse parietal bone fragment obtained from CARS spectra derivatives for (a) PO3−4 , (b) CO2−3 , (c) CH2, (d) CH3stretching modes (integrated over a
bandwidth of 20 cm−1around 961 cm−1, 1070 cm−1, 2878 cm−1and 2950 cm−1respectively) and (e) corresponding SHG image. Scale bar: 50µm. The arrows in (a-b) and (c-d) indicate the acquisition position of the spectra displayed Figs. 3(a)-5(a) and 3(b)-5(b) respectively.
(a)
-120 -80 -40 0 40 80 120
-120
-80
-40
0
40
80
120
x (µm)
y
(
µ
m)
(b) (c)
(d) (e)
Fig. 7. Intensity maps of a mouse parietal bone fragment obtained from (a) CARS spectra derivatives of PO3−
4 symmetric stretching (red) and CH3stretching (blue) modes, two-photon
fluorescence of (b) GFP labeled cells (red), (c) counterstained cells with Rhodamine B (red) and (d) GFP labeled osteogenic cells (red). In (a) and (b) the SHG signal is shown in green. Scale bar: 50µm. (e) Population density of the cells in the different maps.
CH3vibrational intensity maps and from the three fluorescence intensity maps. The resulting
cell counting is plotted in the histogram of Fig. 7(e). At this stage, the variability in population density between the different modalities cannot be assigned to any specific chemico-biological assumption, because it would require a full biology protocol for making quantitative cell counting. However the difference of population density between PO3−4 and CH3modalities relates to the
4. Conclusion
We have demonstrated that the epi-detection of M-CARS and SHG signals coming from mouse bone cells was possible at low average power and short pixel dwell time (5 ms and 1 ms, respectively). The repartition maps of PO3−4 symmetric stretching and CH3stretching vibrational
modes could clearly reveal the presence of mineralized hydroxyapatite and proteins, respectively, and permitted the identification of bone cells. This study shows the potential of the multiplex configuration in the promising domain of CARS endoscopy [26]. Furthermore, we have proved that the use of the derivative of CARS spectra was as effective as the MEM for retrieving Raman lines, with high vibrational contrast. The derivative method also demonstrated shorter post-processing time. This represents an interesting track towards real-time post-processing of multiplex CARS data. Finally, we have illustrated that, because the width of the CARS spectrum is crucial for calculating the derivative, broadband M-CARS measurements are highly compatible with this post-processing method.
Funding
Direction Générale de l’Armement; Agence Nationale de la Recherche (ANR-14-ASTR-0014); Région du Limousin.
Acknowledgments
We wish to acknowledge the support of French defense agency (Direction Générale de l’Armement) and of French research agency (Agence Nationale de la Recherche) through the NEOSPRAM project.
This research was partly conducted in the scope of LEA-EBAM, a European Associated Laboratory titled “Pulsed Electric Fields Applications in Biology and Medicine”.
Disclosures