TROPICS Vol. 26 (1) 27-36 Issued June 1, 2017 ISSN : 0917-415X DOI:10.3759/tropics.MS16-04
FIELD NOTE
Conditions of marine protected areas (MPAs) in the Philippines observed
through the MEAT database and a reality of evaluation system and the
community based management in two MPA cases
Yuta Ito1*, Miki Toda1* and Misa Masuda2
1
Graduate School of Life and Environmental Sciences, University of Tsukuba, Ibaraki 305‒8572, Japan
2
Faculty of Life and Environmental Sciences, University of Tsukuba, Ibaraki 305‒8572, Japan * Corresponding authors: yuty.ito@gmail.com (Ito), s1230289@u.tsukuba.ac.jp (Toda) Received: May 30, 2016 Accepted: March 6, 2017
ABSTRACT It is well recognized that the marine resources of the Philippines are increasingly and severely damaged by climate change and human interventions, including overfishing and destructive fishing. To manage its marine resources, the government has implemented marine protected area (MPA) systems, expecting the involvement of local communities in its management. Although over 1,600 MPAs had been established by 2014, it is reported that they are not effectively managed. The purpose of the study is to determine the current conditions of MPAs in the Philippines using the MPA Management Effectiveness Assessment Tool (MEAT) developed in 2010, and to identify how MEAT reflects reality through interviews at two MPAs. The MEAT data analysis shows that MEAT has not yet been fully utilized and its information is not representative of all the MPAs in the country. So far, as based on the information provided by MEAT, less than half of the MPAs are effectively managed and management effectiveness is not related to the age of the MPA or evenly distributed across regions. The field study, although limited by the fact that it is based on only two MPAs, raises the question as to whether or not local evaluation has been conducted as intended. Unlike the high expectations of communities as effective MPA management entities, local people in the two cases rely more on local government. The results suggest the necessity of further studies on monitoring the MEAT evaluation process and the importance of field studies regarding the effectiveness of community-based MPA management.
Key words: marine protected area, community-based management, MPA evaluation, management evaluation tool, Philippines
INTRODUCTION
The marine protected area (MPA) has been posited as
an effective management instrument for protecting marine resources and ecosystems. In 2014, 3.4 % of the world s ocean and 8.4 % of all marine areas within national jurisdictions were covered by MPAs (Juffe-Bignoli et al. 2014). Although MPAs have increased in recent decades, worldwide coverage is significantly below the Aichi Target, which calls for 10 % coverage by 2020 (CBD 2013). Furthermore, it has been pointed out that most MPAs are not necessarily managed effectively (Pomeroy et al. 2005, Edgar et al. 2014).
The Philippines is comprised of over 7,100 islands
with over 36,289 km coastline. It supports highly diverse aquatic ecosystems and a variety of marine resources (Roberts et al. 2002, Mora et al. 2003, Carpenter and Springer 2005). Its coasts provide important marine habitats, includ-ing mangrove forests, seagrass beds, coral reefs and deep seas, hosting rich biodiversity including 2,818 fish species, 488 stony coral species and over 10,000 marine invertebrates
(World Bank 2005). However, the Philippines originally abundant marine resources have been increasingly and severely damaged by negative impacts of climate change and human activities (Roberts et al. 2002) including over-fishing and destructive over-fishing (World Bank 2005, Sanders et al. 2013).
The Philippine government instituted several
legisla-tions to protect and manage marine resources; above all Act 7160, known as the Local Government Code of 1991, allows local communities to manage their local marine resources in collaboration with their local municipality; and the National Integrated Protected Area System (NIPAS) Act in 1992 creates MPAs through the National Department of the Environment and Natural Resources (DENR). The Republic Act (RA) 8550, also known as the Fisheries Code of 1998, requiring 15 % allocation of coastal waters to MPA, has resulted in accelerating MPA establishment. By 2011, a total of 1,653 MPAs had been established, most of which were locally managed (Asian Development Bank 2014).
a subject of a long debate. While some studies have reported the effectiveness of local community-based management of marine resources, including MPAs (Alcala 1998, Russ et al. 2004, Alcala and Russ 2006, Hind et al. 2010), others have indicated that many MPAs are not necessarily managed effectively (Christie et al. 2009, Maypa et al. 2012, Sanders et al. 2013). Crawford et al.
(2000) reported that only 20 %‒25 % of community-based
managed MPAs are considered to be successful. In terms of effective MPA management in general, previous studies (Caludet et al. 2008, Guidetti et al. 2008, Maliao et al. 2009, Vandeperre et al. 2010) found a number of successful factors to increase fish density or catch rate, such as a larger size of the buffer zone, a longer period since establishment and adequate enforcement. Other studies have suggested that budgetary constraints and institutional collaboration are the challenges to effective MPA management (Christie et al. 2009, Maypa et al. 2012).
In 2010, a national online database of MPAs was
developed to consolidate several existent MPA databases managed by various organizations, which provided limited access and hosted often inconsistent or poorly updated information (Cabral et al. 2014). This MPA Management Effectiveness Assessment Tool (MEAT) aims to improve MPA governance and management through a uniform evaluation system and disclosure of the results. In 2011, the US Coral Triangle Support Partnership and the Marine Protected Area Support Network analysed the MEAT evaluation results of 119 MPAs, which represent 7.2 % of the 1,653 MPAs, to provide baseline information (Miclat 2013). The results revealed that 38.7 % of the 119 MPAs were not effectively managed.
After five years of MEAT implementation in the
Philippines, it might be useful to outline the management level of MPAs through the information obtained from the MEAT database, and to elucidate how the evaluation is actually conducted and how it reflects the local reality. This study uses data compiled in the MEAT database as a population together with information obtained from field studies. It does not intend to infer the situations of all MPAs in the Philippines, yet rather is positioned as a preliminary study to determine a direction for further study.
MATERIALS, METHODS AND STUDY SITES
Marine Protected Area Management Effectiveness Assessment Tool
MEAT is a MPA management effectiveness evaluation
system and database, which evaluated data are input by local MPA management officials and evaluators through a web-based interface (Aliño 2011, Cabral et al. 2014, MPA Support Network 2016; hereafter MEAT information in this section is based on these sources). Both locally managed MPAs and NIPAS are its objects. Local or regional officials who manage MPAs enter the MEAT website with an authorized user login and submit their MPA s data, information and evaluation using the evaluation form.
Locally authorized evaluators assess the management
effectiveness based on three criteria: the duration since establishment (age), point scores and management action indicators. The indicators consist of 48 actions which are categorized into nine areas: (1) Management Plan, (2) Management Body, (3) Legal Instrument, (4) Community Participation, (5) Financing, (6) Information, Education, a n d C o m m u n i c a t i o n ( I E C ) , ( 7 ) E n f o r c e m e n t , ( 8 ) Monitoring and Evaluation, and (9) Site Development. The score is awarded based on the achievement of the management actions. An action can receive from one to three points depending on the given action. The maximum points possible is 84. MPAs must be evaluated in accordance with MEAT guidelines. Subsequently, MPA management effectiveness is ranked depending on the particular MPA s level among four levels based on scores and required age (Table 1).
Through the web interface, MEAT publicly provides
part of the data in its database including basic information, location on a map, evaluation results of MPAs with a polygon graph as well as summary graphs of MPAs, which can be filtered by area, evaluation level and year of establishment.
Methods
First, all the information of the 1,785 MPAs found in
MEAT as of November 2015 was entered into an MS Excel 2010 spreadsheet for intended analysis. It was then sorted by the year of establishment, the region and the level of evaluated management effectiveness to determine the
Table 1. Age requirement and minimum point given based on management actions for achieving each level of MEAT Level Stage Age Minimum point
1 Established 1 20
2 Strengthened 2 31
3 Sustained 5 47
MPA evaluation system and community based management in the Philippines 29
present conditions of the MPAs.
Second, based on the analysis, the Mimaropa Region
was selected because it hosts the third largest number of MPAs and the second largest number of evaluated MPAs. Within Mimaropa, Batangas Province was selected due to the presence of all levels of MPA and its accessibility. The province had 52 MPAs, 43 (82.7 %) of which had been evaluated through MEAT, and held the largest number of Level 4 MPAs among all provinces. Within the province, Municipality S was selected, as it had 10 MPAs ranked from Level 0 to Level 4.
Thirdly, the field interviews were conducted with the
central government agencies in September 2015 and regional agencies, local government units and local people in November 2015. Interviewees included officials of DENR, the Provincial Environment and Natural Resources Office (PENRO) in Batangas, and, in Municipality S, the Municipality Environment and Natural Resources Office (MENRO), the Community Environment and Natural Resources Office (CENRO) and the Municipal Agricultural Office (MAO). Among the 10 MPAs in Municipality S, MPA A and B were selected because they were both established in 2000 with the help of local government units, are located next to each other and were evaluated in 2014 and ranked differently in MEAT. Interviews were also
conducted with officials in Barangay A and B, each of
which manages MPA A and B respectively. Barangay is the
smallest administrative unit under cities and municipalities. Interviewees were those introduced by officers in another governmental agency, starting from DENR in Manila to
regional, provincial and barangay offices, local related
offices and local fisher folks.
Finally, a local MEAT evaluator and local fisher folks
from MPA A and B were interviewed to determine the local realities of the MPAs under community-based management.
Barangay captains introduced us to the residential areas of
the fisher folks. In Barangay A where we interviewed six
fisher folks, we missed only a few others due to their
absence during the interview period. In Barangay B, there
were only four fisher folks, all of whom we interviewed.
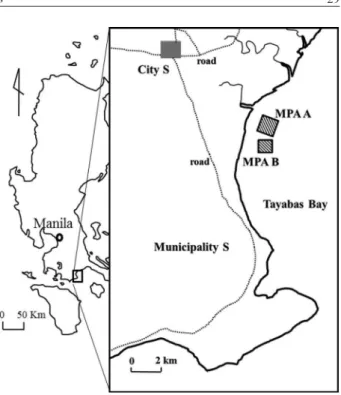
Study site
Municipality S, Batangas Province, is located
approx-imately 120 km south of Manila and at the southeastern corner of Batangas Province (Fig. 1). It covers a total land area of 27,340 ha and is made up of mountainous areas,
lowlands and the ocean. It includes 42 barangays and has a
total population of 94,291 (National Statistics Office 2010).
Its shoreline stretches along 33 km. Municipality S is part of the centre of the centre of the Verde Island Passage s marine shore fish diversity. Its coral reefs host numerous types of fish and other marine organisms, thick mangroves covering a total of over 496 ha and diverse seagrass beds (PG-ENRO 2009).
The municipality is home to a fishing industry; nearly
70 % of the population is employed in agriculture and 14 % in fishing according to the Provincial Government Environ-ment and Natural Resources Office (PG-ENRO, a different entity from PENRO which is under DENR), and it is also a tourist destination (PG-ENRO 2009). Collaborating with fisher folks and other local stakeholders, the local government units established MPAs in 2000.
For both MPA A and B, prior to their establishment,
numerous consultations were held with the barangays
fisher folks and residents, and they determined that they would protect the marine environment to increase the number of fish. The concept of the MPA gradually gained acceptance. The fisher folks themselves united to protect the sanctuary from illegal fishing and other activities taking place within the sanctuary. MPA A has a sanctuary of 73 ha. MPA B, which is adjacent to MPA A, has a sanctuary of
50 ha. Both are managed by barangay officials and sea
patrol staff have been hired by each barangay (PG-ENRO
2009).
RESULTS
Present Conditions of MPAs in the Philippines based on MEAT
Year of MPA Establishment and Evaluated Management Effectiveness
Of the 1,785 MPAs as of November 2015, 524 MPAs
did not display their year of establishment. The rest were established between 1940 and 2015. Two MPAs in MEAT, established in 1940 and 1971, are categorized as national parks , which are directly managed by DENR and have relatively large areas. The first community-based MPA was established in 1974 in Sumilon Island. Since 1991, when the Local Government Code was enacted, the number of MPAs gradually increased in 2002 and subsequently gradually decreased in 2015 (Fig. 2).
Among the 1,785 MPAs in the database, only 475
(26.6 %) were evaluated using MEAT as of November 2015. Their distribution among the five levels was: Level 0 (46.3 %), Level 1 (13.3 %), Level 2, (25.1 %), Level 3 (12.6 %) and Level 4 (2.7 %). If Level 2 and above are considered effectively managed (Miclat 2013), 40.4 % were considered effectively managed. MPAs established within less than two years could be only rated Level 0 or 1 as MEAT has an age requirement (Table 1) to advance the next
level. Even if 12 MPAs established in 2014 and 2015 are excluded, the MPAs evaluated as Level 0 and Level 1 represent 57.6 % of the total. Among the 12 MPAs, however, 7 obtained 31 points or more, which indicates high potential to advance the level as soon as the required age is fulfilled although the score is not the only threshold. Among MPAs that had been established by 2007 and were eligible for Level 4 in terms of their age, 41.7 % were Level 0 and 13.6 % were Level 1. Among 456 evaluated MPAs that displayed the year of establishment (Fig. 2), the age was not
significantly related to evaluation levels (rs (453) 0.04,
p 0.05).
Regional Distribution of MPAs and Evaluated Management Effectiveness
The Philippines is divided into 18 regions. The number
of MPAs in each region is shown in Fig. 3. The Cordillera Administrative Region was excluded because it does not face the ocean nor does it have an MPA. Central Visayas had the largest number of MPAs (415, 23.2 % of all MPAs), followed by Eastern Visayas (247, 13.8 %), Mimaropa (194, 10.9 %) and Calabarzon and Bicol (123, 6.9 %).
Fig. 3 also shows the number of MPAs evaluated using
MEAT and their evaluated rank (Levels 0‒4) in each region.
Again, Central Visayas had the largest number of evaluated MPAs (93, 19.6 % of all evaluated MPAs), followed by Mimaropa with 58 (12.2 %) and Calabarzon with 52
MPA evaluation system and community based management in the Philippines 31
(10.9 %). All of these top three regions had Level 0 MPAs representing less than 50 % of their total and had MPAs at all five levels. Evaluated rank ratio was found to be
significantly diverse across regions ( 2(79)=167.0,
p 0.05), indicating that the management effectiveness
based on MEAT was not evenly distributed.
Management of MPAs by Local Government Units
According to PENRO and CENRO officials from
Batangas Province, DENR and its related regional branches such as PENRO and CENRO plan the establishment, budget and laws and regulations of MPAs. These national agencies do not directly work with MEAT. Instead, local government units such as provincial governors, PG-ENRO and its subordinate bodies, the City Environment and Natural Resources Office (City ENRO) and MENRO are in charge of establishing and managing MPAs. PG-ENRO is also able to create laws and regulations related to MPAs and handles MEAT. City ENRO and MENRO are responsible for collecting information about MPAs managed by their
barangays, which can establish one MPA each and can
manage MPAs directly.
CENRO, MENRO and City ENRO were newly
created in 2015 pursuant to the Local Government Code of 1991, which directs the establishment of the local governments system and authorities. The code was instituted to reduce the burden of other offices, such as MAO, which has played an important role in MPA, agriculture and tourism. Although, at the point of the study, MAO still has power in respect of the MPA in the province, it is expected that the management role for MPA would be transferred from MAO to the newly established offices in the near future in Municipality S.
According to MENRO and MAO officers in
Munici-pality S, there are two sources of funds for MPAs. Funds from DENR through the provincial governor and from
PG-ENRO provided to each barangay, which are used for
technical support, including MPA management skill training and education for fisher folks about fishery activities permitted in MPAs. Another source of funds is from the municipality through the municipality council; these funds are used for MPA management itself. According to MENRO, 20 % of a municipality s total budget should be allocated to MPAs. According to the officers, however, such a budget was not allocated in 2008 and 2012 because in these election years, the MPA was considered a lower priority (Table 2).
M u n i c i p a l i t y S s e t s t w o t y p e s o f M PA s : ( 1 )
Fig. 3. Number of MPAs and MEAT evaluated levels by region (Evaluated MPAs 475, MPA 1,261)
Sanctuaries (No Take Zone) where fishing is strictly prohibited but touristic activities are allowed, and (2) Marine Reserves, where only sustenance fishing using hook and line is allowed. Pursuant to the Fisheries Code of 1998, municipal fisher folks, registered cooperatives and organizations utilize all fishery-related activities in munic-ipal waters. Municmunic-ipal or city governments provide permits to authorize small and medium commercial fishing vessels,
allowing them to operate within 10.1‒15 km from the
shoreline in municipal waters as defined by the code. In the event of any illegal fishing, Municipality S, in accordance with the code and the Municipal Ordinance No. 07-2006, imposes fines and confiscates the fish caught and after the second offence along with any equipment (Table 3).
MEAT Evaluation Process and Reality in MPA A and B
MEAT Evaluation Process
The MEAT evaluator who assessed MPA A and B in
2012 was interviewed to obtain details about the process and the situation in terms of MEAT evaluation. According to the MPA MEAT guidelines, evaluators should be designated by the local MAO associated with an MPA, should interview educated fisher folks who know the MPA
well, understand English and are chosen by barangay
officials in accordance with the defined questionnaire identifying the previously described management actions (Fig. 4). However, only a MAO staff member evaluated MPA A and B in 2012. In Municipality S, this evaluator alone evaluated all of the 10 MPAs. The evaluator con-ducted the interview and submitted the report to PG-ENRO without particular documentations.
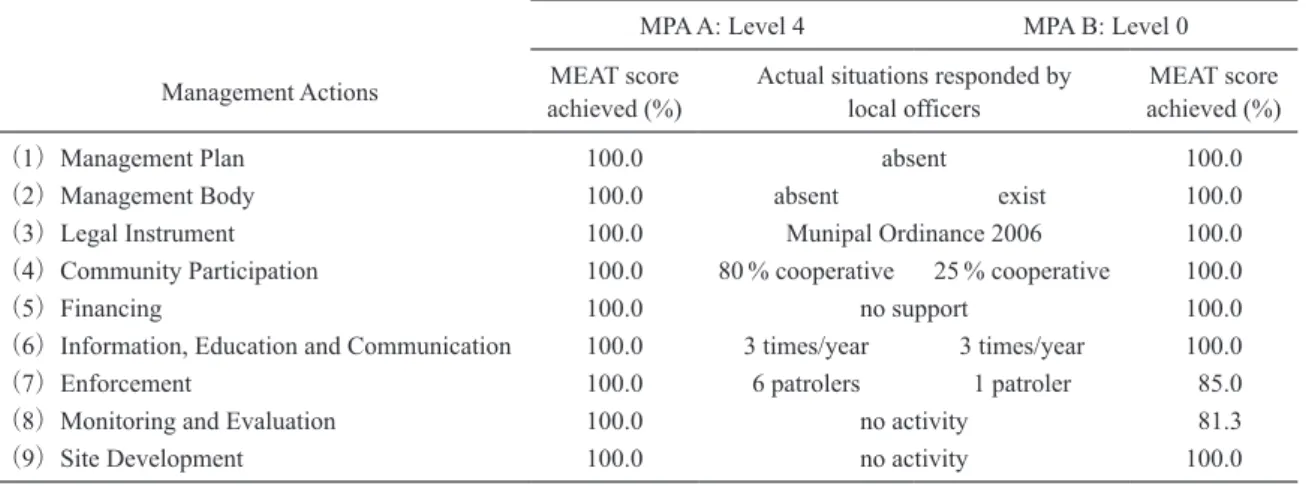
MEAT Report and Local Situation
MEAT evaluation results found in the MEAT database
for MPA A and B and the actual situations obtained from interviews are shown in Table 4. The management effec-tiveness of MPA A was rated as Level 4 and that of MPA B was Level 0. While MPA B had achieved most management actions in MEAT with 78 points, it was ranked as Level 0 because the management actions (8), Monitoring and Evaluation, had not yet met the requirements. In this case, as soon as these actions are in place, the MPA will be ranked as Level 4.
A Barangay A official responded that the MPA had no
Management Plan, which is management action indicator (1), Management Body (2), Financial Support (5) or Monitoring activity (8) by local government units or Site Development activity (9) among the aforementioned 9 categories of management actions. Only three management actions were conducted: Legal Instrument (3), IEC (6) and
Fig. 4. MEAT evaluation process (based on the interview with the MEAT evaluator in Municipality S, 2015)
Table 2. Year and Budget of MPAs in Municipality S (unpublished information provided by MENRO, Municipality S, 2015)
year 2008 2009 2010 2011 2012 2013 2014 2015 budget (peso) 0 200,000 300,000 300,000 0 245,588 31,941 75,671
Table 3. Punishments or fines in accordance with the Municipal Ordinance No. 07-2006 and the Republic Act 8550 in Municipality S (PG-ENRO2009)
Offences Fines (Peso/Person) Penalty
First offence 1,000 Confiscation of all fish caught
Second offence 1,500 Confiscation of all fish caught and equipment
MPA evaluation system and community based management in the Philippines 33
Enforcement (7). The legal instrument in question is the Municipal Ordinance in 2006, which determines coastal resource management. The IEC activity (6) comprises education meetings on MPA management provided to fisher folks three times a year. Regarding Enforcement (8), six
local people participate in sea patrol (Bantay dagat) around
the MPA with compensation.
The staff of Barangay B responded that the MPA had
no Management Plan (1), Financial Support (5), Monitoring activity (8) or Site Development activity (9). What had been conducted were only the Management Body (2) and Legal
Instrument (3), which is Municipal Ordinance No. 07‒2006,
IEC (6) and Enforcement (7), for which a sea patrol is conducted by one local person.
Fisher folks Perceptions of MPAs A and B
The average annual income for 2014‒2015 among 10
total fisher folks (6 in Barangay A and 4 in Barangay B)
interviewed was 56,400 pesos, 82.1 % of which was from fish-ing. All the respondents knew what is permitted within the MPAs. They had been taught how to fish, what is allowed in the MPA and the MPA s effectiveness from the meetings held by MAO and non-governmental organizations three times per year.
The interviews asked about their perceptions of the
number of fish, illegal fishing and how they changed before and after the establishment of the MPA and willingness to
support the MPA. Four respondents in Barangay A and one
in Barangay B perceived that fish had increased since the
MPA was established, two each of respondents in both
Barangays answered that fish had decreased and one in
Barangay B reported no change. All respondents perceived
that illegal fishing had decreased (Table 5). Also, six
respondents in Barangay A responded enforcement as an
important factor for successful MPA management, because they saw how sea patrolling reduced illegal fishing. The fisher folks revealed that they were scared of illegal fishers
who carry armour. Three respondents in Barangay B
answered that leadership by the barangay captain and
mayor is important because their cooperation highly influences management actions. One interviewee in
Barangay B did not answer this question. Even though
respondents knew that the sea patrol reduced illegal fishing and that sea patrollers monthly compensation was 5,000 pesos, they were not willing to fill this dangerous role. This is a partial reason why some respondents were not willing to participate in MPA management. Five of the six people mentioned that they were going to support the MPA
in Barangay A and only one of four in Barangay B.
Table 4. Evaluation results shown in MEAT and responses by local officers managing MPA A and B MPA A: Level 4 MPA B: Level 0 Management Actions MEAT score
achieved (%)
Actual situations responded by local officers
MEAT score achieved (%)
1 Management Plan 100.0 absent 100.0
2 Management Body 100.0 absent exist 100.0
3 Legal Instrument 100.0 Munipal Ordinance 2006 100.0
4 Community Participation 100.0 80 % cooperative 25 % cooperative 100.0
5 Financing 100.0 no support 100.0
6 Information, Education and Communication 100.0 3 times/year 3 times/year 100.0
7 Enforcement 100.0 6 patrolers 1 patroler 85.0
8 Monitoring and Evaluation 100.0 no activity 81.3
9 Site Development 100.0 no activity 100.0
Table 5. Fisher folks responses to the change in the number of fish and illegal fishing after the MPAs were established (A: n 4, B: n 6)
Question Barangay Increased Decreased No change Change in the number
of fish
A 4 2 0
B 1 2 1
Change in the number of illegal fishing
A 0 6 0
DISCUSSION
Present conditions of MPAs: evaluated MPAs through MEAT
First of all, MEAT information may not represent all
of the MPAs in the Philippines because the utilization rate of MEAT remained at only 26.6 % and any biases which occur are unknown due to the voluntary nature of sub-mission to MEAT by each MPA. Hereafter, the scope of the discussion only relates to the evaluated MPAs based on MEAT.
MEAT showed that more than half of the MPAs had
low evaluation levels. Unlike previous studies, it also showed that higher levels in MEAT were not associated with the age of the MPAs. Since MEAT implementation in 2010, utilization of the tool increased from 7.2 % in 2011 when baseline information was gathered (Miclat 2013), to 26.6 % in 2015. However, this increased utilization rate did not necessarily increase the rate of effectively managed MPAs. Level 0 and Level 1 MPAs, which represented 38.7 % of the total evaluated ones in 2011, increased to 59.6 % in this study. It should be pointed out that seven of the 12 newly established MPAs in 2014 and 2015 have high scores, which would allow them to be Level 2 or higher as soon as the age requirement and required management actions are fulfilled.
The percentage of effectively managed MPAs was
slightly higher than what Crawford et al. (2000) reported as
20 %‒25 %. However, our results, which showed that the
age of MPAs did not appear to affect the evaluated management effectiveness, did not accord with the previous studies (Caludet et al. 2008, Maliao et al. 2009, Vandeperre et al. 2010), which report that the ages of reserves or MPAs are a factor for effective management in terms of fish density or catch rate. This difference leads to questions regarding whether the MEAT management action indicators are appropriate; management actions are properly conducted; or data in MEAT are reliable. A guidebook developed by the MPA Management Effectiveness Initiative, for example, suggests that indicators are to be selected from biophysical, socioeconomic and governance areas (Pomeroy et al. 2005). The aforementioned MEAT management action indicators include those three areas. The question, then, might be related to management action procedure or data reliability. The following section provides support for a partial answer of this.
Reflection of reality in MEAT: MEAT evaluation process
While the findings indicate the usefulness of a uniform
assessment tool for grasping the state of MPA management, the field study shows discrepancies between MEAT data and reality. We found a possibility that the process of evaluation, including evaluator and interviewee selection, did not always follow the MEAT evaluation guidelines. Over the past decade, researchers have made efforts to develop a methodology for evaluating MPA management effectiveness (Staub and Hatziolos 2004, Pomeroy et al. 2005). Methodology and tools are important, yet our study suggests that a method for monitoring how and with whom to conduct evaluations may be required.
Local government management
Enforcement of regulatory mechanisms is a factor to
sustain a marine reserves (Guidetti et al. 2008). The Municipality S government has developed the infrastructure to manage MPAs such as the establishment of City ENRO and MENRO following the Local Government Code of 1991, as well as fines for illegal fishing. Although the municipality allocates funds to MPA management, it was not constantly disbursed and was suspended in election years. Considering the fact that the MPA budget of Municipality S was 300,000 pesos at the highest in the past 5 years, the budget is obviously insufficient because there are 10 MPAs in Municipality S and the monthly compensation of the sea patrol is 5,000 pesos per person. The results accord with previous studies suggesting that budgetary constraints (Maypa et al. 2012) and collaboration of local institutions (Christie et al. 2009) are challenges to MPA management effectiveness. Local government s interest in MPAs would be another key to effective MPA management.
Community-based management
Pollnac et al. (2001) found the six success factors of
community-based MPAs: (1) relatively small population size, (2) a perceived crisis of reduced fish population before MPA establishment, (3) successful alternative income projects, (4) a relatively high level of community participation, (5) continuing advice from the implementing organization and (6) inputs from the municipal government. Though how large the population should be depends on
each local context, the number of fisher folks in Barangay
MPA evaluation system and community based management in the Philippines 35
the community members in non-fishery sectors is expected, strong local government initiatives to manage MPAs are needed. Unlike some previous studies, which had high regard for community-based management (Alcala 1998, Russ et al. 2004, Alcala and Russ 2006, Hind et al. 2010),
interviews with local fisher folks of Barangay A and B
demonstrated that several respondents were not willing to support the MPA, and that most expect local government initiatives to maintain MPAs. This also implies that local government s initiatives might be weighted higher in effective MPA management.
The fisher folks expectations and dependence on
governmental actions are not identified through MEAT because management action indicators regarding com-munity participation does not include such questions, but only asks whether the MPA concept has been explained to stakeholders, and if the MPA has been accepted and approved by the community (Aliño 2011). Among the six aforementioned success factors, perceived crisis of reduced fish population and alternative income projects are also areas that MEAT cannot capture. Whether inclusion of these factors in management action indicators would improve MEAT is left to future studies.
While MEAT is a useful and ambitious initiative to
monitor and improve MPA management effectiveness, this study suggests a direction for further investigation through field studies in the following areas: MEAT evaluation process and management action indicators, realities of community-based MPA management and the impact of local government initiatives on the effectiveness of community-based MPA management.
ACKNOWLEDGEMENTS We express our profound gratitude to the MPA Support Network for allowing us to use the Philippine MPA database. We are sincerely grateful to officials in DENR; Batangas PENRO; CENRO, MENRO and MAO in Municipality S; Barangay A and B Offices; the MEAT evaluator; and fisher folks in Barangays A and B for their generous cooperation with the study. Thanks to Dr. Seiji Iwanaga for his valuable advice and Ms. Hoang Phan Bich Ngoc for her field assistance.
REFERENCE
Alcala AC. 1998. Community-based coastal resource management in the Philippines: a case study. Ocean & Coastal Management, 38(2): 179‒186.
Alcala AC, Russ GR. 2006. No-take marine reserves and reef fisheries management in the Philippines: a new people power
revolution. Ambio, 35(5): 245‒254.
Aliño PM. 2011. MPA MEAT: Marine Protected Area Management Evaluation Assessment Tool. National CTI Coordinating Committee. Quezon city, Manila.
Asian Development Bank. 2014. State of the coral triangle: Philippines. Asian Development Bank, Manila, Philippines. Cabral RB, Aliño PM, Balingit ACM, Alis CM, Arceo HO, Nañola
CL Jr., Geronimo RC, MSN Partners. 2014. The Philippine Marine Protected Area (MPA) Database. Philippines Science Letter. 7(2): 300‒308.
Carpenter KE, Springer VG. 2005. The center of the center of marine shore fish biodiversity: the Philippine Islands.
Environmental Biology of Fishes, 72: 467‒480.
[CBD] Convention on Biological Diversity. 2013. Quick guides to the Aichi biodiversity targets. Convention on Biological Diversity. Montreal.
Christie P, Pollnac RB, Oracion EG, Sabonsolin A, Diaz R, Pietri D. 2009. Back to basics: An Empirical study demonstrating the importance of local-level dynamics for the success of tropical marine ecosystem-based management. Coastal Management, 37: 349‒373.
Claudet J, Osenberg CW, Benedetti-Cecchi L, Domenici P, García-Charton JA, Pérez-Ruzafa Á, Badalamenti F, Bayle-Sempere J, Brito A, Bulleri F, Culioli JM, Dimech M, Falcón JM, Guala I, Milazzo M, Sanchez-Meca J, Somerfield PJ, Stobart B, Vandeperre F, Valle C, Planes, S. 2008. Marine reserves: size and age do matter. Ecology Letters, 11: 481‒489.
Crawford B, Balgos M, Pagdilao CR. 2000. Community-based marine sanctuaries in the Philippines: a report on focus group discussions. Coastal Management report #2224, PCAMRD Book Series No. 30, Coastal Resources Center and Philippine Council for Aquatic and Marine Research and Development, Narragansett RI, USA, Los Banos, Laguna, Philippines. Edgar GJ, Stuart-Smith RD, Willis TJ, Kininmonth S, Baker SC,
Banks S, Barrett NS, Becerro MA, Bernard ATF, Berkhout J, Buxton CD, Campbell SJ, Cooper AT, Davey M, Edgar SC, Försterra G, Galván DE, Irigoyen AJ, Kushner DJ, Moura R, Parnell PE, Shears NT, Soler G, Strain EMA, Thomson RJ. 2014. Global conservation outcomes depend on marine protected areas with five key features. Nature, 506, Feburuary 13: 216‒220.
Guidetti P, Milazzo M, Bussotti S, Molinari A, Murenu M, Pais A, Spanò N, Balzano R, Agardy T, Boero F, Carrada G, Cattaneo-Vietti R, Cau A, Chemello R, Greco S, Manganaro A, Notarbartolo di Sciarak G, Fulvio, Russo G, Tunesi L. 2008. Italian marine reserve effectiveness: Does enforcement matter? Biological Conservation, 141: 669‒709.
Hind EJ, Hiponia MC, Gray TS. 2010. From community-based to centralised national management A wrong turning for the governance of the marine protected area in Apo Island, Philippines? Marine Policy, 34(1), 54‒62.
2014. UNEP-WCMC: Cambridge, UK.
Miclat E. 2013. MPA Benchmarking: Promoting Improved Management and Performance Monitoring. Conservation International, Quezon City, Manila.
Maliao RJ, White AT, Maypa AP, Turingan RG. 2009. Trajectories and magnitude of change in coral reef fish populations in Philippine marine reserves: a meta-analysis. Coral Reefs, 28: 809‒822.
Maypa AP, Shite AT, Caňares E, Martinez R, Eisma-Osorio R, Aliňo P, Apistar D. 2012. Marin protected area management effectiveness: Progress and lessons in the Philippines. Coastal Management, 40: 510‒524.
MPA Support Network. 2016. Philippine MPA Database. Marine Science Institute.
http://www.mpa.msi.upd.edu.ph (cited August 8, 2016). Mora C, Chittaro PM, Sale PF, Kritzer SJ, Ludsin SA. 2003.
Patterns and processes in reef fish diversity. Nature, 42, 27 February 2003: 933‒936.
National Statistics Office. 2010. 2010 Census of Population and Housing. Philippine Statistic Authority. Quezon City, Philippiness.
[PG-ENRO] Provincial Government Environment and Natural Resources Office. 2009. Marine Protected Area Management Plan: San Juan Batangas 2009. Provincial Government Environment and Natural Resources Office. Batangas, Philipinnes. Unpublished document.
Pomeroy RS, Watson LM, Parks JE, Cid GA. 2005. How is your MPA doing? A methodology for evaluating the management effectiveness of marine protected areas. Ocean & Coastal Management, 48: 485‒502.
Pollnac RB, Crawford BR, Gorospe MLG. 2001. Discovering factors that influence the success of community-based marine protected areas in the Visayas, Philippines. Ocean & Coastal Management 44: 683‒710.
Roberts CM, McClean CJ, Veron JE, Hawkins JP, Allen GR, McAllister DE, Mittermeier CG, Wells F, Vynne C, Werner TB. 2002. Marine Biodiversity hotspots and conservation priorities for tropical reefs. Science 295 (5558): 1280‒1284. Russ GR, Alcala AC, Mayapa AP, Calumpong HP, White AT.
2004. Marine reserve benefits local fisheries. Ecological Applications 14(2): 597‒606.
Sanders JS, Greboval D, Hjort A. 2013. Marine protected areas: Country case studies on policy, governance and institutional issues (Japan- Mauritania-Philippines-Samoa). FAO Fisheris and Aquaculture Techinical Paper, 556/2. Food and Agriculture Organization. Rome.
Staub F, Hatziolos ME. 2004. Score card to assess progress in achieving management effectiveness goals for marine protected areas. The World Bank. Washington DC.
Vandeperre F, Higgins RM, Sánchez-Meca J, Maynou F, Goñi R, Martín-Sosa P, Pérez-Ruzafa A, Afonso P, Bertocci I, Crec hriou R, D Anna G, Dimech M, Dorta C, Esparza O, Falcón JM, Forcada A, Guala I, Le Direach L, Marcos C, Ojeda-Martínez C, Pipitone C, Schembri PJ, Stelzenmüller V, Stobart B, Santos RS. 2010. Effects of no-take area size and age of marine protected areas on fisheries yields: a meta-analytical approach. Fish and Fisheries, 12: 412‒426.