sustainability
ISSN 2071-1050www.mdpi.com/journal/sustainability Article
Crop Sequence Influences on Sustainable Spring Wheat
Production in the Northern Great Plains
Donald L. Tanaka *, Mark A. Liebig, Joseph M. Krupinsky and Stephen D. Merrill
Agricultural Research Service, United States Department of Agriculture (USDA-ARS), P.O. Box 459, Mandan, ND 58554, USA; E-Mails: [email protected] (M.A.L.); [email protected] (J.M.K.); [email protected] (S.D.M.)
* Author to whom correspondence should be addressed; E-Mail: [email protected]; Tel.: +1-701-667-3063; Fax: +1-701-667-3054.
Received: 11 October 2010; in revised form: 22 November 2010 / Accepted: 23 November 2010 / Published: 30 November 2010
Keywords: cropping systems; no-till; crop rotation; dryland agriculture
1. Introduction
American agriculture represents a highly productive enterprise, producing bountiful harvest for a growing population. However, closer inspection reveals U.S. agricultural production systems that are highly unstable, easily disrupted by weather, disease, and insects, and relies heavily on foreign trade. Cropping systems since World War II have become highly specialized, standardized, and simplified to meet increasing demands of the industrialized food system [1,2]. Many of these cropping systems are approaching monoculture systems that need to incorporate technological advances, high fossil fuel based inputs, and genetic engineering to remain sustainable. Nature’s plant and animal diversity is currently replaced with a small number of cultivated plants and domestic animals [3].
Sustainable agriculture is not a constant state but is in a state of flux at all times; production systems that were sustainable twenty to thirty years ago are not sustainable today [4]. The northern Great Plains is an example of constantly changing agriculture. Early settlers brought their tillage tools and annual cropping systems from the eastern U.S. to the northern Great Plains during the late 1890’s and early 1900’s. They soon learned that eastern U.S. cultural practices and cropping systems resulted in crop failure during dry periods and were not resilient, which led to the development of the wheat-fallow cropping systems to provide short-term production sustainability during dry years. We have since learned that fallow in cropping systems contributes to inefficient use of precipitation [5] and soil resource degradation [6]. Canadian scientists have shown that reducing the frequency of fallow and including legumes in the cropping system improved the overall sustainability of agricultural production in the semiarid northern Great Plains [7].
Cropping systems specializing in one or two crops with little attention to crop diversity could lead to biological and physical soil degradation and ultimately soil chemical degradation [2]. Annual cropping systems, which include diverse crops such as oilseeds, pulses, forbs, and forages, may be economically viable options for producers. Diversifying the plant community in cropping systems also influences the diversity of soil organisms and the soil environment. Enhancing biodiversity in agricultural systems can be a key ecological strategy to bring sustainability to cropping systems [3]. Soil organisms and soil environmental changes resulting from diverse plant communities in cropping systems perpetuate biological synergies and adaptive management techniques inherent to multispecies systems [8,9]. Minimal attention has been given to efficient exploitation of synergism and/or antagonism in cropping systems [10]. Attention to synergistic and/or antagonistic relationships of crops in cropping systems based on crop sequence or cropping patterns is crucial to bring sustainability and resilience to agricultural systems.
2. Materials and Methods
The research project was located at the Area IV Soil Conservation District/USDA-ARS Northern Great Plains Research Laboratory Research Farm about 6 km southwest of Mandan, ND (46° 46’ 22” N, 100° 57’ 09” W). Two sites (6.1 ha each) were chosen about 2 km apart on a Temvik-Wilton silt loam (fine-silty, mixed, superactive, frigid Typic and Pachic Haplustolls). Prior crops were a 3-year rotation of sunflower (Helianthus annus L.)—spring wheat—spring wheat. During the establishment phase, sunflower was seeded using minimum-till techniques and spring wheat was seeded using no-till techniques. Inoculants, fertilizer rates, and other specific details for crop production are described by Tanaka et al. [11].
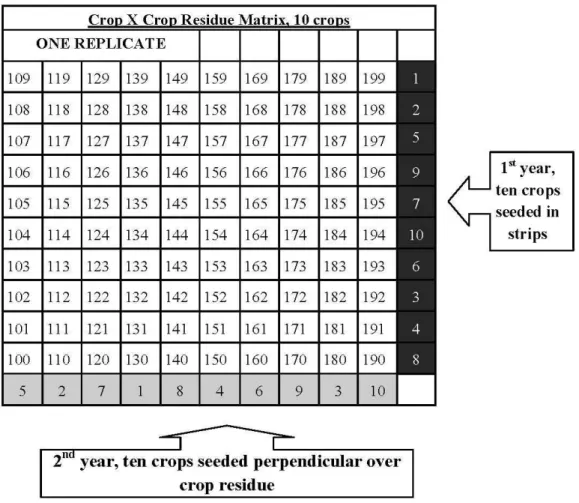
Research was initiated in 2002 by no-till seeding 10 crops (buckwheat [Fagopyrum esculentum Moench], canola [Brassica napus L.], chickpea [Cicer arietinum L.], corn [Zea mays L.], dry pea, grain sorghum [Sorghum bicolor L.], lentil [Lens culinaris Medik.], proso millet [Panicum miliaceum L.], sunflower, and spring wheat) in adjacent strips to produce their respective crop residues (first year crop residue). The following year, the same 10 crops were no-till seeded perpendicular to the previous year, creating a 10x10 crop x crop residue matrix with 100 different crop sequences (second year crop residue) [11]. In 2003, a second site of the three-year project was conducted using the same crop sequences as those used at the first site. The three-year crop sequences were run from 2002 to 2004 at site 1 and from 2003 to 2005 at site 2 (Table 1 and Figure 1). Spring wheat was uniformly no-till seeded at Site 1 in 2004 and Site 2 in 2005 after the 100 different crop sequence combinations. Using this crop matrix technique as a research tool allows for evaluation of multiple crop sequence effects in the same experiment under similar weather and soil conditions. Thus, spring wheat was no-till seeded over the crop residue of all crops included in the matrix. Crops were arranged each year using a randomized-complete block experimental design with a strip-block treatment arrangement and four replicates. The smallest experimental unit was 9 by 9 m. All crops, except corn and sunflower, were seeded using a no-till drill (model 750, John Deere, Moline, IL2) with a 19-cm row spacing. Corn and sunflower were planted with a no-till row-crop planter in 76 cm rows.
Table 1. Crops and sites used to evaluate influences of crop sequence on spring wheat production.
Year Crop Site 1a Site 2a
1 Ten Cropsb 2002 2003
2 Crop matrix, ten cropsc 2003 2004
3 Spring wheat seeded over crop matrixd 2004 2005
a In 2002, two 6.1 ha sites were chosen to provide two site years.
b Two years were required to establish a crop by crop residue matrix (crop matrix). The first year,
ten crops were seeded in strips to provide residue into which ten crops were seeded the second year.
c Two years were required to establish a crop matrix. The second year, ten crops were seeded
perpendicular over the crop residue of the first year to form a crop matrix.
Figure 1. A crop x crop residue matrix used to evaluate the influences of crop sequences on agronomic and environmental attributes [11] (From Agron. J. 99:904-911 (2007), with permission, copyright American Society of Agronomy). During the first year, 10 crops (numbered 1 through 10) were no-till seeded into a uniform crop residue. During the second year, the same 10 crops were no-till seeded perpendicular over the residue of the previous year’s crops. Individual plot numbers are assigned for each experimental unit in the replication.
crop to the harvest of spring wheat divided into the actual spring wheat seed yield of each experimental unit.
[PUE = spring wheat yield / precipitation (harvest to harvest)].
A particular crop sequence determined the precipitation received from the harvest of one crop to the harvest of the following spring wheat crop. Merrill et al. [14] determined crop soil water use and soil water content of second year crops at harvest. Soil water remaining after harvest of second year crops was not part of the PUE calculation and may have influenced this following spring wheat production.
Statistical analysis (F test) indicated a significant year (site) x treatment interaction; therefore, each year (site) was analyzed separately (not shown). Spring wheat seed yield and grain N concentration were analyzed using the GLM procedure [15]. Statistical comparisons within each evaluation were made with Least Significant Difference (LSD). Precipitation-use efficiency comparisons were made using Dunnett’s one-tailed test with continuous spring wheat (spring wheat—spring wheat sequence) as the control. Continuous spring wheat was considered to have the lowest yield potential. All statistical differences were evaluated at a probability level of ≤0.05.
3. Results and Discussion
3.1. Growing Season Weather
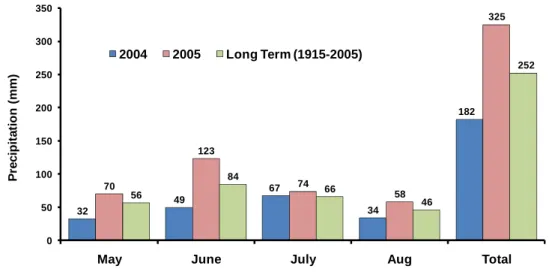
Growing season precipitation for 2004 and 2005 were vastly different (Figure 2). Precipitation during the 2004 growing season was 72% of the long-term average (252 mm). Only July was close to the average precipitation of 66 mm. In 2005, growing season precipitation was 129% of the long-term average. About 40% of the total growing season precipitation in 2005 was during the month of June.
Average monthly temperatures for 2004 were below average for all months with growing season mean temperature 2.4 °C below the long-term growing season average of 18.1 °C (Figure 3). The 2004 growing season was one of the five coolest growing seasons on record. For 2005, the average growing season temperature was 17.8 °C compared to the long-term average of 18.1 °C.
Figure 2. Monthly growing season precipitation in 2004, 2005, and long-term average (1915–2005) at Mandan, ND.
32 49 67 34 182 70 123 74 58 325 56 84 66 46 252 0 50 100 150 200 250 300 350
May June July Aug Total
P re c ip ita ti o n (m m )
Figure 3. Average monthly growing season temperatures in 2004, 2005, and long-term (1915–2005) at Mandan, ND.
10.7 15.3 20.0 16.9 15.7 11.5 18.7 21.5 19.5 17.8 12.7 17.9 21.5 20.4 18.1 0 5 10 15 20 25
May Jun Jul Aug Avg.
T e m p er at u re ( °C ) 2004 2005
Long Term (1915-2005)
3.2. Seed Yield
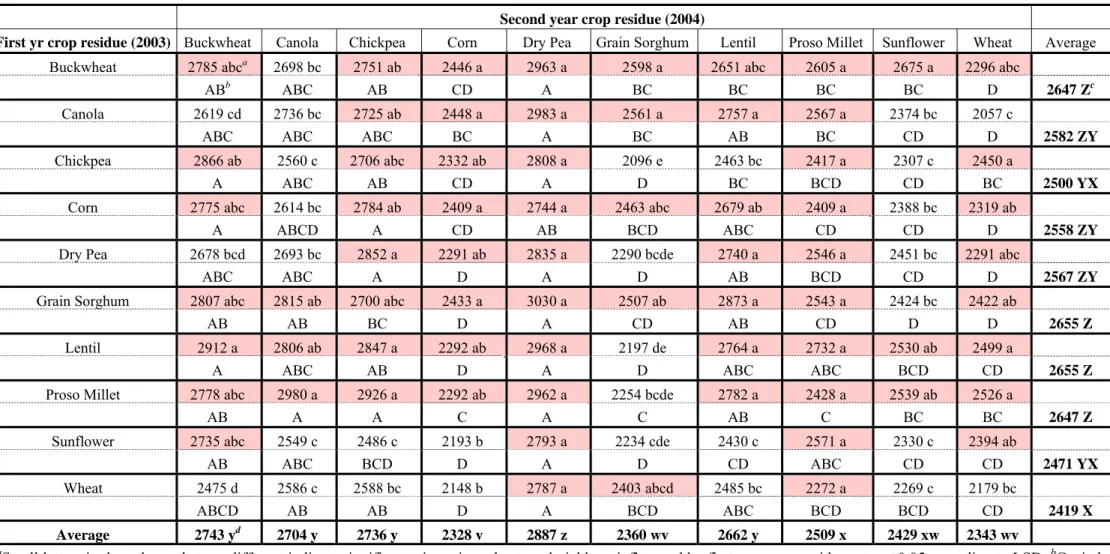
Spring wheat seed yield for 2004 and 2005 varied among crop sequences, affirming the importance of crop sequence and crop diversity in sustainable spring wheat production for the northern Great Plains (Tables 2 and 3). For both years, when the second year crop residue was dry pea, averaged over all first year crop residues, spring wheat seed yield was the greatest indicating spring wheat production risks can be mitigated by use of crop diversity [16]. In 2004, grain sorghum and sunflower second year crop residues resulted in significantly less spring wheat seed yield when averaged over all first year crop residues (Table 2). Grain sorghum the previous year (second year crop residue) produced significantly greater crop residue than the other ten crops [17] and along with the cooler than average growing season temperature (Figure 3) caused delayed seedling emergence and plant development. The delayed plant development increased plant stress in July when growing season temperatures were about average (Figure 3). When sunflower was grown the previous year (second year crop residue), spring wheat seed yields were 7% less than the average of spring wheat residue (second year crop residue), because sunflower grown in the northern Great Plains has greater soil water depletion, thus, spring wheat had increased plant stress in July during grain fill [14].
water during stress periods. Crops with long active growing seasons (second year crop residue), such as sunflower or grain sorghum, deplete more soil water causing spring wheat stress during the subsequent year. In a crop sequence, first year crops influenced spring wheat seed yield less than second year crops. Therefore, crop sequence and crop choice are critical factors in developing sustainable cropping systems and adaptive management techniques in water-limiting regions such as the northern Great Plains [9].
3.3. Seed N Concentration
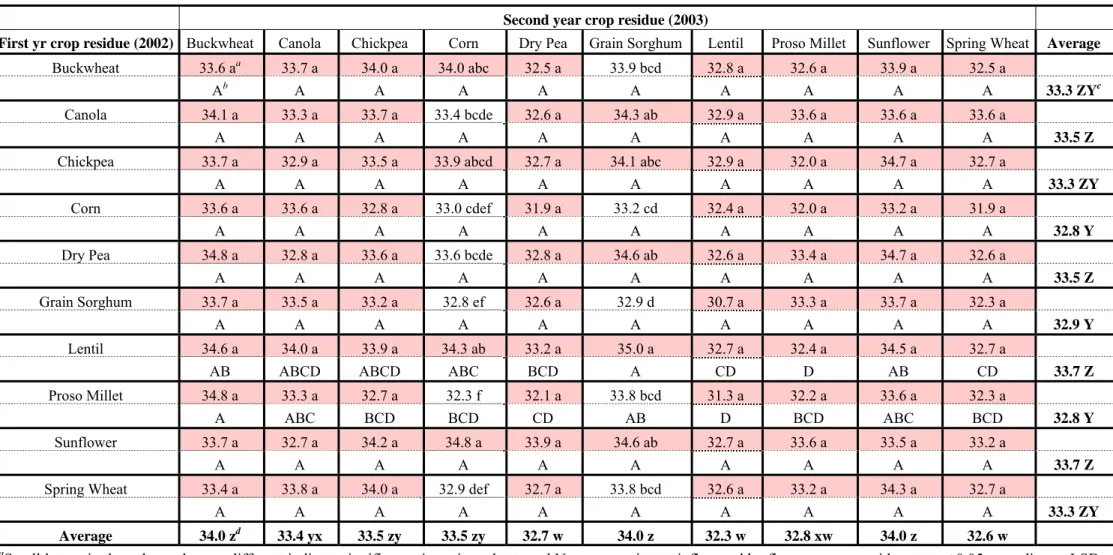
In 2004, cooler than average growing season temperatures (Figure 3) coupled with below-average precipitation (Figure 2) could have reduced soil and crop residue N mineralization and resulted in minimal significant differences in spring wheat seed N concentration among residue combinations (Table 4) [18]. Also, additions of nitrogen fertilizer (78 kg N ha–1) may have masked any crop sequence influences when N mineralization from soil and crop residues may have been limited during this below-average precipitation year [18]. Crop sequence combinations of lentil-proso millet and proso millet-lentil residues (first year and second year crop residues, respectively) tended to reduce seed N concentration. A plausible explanation may be the residue production of proso millet in the lentil-proso millet crop sequence immobilized N during residue decomposition of the large quantity of high carbon proso millet residue [17]. A similar situation might have occurred for the proso millet-lentil sequence where high carbon proso millet residue from two years prior immobilized N and resulted in reduced spring wheat seed N concentration of those no-till crop sequences. A second explanation may be the greater yield of spring wheat from the proso millet-lentil and lentil-proso millet crop sequences lowered N concentration in the grain through dilution.
Table 2. Spring wheat seed yield (kg ha–1) as influenced by first year crop residue and second year crop residue at Mandan, ND in 2004 (Site 1).
Second year crop residue (2003)
First year crop residue (2002) Buckwheat Canola Chickpea Corn Dry Pea Grain Sorghum Lentil Proso Millet Sunflower Spring Wheat Average
Buckwheat 2635 aa 2107 a 2314 a 2391 abc 2704 bcd 2218 a 2660 abcd 2401 a 2078 a 2603 a
Ab A A A A A A A A A 2411 ZYc
Canola 2163 a 2488 a 2463 a 1966 cd 2825 abc 1809 a 2692 abc 2427 a 2413 a 2020 a
A A A A A A A A A A 2326 ZY
Chickpea 2362 a 2479 a 2300 a 2138 bcd 2838 abc 1991 a 1990 e 2301 a 1691 a 2252 a
A A A A A A A A A A 2234 ZYX
Corn 2061 a 2309 a 2423 a 2669 a 2931 abc 1888 a 2527 bcde 2428 a 2202 a 2167 a
A A A A A A A A A A 2360 ZY
Dry Pea 2172 a 2808 a 2441 a 2418 ab 3036 ab 1859 a 2481 bcde 2429 a 1923 a 1972 a
CD AB ABCD BCD A D ABC BCD CD CD 2354 ZY
Grain Sorghum 2088 a 2108 a 2568 a 2361 abc 2898 abc 1980 a 3214 a 2131 a 2176 a 2218 a
CD CD BC BCD AB D A CD CD CD 2374 ZY
Lentil 2416 a 2150 a 2205 a 2141 bcd 2402 cd 1918 a 2031 de 2680 a 1736 a 2225 a
A A A A A A A A A A 2190 YX
Proso Millet 1917 a 2456 a 2520 a 2723 a 3305 a 1961 a 3056 ab 2679 a 1885 a 1974 a
D C C BC A D AB BC D D 2447 Z
Sunflower 2377 a 2071 a 2021 a 1873 d 2121 d 1763 a 2231 cde 2222 a 2134 a 2117 a
A A A A A A A A A A 2093 X
Spring Wheat 2229 a 2009 a 2544 a 2544 ab 3342 a 2013 a 2913 ab 2308 a 2014 a 2245 a
C C BC BC A C AB C C C 2416 ZY
Average 2242 xwd 2298 xw 2380 yxw 2322 xw 2840 z 1940 u 2579 y 2400 yx 2025 vu 2179 wv
a
Table 3. Spring wheat seed yield (kg ha−1) as influenced by first year crop residue and second year crop residue at Mandan, ND in 2005 (Site 2).
Second year crop residue (2004)
First yr crop residue (2003) Buckwheat Canola Chickpea Corn Dry Pea Grain Sorghum Lentil Proso Millet Sunflower Wheat Average
Buckwheat 2785 abca 2698 bc 2751 ab 2446 a 2963 a 2598 a 2651 abc 2605 a 2675 a 2296 abc
ABb ABC AB CD A BC BC BC BC D 2647 Zc
Canola 2619 cd 2736 bc 2725 ab 2448 a 2983 a 2561 a 2757 a 2567 a 2374 bc 2057 c
ABC ABC ABC BC A BC AB BC CD D 2582 ZY
Chickpea 2866 ab 2560 c 2706 abc 2332 ab 2808 a 2096 e 2463 bc 2417 a 2307 c 2450 a
A ABC AB CD A D BC BCD CD BC 2500 YX
Corn 2775 abc 2614 bc 2784 ab 2409 a 2744 a 2463 abc 2679 ab 2409 a 2388 bc 2319 ab
A ABCD A CD AB BCD ABC CD CD D 2558 ZY
Dry Pea 2678 bcd 2693 bc 2852 a 2291 ab 2835 a 2290 bcde 2740 a 2546 a 2451 bc 2291 abc
ABC ABC A D A D AB BCD CD D 2567 ZY
Grain Sorghum 2807 abc 2815 ab 2700 abc 2433 a 3030 a 2507 ab 2873 a 2543 a 2424 bc 2422 ab
AB AB BC D A CD AB CD D D 2655 Z
Lentil 2912 a 2806 ab 2847 a 2292 ab 2968 a 2197 de 2764 a 2732 a 2530 ab 2499 a
A ABC AB D A D ABC ABC BCD CD 2655 Z
Proso Millet 2778 abc 2980 a 2926 a 2292 ab 2962 a 2254 bcde 2782 a 2428 a 2539 ab 2526 a
AB A A C A C AB C BC BC 2647 Z
Sunflower 2735 abc 2549 c 2486 c 2193 b 2793 a 2234 cde 2430 c 2571 a 2330 c 2394 ab
AB ABC BCD D A D CD ABC CD CD 2471 YX
Wheat 2475 d 2586 c 2588 bc 2148 b 2787 a 2403 abcd 2485 bc 2272 a 2269 c 2179 bc
ABCD AB AB D A BCD ABC BCD BCD CD 2419 X
Average 2743 yd 2704 y 2736 y 2328 v 2887 z 2360 wv 2662 y 2509 x 2429 xw 2343 wv
a
Table 4. Spring wheat seed N concentration (g kg−1) as influenced by first year crop residue and second year crop residue at Mandan, ND in 2004 (Site 1).
Second year crop residue (2003)
First yr crop residue (2002) Buckwheat Canola Chickpea Corn Dry Pea Grain Sorghum Lentil Proso Millet Sunflower Spring Wheat Average
Buckwheat 33.6 aa 33.7 a 34.0 a 34.0 abc 32.5 a 33.9 bcd 32.8 a 32.6 a 33.9 a 32.5 a
Ab A A A A A A A A A 33.3 ZYc
Canola 34.1 a 33.3 a 33.7 a 33.4 bcde 32.6 a 34.3 ab 32.9 a 33.6 a 33.6 a 33.6 a
A A A A A A A A A A 33.5 Z
Chickpea 33.7 a 32.9 a 33.5 a 33.9 abcd 32.7 a 34.1 abc 32.9 a 32.0 a 34.7 a 32.7 a
A A A A A A A A A A 33.3 ZY
Corn 33.6 a 33.6 a 32.8 a 33.0 cdef 31.9 a 33.2 cd 32.4 a 32.0 a 33.2 a 31.9 a
A A A A A A A A A A 32.8 Y
Dry Pea 34.8 a 32.8 a 33.6 a 33.6 bcde 32.8 a 34.6 ab 32.6 a 33.4 a 34.7 a 32.6 a
A A A A A A A A A A 33.5 Z
Grain Sorghum 33.7 a 33.5 a 33.2 a 32.8 ef 32.6 a 32.9 d 30.7 a 33.3 a 33.7 a 32.3 a
A A A A A A A A A A 32.9 Y
Lentil 34.6 a 34.0 a 33.9 a 34.3 ab 33.2 a 35.0 a 32.7 a 32.4 a 34.5 a 32.7 a
AB ABCD ABCD ABC BCD A CD D AB CD 33.7 Z
Proso Millet 34.8 a 33.3 a 32.7 a 32.3 f 32.1 a 33.8 bcd 31.3 a 32.2 a 33.6 a 32.3 a
A ABC BCD BCD CD AB D BCD ABC BCD 32.8 Y
Sunflower 33.7 a 32.7 a 34.2 a 34.8 a 33.9 a 34.6 ab 32.7 a 33.6 a 33.5 a 33.2 a
A A A A A A A A A A 33.7 Z
Spring Wheat 33.4 a 33.8 a 34.0 a 32.9 def 32.7 a 33.8 bcd 32.6 a 33.2 a 34.3 a 32.7 a
A A A A A A A A A A 33.3 ZY
Average 34.0 zd 33.4 yx 33.5 zy 33.5 zy 32.7 w 34.0 z 32.3 w 32.8 xw 34.0 z 32.6 w
a
Small letters in the column that are different indicate significance in spring wheat seed N concentration as influenced by first year crop residues at p ≤ 0.05 according to LSD. b
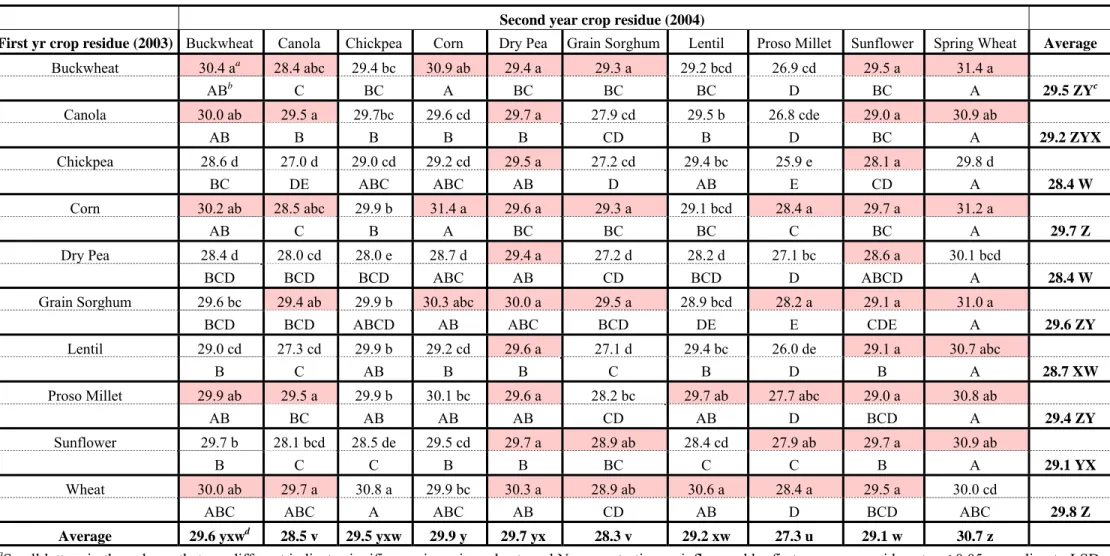
Table 5. Spring wheat seed N concentration (g kg–1) as influenced by first year crop residue and second year crop residue at Mandan, ND in 2005 (Site 2).
Second year crop residue (2004)
First yr crop residue (2003) Buckwheat Canola Chickpea Corn Dry Pea Grain Sorghum Lentil Proso Millet Sunflower Spring Wheat Average
Buckwheat 30.4 aa 28.4 abc 29.4 bc 30.9 ab 29.4 a 29.3 a 29.2 bcd 26.9 cd 29.5 a 31.4 a
ABb C BC A BC BC BC D BC A 29.5 ZYc
Canola 30.0 ab 29.5 a 29.7bc 29.6 cd 29.7 a 27.9 cd 29.5 b 26.8 cde 29.0 a 30.9 ab
AB B B B B CD B D BC A 29.2 ZYX
Chickpea 28.6 d 27.0 d 29.0 cd 29.2 cd 29.5 a 27.2 cd 29.4 bc 25.9 e 28.1 a 29.8 d
BC DE ABC ABC AB D AB E CD A 28.4 W
Corn 30.2 ab 28.5 abc 29.9 b 31.4 a 29.6 a 29.3 a 29.1 bcd 28.4 a 29.7 a 31.2 a
AB C B A BC BC BC C BC A 29.7 Z
Dry Pea 28.4 d 28.0 cd 28.0 e 28.7 d 29.4 a 27.2 d 28.2 d 27.1 bc 28.6 a 30.1 bcd
BCD BCD BCD ABC AB CD BCD D ABCD A 28.4 W
Grain Sorghum 29.6 bc 29.4 ab 29.9 b 30.3 abc 30.0 a 29.5 a 28.9 bcd 28.2 a 29.1 a 31.0 a
BCD BCD ABCD AB ABC BCD DE E CDE A 29.6 ZY
Lentil 29.0 cd 27.3 cd 29.9 b 29.2 cd 29.6 a 27.1 d 29.4 bc 26.0 de 29.1 a 30.7 abc
B C AB B B C B D B A 28.7 XW
Proso Millet 29.9 ab 29.5 a 29.9 b 30.1 bc 29.6 a 28.2 bc 29.7 ab 27.7 abc 29.0 a 30.8 ab
AB BC AB AB AB CD AB D BCD A 29.4 ZY
Sunflower 29.7 b 28.1 bcd 28.5 de 29.5 cd 29.7 a 28.9 ab 28.4 cd 27.9 ab 29.7 a 30.9 ab
B C C B B BC C C B A 29.1 YX
Wheat 30.0 ab 29.7 a 30.8 a 29.9 bc 30.3 a 28.9 ab 30.6 a 28.4 a 29.5 a 30.0 cd
ABC ABC A ABC AB CD AB D BCD ABC 29.8 Z
Average 29.6 yxwd 28.5 v 29.5 yxw 29.9 y 29.7 yx 28.3 v 29.2 xw 27.3 u 29.1 w 30.7 z
a
Small letters in the column that are different indicate significance in spring wheat seed N concentration as influenced by first year crop residue at p ≤ 0.05 according to LSD. b
3.4. Precipitation Use Efficiency (PUE)
PUE is the interaction of factors such as crop, soil, and environment to efficiently convert sunlight, nutrients, and water into spring wheat seed. PUE is an agro-ecological parameter allowing for the comparison of production efficiencies among crop sequences. During dry years such as 2004, when growing season precipitation was 72% of the long-term average, PUE was greater (77.6 kg ha−1 mm−1) as compared to 2005 (62.9 kg ha−1 mm−1) when growing season precipitation was 128% of the long-term. Accordingly, frequency and timing of precipitation relative to plant demand greatly influence PUE.
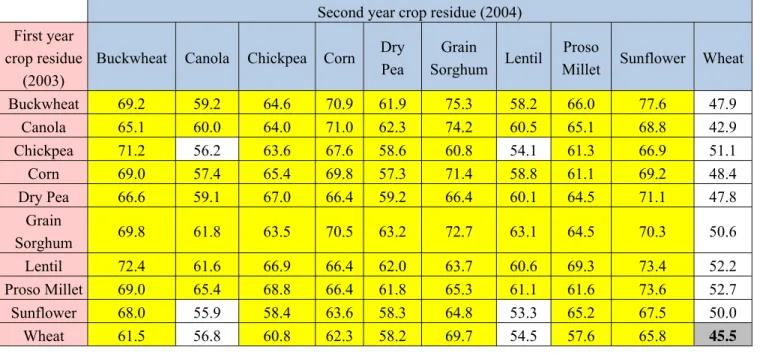
In 2004, the only crop sequence to have significantly greater PUE than continuous spring wheat (68.9 kg ha−1 mm−1) was the spring wheat-dry pea sequence (102.6 kg ha−1 mm−1) (Table 6). During dry weather when spring wheat production is limited by water, adding diversity to a cropping system with dry pea could result in a cropping system that uses precipitation more efficiently; therefore, creating a cropping system more sustainable than continuous spring wheat in dry years.
In an above-average precipitation year like 2005, adding crop diversity significantly improved PUE above that for continuous spring wheat crop sequence (45.5 kg ha−1 mm−1) (Table 7). When spring wheat was the second year crop residue, PUE was not statistically different from continuous spring wheat crop sequence. Diversifying crops in cropping systems results in chemical composition differences of root exudates which diversifies soil microbial communities, such as fungi and bacteria, in the rhizosphere synergizing a following spring wheat crop to improve sustainability of the system and increase PUE without adding extra inputs to the system [8]. Unusual crop sequences that cannot be explained include first and second year crop residues of chickpea-canola, chickpea-lentil, sunflower-canola, sunflower-lentil, spring wheat-canola, and spring wheat-lentil, which were not statistically different than continuous spring wheat.
Table 6. Spring wheat precipitation-use efficiency (PUE, kg ha−1 mm−1) as influenced by crop sequence in 2004 (Site 1). PUE in yellow is significantly greater than continuous wheat (Bold, gray background) which was used as the control in Dunnett’s one-tailed test.
Second year crop residue (2003) First year
crop residue (2002)
Buckwheat Canola Chickpea Corn Dry Pea
Grain
Sorghum Lentil
Proso
Millet Sunflower Wheat
Buckwheat 95.8 64.7 72.9 86.9 83.0 80.6 81.7 86.9 75.5 79.9 Canola 78.6 76.4 77.6 71.5 86.8 65.8 82.7 87.9 87.7 62.0
Chickpea 85.8 76.1 72.4 77.7 87.1 72.4 61.1 83.3 61.5 69.2 Corn 74.9 70.9 76.3 97.0 90.0 68.6 77.6 87.9 80.1 66.6 Dry Pea 78.9 86.2 76.9 87.9 93.2 67.6 76.2 88.0 69.9 60.6
Grain
Sorghum 75.9 64.7 80.9 85.8 89.0 72.0 98.7 77.2 79.1 68.1 Lentil 87.8 66.0 69.4 77.8 73.7 69.7 62.4 97.0 63.1 68.3 Proso Millet 69.7 75.4 79.4 99.0 101.5 71.3 93.8 97.0 68.5 60.6
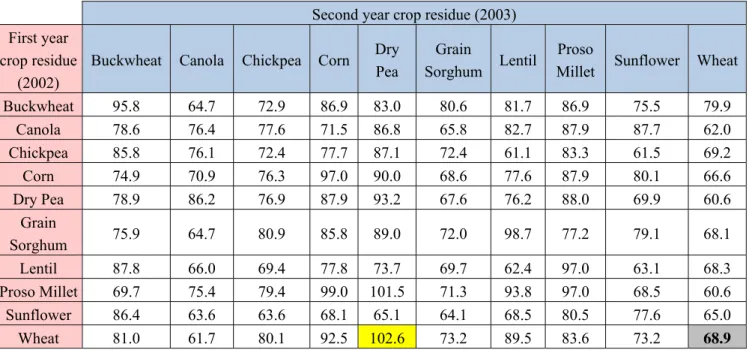
Table 7. Spring wheat precipitation-use efficiency (PUE, kg ha−1 mm−1) as influenced by crop sequence in 2005 (Site 2). PUE in yellow are significantly greater than continuous wheat (Bold, gray background) which was used as the control in Dunnett’s one-tailed test.
Second year crop residue (2004) First year
crop residue (2003)
Buckwheat Canola Chickpea Corn Dry Pea
Grain
Sorghum Lentil
Proso
Millet Sunflower Wheat
Buckwheat 69.2 59.2 64.6 70.9 61.9 75.3 58.2 66.0 77.6 47.9 Canola 65.1 60.0 64.0 71.0 62.3 74.2 60.5 65.1 68.8 42.9 Chickpea 71.2 56.2 63.6 67.6 58.6 60.8 54.1 61.3 66.9 51.1 Corn 69.0 57.4 65.4 69.8 57.3 71.4 58.8 61.1 69.2 48.4
Dry Pea 66.6 59.1 67.0 66.4 59.2 66.4 60.1 64.5 71.1 47.8 Grain
Sorghum 69.8 61.8 63.5 70.5 63.2 72.7 63.1 64.5 70.3 50.6
Lentil 72.4 61.6 66.9 66.4 62.0 63.7 60.6 69.3 73.4 52.2 Proso Millet 69.0 65.4 68.8 66.4 61.8 65.3 61.1 61.6 73.6 52.7 Sunflower 68.0 55.9 58.4 63.6 58.3 64.8 53.3 65.2 67.5 50.0
Wheat 61.5 56.8 60.8 62.3 58.2 69.7 54.5 57.6 65.8 45.5
4. Summary
Cropping systems have evolved over the decades into highly specialized production systems that are heavily dependent on fossil fuel inputs and advanced technology. To be sustainable in the future, agriculture needs to move beyond fossil fuel based systems and rely more on renewable systems that are resilient. Research in cropping systems that evaluates crop sequence to improve crop production beyond fossil fuel derived increases in yield may be the first step toward more sustainable agricultural systems. Crop sequence plays a pivotal role in diversifying cropping systems to synergize agro-ecological parameters resulting in improved production efficiencies. In a crop sequence, second year crops influence spring wheat seed yield more than first year crops. Including crops other than spring wheat in a crop sequence synergizes a spring wheat crop improving capture of sunlight, enhancing nutrient uptake, and improving use of precipitation. Enhancing crop biodiversity in cropping systems is a key agro-ecological strategy to develop more sustainable agricultural systems for the future.
Acknowledgements
References
1. Brummer, E.C. Diversity, stability, and sustainable American agriculture. Agron. J. 1998, 90, 1-2. 2. Kirschenmann, F. Why American agriculture is not sustainable. Renewable Resour. J. 2002, 20,
6-11.
3. Altieri, M.A. The ecological role of biodiversity in agroecosystems. Agric. Ecosyst. Envron. 1999, 74, 19-31.
4. Hildebrand, P.E. Agronomy’s role in sustainable agriculture: Integrated farming systems. J. Prod. Agric. 1990, 3, 285-288.
5. Farahani, H.J.; Peterson, G.A.; Westfall, D.G. Dryland cropping intensification: A fundamental solution to efficient use of precipitation. Adv. Agron. 1998, 64, 97-223.
6. Liebig, M.A.; Tanaka, D.L.; Krupinsky, J.M.; Merrill, S.D.; Hanson, J.D. Dynamic cropping systems: Contributions to improve agroecosystem sustainability. Agron. J. 2007, 99, 899-903. 7. Zentner, R.P.; Campbell, C.A.; Biederbeck, V.O.; Miller, P.R.; Selles, F.; Fernandez, M.R.
In search of a sustainable cropping system for the semiarid Canadian prairies. J. Sust. Agric. 2001, 18, 117-136.
8. Kennedy, A.C. Soil microbial diversity in agricultural systems. In Exploring the Role of Diversity in Sustainable Agriculture; Olson, R., Francis, C., Kaffka, S., Eds.; American Society of Agronomy (ASA): Madison, WI, USA, 1995; pp. 35-54.
9. Kirschenmann, F.L. Potential for a new generation of biodiversity in agroecosystems of the future. Agron. J. 2007, 99, 373-376.
10. Francis, C.A. Potential of multiple cropping systems. In Agroecology and Small Farm Development; Altieri, M.A., Hecht, S.B., Eds.; CRC Press: Boca Raton, FL, USA, 1986; pp. 137-150.
11. Tanaka, D.L.; Krupinsky, J.M.; Merrill, S.D.; Liebig, M.A.; Hanson, J.D. Dynamic cropping systems for sustainable crop production in the northern Great Plains. Agron. J. 2007, 99, 904-911. 12. Large, E.C. Growth stages in cereals; illustration of the Feeks scale. Plant Pathol. 1954, 3,
128-129.
13. Padmore, J.M. Protein (Crude) in Animal Feed—Dumas Method, Method No 968.06. In Official
Methods of Analysis of the Association of Official Analytical Chemists, 15th ed.; Herlich, K., Ed.; Association of Official Analytical Chemists (AOAC): Arlington, VA, USA, 1990.
14. Merrill, S.D.; Tanaka, D.L.; Krupinsky, J.M.; Liebig, M.A.; Hanson, J.D. Soil water depletion and recharge under ten crop species and applications to the principles of dynamic cropping systems. Agron. J. 2007, 99, 931-938.
15. Littell, R.C.; Milliken, G.A.; Stroup, W.W.; Wolfinger, R.D. SAS System for Mixed Models; SAS Institute: Cary, NC, USA, 1996.
16. Miller, P.R.; Holmes, J.R. Cropping sequence effects of four broadleaf crops on four cereal crops in the northern Great Plains. Agron. J. 2005, 95, 972-979.
18. Lupwayi, N.Z.; Soon, Y.K. Nitrogen release from field pea residues and soil inorganic N in a pea-wheat crop rotation in northwestern Canada. Can. J. Plant Sci. 2009, 89, 239-246.