Aggregate Two-way Co-Clustering of Ads and User Analysis for Online
Advertisements
Meng-Lun Wu
Dept. of Computer Science Information Engineering National Central University
Jhongli, Taoyuan [email protected]
Chia-Hui Chang
Dept. of Computer Science Information Engineering National Central University
Jhongli, Taoyuan [email protected]
Rui-Zhe Liu
Dept. of Computer Science Information Engineering National Central University
Jhongli, Taoyuan [email protected]
Teng-Kai Fan
Dept. of Computer Science Information Engineering National Central University
Jhongli, Taoyuan [email protected] Abstract—Clustering plays an important role in data mining,
as it is used by many applications as a preprocessing step for data analysis. Traditional clustering focuses on grouping similar objects, while two-way co-clustering can group dyadic data (objects as well as their attributes) simultaneously. In this research, we apply two-way co-clustering to the analysis of online advertising where both ads and users need to be clustered. The key data that connect ads and users are contained in the user-ad link matrix, which denotes the ads that a user has linked. We proposed a three-staged clustering that makes use of the three data matrices to enhance clustering performance. In addition, an iterative cross co-clustering algorithm is also proposed for two-way co-clustering. The experiment is performed using the advertisement and user data from Morgenstern, a financial social website that focuses on the agent of advertisements. The result shows that three staged clustering provides better performance than traditional clustering, while iterative co-clustering completes the task more efficiently.
Keywords: co-clustering; decision tree; KL divergence; Dyadic data analysis; clustering evaluation
I. INTRODUCTION
Web advertising (Online advertising), a form of advertising that uses the World Wide Web to attract customers, has become one of the world’s most important marketing channels. Ad$Mart is an online advertising service launched by the Umatch community website. Umatch is a social networking platform that advertises “self- management” based on Web2.0 and is a content provider for financial planning. On one hand, Umatch involves people through activities such as creative curriculum vitae, financial Olympia, world's dynamic asset allocation, and other professional competitions; on the other hand, it runs the ad community economic platform “Ad$Mart” to share ad profits with users who place the ads on their personal homepages (called “Self-Portraits”), as advertising spokesmen. In contrast to the contextual advertising mechanism offered by Google Ad-sense, Umatch services are built on a community entry with functions such as Self- Portrait to link advertisements and analysis of users’ Lohas lifestyle risk preferences.
Ad$Mart and Google Ad-sense both realize the long tail theory, which subverts the 80/20 law and provides low advertising costs. The biggest difference is that the users of Ad$Mart can choose what ads are placed on their self- portraits while the users of Google Ad-sense have hardly any control over what ads will be placed on their web sites. One
benefit is that the users can maintain a consistent style for their homepages, which can avoid the inconsistent allocations of ads due to negative associations in given contexts, as shown in [2]. Although Ad$Mart has separated their business model from Google Ad-sense, the biggest issue here is how to provide advertisers with more specific traffic and provide users with the most appropriate advertisements. In other words, the role of an agent is to create a triple win situation for advertisers, users and itself (i.e., the ad agent platform).
The main focus of this paper is to apply clustering techniques to group ads as well as users. The idea is to understand the correlations between ad clusters and user groups such that the agent platform could provide user group analysis for each ad cluster to determine the best strategy for them to maximize their advertising effectiveness. The traditional clustering problem deals with one-way clustering, which treats the rows of a data matrix as objects and uses the columns as attributes for similarity computation. Thus, if we want to obtain user groups and ad clusters, we may apply traditional clustering to the user-by-ad matrix to obtain user groups; then we may transpose the matrix to become the ad by user-feature matrix and apply traditional one-way clustering to obtain ad clusters. Although such clustering results may be the best in terms of the inter-cluster over intra-cluster object distances, they do not consider the constraints that exist among ad clusters and user groups.
What makes the problem different is that we not only have the user-by-ad matrix but also two additional matrices, which describe specific features of users and ads. For example, the user-feature matrix, also called Lohas data, is the result of a lifestyle preference survey of the users, while the ad-feature matrix contains the settings of the advertisements (e.g., amount, and limitations on users). In this research, we design co-clustering algorithms for the analysis of online advertising where both ads and users need to be clustered.
The specific research questions to be addressed are as follows.
1. How do we use the ad-feature matrix, the ad-by- user link matrix, and the user Lohas life mode analysis to achieve the co-clustering?
2. What kinds of evaluation can verify the co- clustering results?
Following a discussion of the problem of co-clustering and data preprocessing, this paper reports on an exploratory study designed to investigate whether this kind of co- clustering algorithm can outperform traditional one-way
clustering algorithms. The rest of the paper is organized as follows: Section 2 introduces related work and some background knowledge; Section 3 gives a more detailed description of the data used; Section 4 describes the proposed algorithm; Section 5 reports the experimental results; and finally, Section 6 concludes the paper.
II. RELATED WORK
This section briefly introduces the applications of one- way clustering in online advertising and dyadic clustering.
One way clustering has been applied for both user and ad analysis. For user analysis, some prior studies [1] focused on how to construct a representative user profile for user clustering. The ad agency can decide whether an incoming ad should be suggested to the users of specific group using a similarity measurement (e.g., the cosine function or the Jaccard function) between the ad and user group. For ad analysis, clustering algorithms have been applied to the ad and/or ad-by-user link matrix to discover ad clusters. After computing the similarity between the new ad and each ad cluster, the ad agency can determine whether the new ad should be assigned to the users within specific clusters.
Although there are well-developed one-way clustering algorithms, it often happens that the relationship between the row data and column data is useful. Therefore, the two- way co-clustering method has recently been proposed for grouping the dyadic data simultaneously. In many research studies, the idea of co-clustering is implemented by constraint optimization through the some mathematical models. Dillon et al. (2001) proposed “information- theoretical co-clustering” [4], which regards the occurrence of words in documents as a joint probability distribution for the two random variables: the document and the word. By minimizing the difference in the mutual information (between document and word) before and after clustering and by decomposing the objective function based on KL divergence, they are able to achieve the desired co- clustering be iterative assignment of documents and words to the best clusters. Later, they also proposed the use of Bregman divergence instead of KL divergence for cases when the data matrix contains negative values [5]. As for applications, Hanisch et al. [6] used co-clustering methods in bioinformatics and found relationships between genes and data descriptions. Bo Long et al. (2005) utilized matrix decomposition to achieve better results [7].
While the goal of this paper is co-clustering, we have two additional matrices, which are different from those used in the previous work. In the next section, we will give more detailed descriptions of the data.
III. DATADESCRIPTION
Ad$Martis an online ad service launched by Umatch as an activity of the financial social web-site. The goal of Ad$Mart is to create a triple-win commercial platform for the advertisers, registered users and platform provider. The idea is that an advertiser pays a low cost for its products to be shown on the website (e.g., members’ self-portraits),
while the platform provider shares advertising profits with the registered members who link the ads on their web space to endorse the product, dividing the profits based on the activity scores of the registered members.
In contrast to traditional contextual advertising, users of Ad$Mart have to select ads by midnight before the display of ads begins. Because the ads are sorted by the amount purchased (M) by advertisers when they are shown to members for selection, the top ranked ads often have a lot of links by users. To avoid having all the profits go to a single individual with high popularity, the advertiser can set an upper bound on the users’ activity score (K_high). Similarly, the advertiser can set a lower bound on the activity score (K_low) to avoid the display of ads on unpopular self-portraits. In addition, advertisers can also limit the total number of users (L) linked to the ad. In summary, an ad may contain advertising settings, such as play date, title, daily amount (M), the order (O) in the ad list, the upper bound (K_low) and lower bound (K_high) of the users' activity score, the number of users that can link the ad (L), and the resulting total number of linked people (N).
However, because each ad can have its own display schedule, we also need some preprocessing steps to summarize various numbers of display dates or linked users. For daily data, we use six numerical indicators: maximum, minimum, median, variance, 1st and 3rd quartile to summarize the various values. Meanwhile, because daily values are much larger than the order values, we apply the logarithm to the daily values. As for the bounds on users’ activity scores, we use a Boolean value to denote the case when the upper or lower bound is set (K= K_high∪ K_low). Including also the number of days that the ad is displayed or linked from 09/15/2009 to 11/14/2009, we have a total of 17 features for 463 ads.
In addition to the ad-feature matrix, we have two other data matrices to be analyzed: the ad-by-user link matrix1and the user-feature (Lohas) matrix. The ad-by-user link data contains the number of links from 09/15/2009 to 11/14/2009. Although there are 20,000 members, the total number of users who are also involved in Ad$Mart is only 16,500. Finally, the user Lohas matrix contains users’ answers to 24 questions about their lifestyle. However, the number of users who also played the Lohas game is only 1,685 during the relevant period. Thus, we shall focus mainly on ad clusters while considering user clusters as a secondary goal.
IV.
T
HEP
ROPOSEDC
O-
CLUSTERINGM
ETHODS The goal of this paper is to analyze ads clusters as well as user groups. The objective is to determine if there is any connection between ad clusters and user groups. For example, are there special ad clusters that will be especially attractive to a particular group of users? Will some common settings lead to large or small numbers of user links? Similarly, are there special user groups that will only link to1 If we transpose the ad-by-user link matrix, we obtain the user-by-ad link matrix.
particular clusters of ads? For example, will users who link to ads with high daily amounts also link to similar ads with high amounts?
Traditional clustering focuses on one-way clustering, which relies on the attributes of either the row or column, but not both. In this paper, we would like to achieve two- way clustering with two additional feature matrices. In a way, the two data matrices present new constraints on the 2- way clustering problem. This is why we could not apply existing co-clustering algorithms like information theoretic co-clustering [5] or Bregman Co-clustering [6] or block value decomposition [7] since all these methods do not consider augmented matrices.
In this paper, we propose two clustering methods, three-stage clustering (3-stage) and iterative cross co- clustering (ICCC). Both methods aggregate traditional one- way clustering, k-means, to overcome the high dimension problem when combined with an ad-by-user link (or user- by-ad link) matrix. The former aims to cluster either ads or users; thus, we can have either ad-based 3-stage clustering or user-based 3-stage clustering. In the following, we will introduce ad-based 3-stage clustering and user-based three- stage clustering separately. Finally, iterative cross co- clustering conducts two-way clustering at the same time. 4.1 AD-BASED3-STAGE CLUSTERING
As implied by the name of three-stage clustering, there are three steps. The first step use k-means on the ad-feature matrix to produce ad clusters that could be used to group user-ad links for user clustering in the second step. Similarly, the user groups produced are used to group the ads by user links for ad clustering.
Step 1:
We adopt the ad-feature matrix as the input data of this step. The K-means algorithm is applied to the ad-feature matrix and generates the ad cluster. The parameter K is set to range from 2 to 5, and we define the value of K in each step identically. For example, if the K value is set to 5 in step 1, then the K values of steps 2 and 3 are also set to 5. Step 2:
The ad cluster generated from step 1 is used to reduce the dimension of the user-ad link matrix. The reduction method is to sum up the click times of useri over the elements of the ad clusterk.
To prevent extremely large values from dominating the clustering results, we take the logarithm of the summation values. The reduction method can be expressed as the following Equation (1), and it produces the user-ad cluster link matrix, also called the reduction matrix.
k
Adi ij
A ) L (
= k) UL(j,
log2 ˆ ……… (1)
We use the reduction matrix as the input data in this step and apply the K-means algorithm to the input data. In this step, we obtain the user group, which will be the reference data of next step.
Step 3:
In this step, we use the user group and ad-user link matrix to reduce the dimension: we sum up the click times of adiover the elements of the user groupl,, as in Equation (2)
j l
User ij
U ) L (
= l) AL(i,
log2 ˆ …………..…… (2)
After the reduction method, we combine the ad-feature matrix with the reduction matrix. We use the K-means algorithm to group this combined matrix and generate the new ad cluster that is our final result. The complete algorithm of the ad-based 3-stage algorithm is shown in Figure 1.
Figure 1. Ad based 3-stage clustering algorithm 4.2 USER-BASEDTHREE-STAGED CLUSTERING
The rule of 3-staged clustering is also applied to the user Lohas matrix. In this part, the input data are the user Lohas matrix, the user-ad link matrix and the ad-user link matrix. As mentioned above, the clustering of each step also uses the K-means algorithm.
Step 1:
In this step, the ad-feature matrix is replaced with the user Lohas matrix for the user clustering.
Step 2:
According to the Equation (2), the user group generated from step 1 is used to reduce the dimension of the ad-user link matrix producing the ad-user group link matrix, which is then used to generate the ad cluster.
Step 3:
Based on the ad cluster of step 2 and Equation (1), we reduce the dimension of the user-ad link matrix to produce the user-ad cluster link matrix. Then, we combine the user- ad cluster link matrix with the user Lohas matrix, which is
Input: Ad feature matrix (Ad) and Link matrix (User and Ad)
1. Apply K-means to Ad matrix to get initial ad clustering Â0
2. User clustering:
a. Merge the User Link matrix by Ad cluster Â0 to get UL
b. Apply K-means to UL matrix to get new user grouping Û0
3. Ad re-clustering:
a. Merge the Ad Link matrix by User grouping Û0to get AL
b. Apply K-means to Ad+AL matrix to get new ad clustering Â’
used to group the users. The complete algorithm of the user- based 3-stage algorithm is shown in Figure 2.
Figure 2. User based 3-stage clustering algorithm 4.3 ITERATIVECROSSCO-CLUSTERING
Three-stage clustering only groups ads and users separately based on the ad-feature matrix and the ad-user link matrix or the user Lohas matrix and the user-ad link matrix, but it does not refer to both ad data and user data simultaneously. Iterative cross co-clustering (ICCC) improves the 3-staged clustering results by taking the ad data and the user Lohas matrix simultaneously into account and cross-correlating the clustering results.
Figure 3. Iterative cross co-clustering algorithm.
During the ICCC process, we also utilize the K-means algorithm to group the data in each step. We define the initial ad cluster and the initial user group based on the grouping of the ad-feature matrix and user the Lohas matrix separately. As in the 3-stage clustering process, the reduction method is employed to the link matrix to produce the reduction matrix, which is combined with the ad-feature matrix or the user Lohas matrix separately. In the following, we group the ads and users according to the combined matrix. We will repeat this process until a stable result is generated. The complete algorithm is shown in Figure 3.
Figure 4. Iterative cross co-clustering framework. Step 1:
Our initial data are the ad-feature matrix and the user Lohas matrix. The K-means algorithm is applied to group the ad-feature matrix. The user Lohas data, regarded as the categorical data, are grouped by the K-means algorithm. We will get the initial ad cluster and user group in this step. Step 2:
After step 1, we have an initial ad cluster and user group, which can be used to reduce the dimension of the ad- user link matrix. In this step, the reduction of the ad-user link matrix is conducted by using Equation (2) with the initial user group, and we obtain the ad-user group link matrix. Then, we combine the ad-user group link matrix with the ad-feature matrix, to obtain the so-called combined matrix, which is then grouped by using the K-means algorithm to get a new ad cluster.
Step 3:
Similarly, we have an initial ad cluster from step 1, and we apply Equation (1) to reduce the dimension of the user- ad link matrix and get the user-ad group link matrix. Then, we combine the user-ad group link matrix with the user matrix, which is grouped by using the k-means algorithm and generates a new user group.
Ad (1.a) K-means (1.b) K-means
Ad clusters User groups
(2.a) Ad_link By user group
(3.a) User_link By ad cluster
User
(2.b) K-means (3.b) K-means
Input: lohas matrix (User) and Link matrix (User and Ad)
1. Apply K-means to User matrix to get initial user group Û0
2. Ad clustering:
a. Merge the Ad Link matrix by User group Û0to get AL
b. Apply K-means to AL matrix to get new ad cluster Â0
3. User re-grouping:
a. Merge the User Link matrix by Ad cluster Â0to get UL
b. Apply K-means to User+UL matrix to get new user group Û
Iterative Cross Co-clustering Algorithm
Input: Ad feature matrix (Ad), User lohas matrix (User), and Link matrix (Link)
1. Initial clustering:
a. Apply K-means to Ad matrix to get initial ad clustering Â0
b. Apply K-means to User matrix to get initial user grouping Û0
c. t:=0; 2. Ad clustering:
a. Merge the link matrix by User groups Ûtto get AL b. Apply K-means to Ad+AL matrix to get new ad
clustering Ât+1
3. User grouping:
a. Merge the link matrix by Ad cluster Âtto get UL b. Apply K-means to User+UL matrix to get new user
grouping Ût+1
4. t:=t+1; Go to Step 2;
Step 4:
We regard the new ad cluster and user group as the initial clusters and repeat steps 2 and 3 until the clustering results reach a stable state. We use trial and error to get the best setting of number of iterations to be two runs.
V.
E
XPERIMENTS RESULTS ANDE
VALUATION 5.1 Evaluation MethodsClustering methods are usually evaluated by classification accuracy based on some standard answers. The question arises of how to evaluate clustering results when there are no standard answers. In this paper, we propose two kinds of evaluation methods, the classification based evaluation and the KL divergence based evaluation.
The former uses the average F-measure of the classification results to indicate the performance of a clustering. We regard the ad clustering result as the classification target and apply decision trees to construct a model for ad classification. The idea is that the higher the average F-measure of the decision model, the better the clustering result. Thus, we can evaluate the performance of different clustering methods on ad clusters. Likewise, we also employ the user matrix and the user-ad link matrix to evaluate the performance of the user grouping. The user grouping result can be regarded as the user labels for the user classification task. Similarly, we apply decision trees to predict the class of users and use the average F-measure to evaluate the performance.
The second evaluation method exploits the characteristic of co-clustering by measuring the differences in the class distributions between clusters. Given k ad clusters Â={1,2, …k} and l user groups, Û={1,2, …,
l}, we can define the user group distribution p(Û|i) for each ad cluster i, i{1,…k} and compute the KL divergence between any two clustersiand jto represent the difference between the two clusters.
L
=
k k i
j k i
k
j i
KL
)) α p(ν |
α ) p(ν | ( α ) p(ν |
=
α ))
| U p(
|| α )
| U (p( D
1
log ˆ ˆ
………… (3)
Similarly, we can define the ad distribution p(Â|j) for each user group j, j{1,…,l} and compute the KL divergence between any two user groups i and j to represent the difference between these two user groups. The higher the KL divergence is, the better the co-clustering result we achieve. Thus, we could evaluate the co-clustering performance according to the average KL divergence of the ad clusters and user groups as follows.
L
= i
L
i j
j i
KL
= User
K
= i
K
i j
j i
KL Ad
User Ad
ν ))
| A p(
|| ν )
| A (p( ) D
KL L(L
α ))
| U p(
|| α )
| U (p( ) D
= K(K KL
KL + KL
= ) U , A KL(
1 1
ˆ 1 ˆ
1
ˆ 1 ˆ
1 ˆ ˆ
.… (4)
5.2 Evaluation of Ad Data
Although the original number of users in the ad-user link matrix reached 7,980, not every user participated in the Lohas game questionnaire; thus, we have to take account of users who participated in the questionnaire and in the Ad$mart system. Therefore, we add the Lohas game into the experiments, and the number of users drops to 1,685.
Our input data include an ad-user link matrix containing have 463 ads with 1,685 users, an ad-feature matrix with 463 ads with 17 features, and a user Lohas matrix containing 1,685 users with 24 questions. Our testing data for the classification method consist of 463 ads with 1,702 features (which contain 1,685 users and 17 ad-features). The target of the classification is defined as the clustering result. First, we will use the decision tree as our classification method and observe the performance. Later, we will try different classification tools to evaluate our methods. We will compare the following clustering algorithms.
a. Baseline: K-means clustering on the combined ad- feature matrix with the ad-user link matrix. We regard the ad cluster as the target of the baseline. b. Ad-based 3-stage clustering
c. Iterative cross co-clustering
We use the ad-by-feature matrix and the ad-by-user link matrix as the evaluation data when using the classification method to classify the combined matrix, and we set as the target the clustering results generated from different clustering algorithms. The experimental result is shown in Figure 5, where the x-axis represents the number of clusters, and the y-axis represents the F-measure. We observe the different F-measures from cluster 2 to cluster 5. According to the result, the ICCC algorithm provides a better F-measure than baseline. Because the baseline uses the testing data to achieve the clustering, which generates the clustering result as the target, it does not provide better performance in the decision tree classification.
Ads Classification Performance
0.700 0.800 0.900 1.000 1.100
F-measure
ICCC 1.000 0.981 0.950 0.946
3-stage 1.000 0.981 0.961 0.948 Baseline 0.998 0.926 0.899 0.835
K=2 K=3 K=4 K=5
Figure 5. Performance of ad classification (by decision tree) with respect to various cluster number
Average Ad Classification Performance
0.700 0.800 0.900 1.000 1.100
AverageF-measure
ICCC 0.976 0.956 0.936 0.935
3-stage 0.976 0.956 0.931 0.918
Baseline 0.995 0.952 0.927 0.897
K=2 K=3 K=4 K=5
Figure 6. Average Performance of ads classification by four (decision tree, svm, cart, logistic regression) classifiers
We observe the performance through other classification tools: decision tree, svm, cart and logistic regression. The average F-measure was computed on the classification tool corresponding to the clusters, and the results are presented in Figure 6. While our methods do not work better in all cases, the ICCC algorithms outperform the baseline in cluster 3, cluster 4, and cluster 5, and also outperform the 3-stage algorithm. The baseline had better performance in cluster 2; for this reason, we speculate that svm and logistic regression worked better to predict the target that was directly generated from the K-means algorithm.
5.3 Dyadic data evaluation
We combined the ad-user link matrix according to ad cluster  and user group Û, which were generated from the three clustering algorithm, and constructed the ad cluster– user group link matrix (AU matrix) by the following equation.
αi
k l νj kl
ij= Link
AU ……….. (5)
The equation defines the ad cluster-user group link matrix as the sum of the number of linkages between the user group land the ad cluster k. To compute the KL divergence, we normalize the number of linkages of each ad clusteriand get the distribution p(Û|i). We compute the KL divergence between ad clusters and take the average of all the KL divergence. Alternatively, the distribution p(Â|j) is computed by normalizing the number of linkages of each user group and computing the average KL divergence between user groups.
Figure 7 illustrates the KL divergence results when the cluster number K is equal to 5 in these algorithms. The x- axis represents the KLAd, KLUser, and KL(Â, Û), and the y- axis represents the average KL divergence among the ad clusters, the user groups, and the total of KLAdand KLUser. We use the ad cluster and user group generated from these three clustering algorithms to construct the ad cluster-user
group link matrix based on the ad-user link matrix. We fix the user group and compute the KL divergence between any two ad clusters, representing the difference between those two ad clusters, and we sum up all the KL divergence results and take the average of the KL divergence. On the other hand, we can also compute the average KL divergence between user groups. We discover that the differences among clusters are very large, while ICCC and 3-staged achieve better clustering than the baseline. Accordingly, our proposed methods offer better clustering results.
0 0.02 0.04 0.06 0.08 0.1 0.12 0.14
AverageKLdivergence
KL(Ad) KL(User) KL(A,U)
Evaluation by KL divergence
ICCC 3-stage Baseline
Figure 7. Evaluation by KL divergence 5.4 Evaluation based on the user data
Using data from the 1,685 users who completed the Lohas game and clicked ads, this evaluation sought to compare the user groupings of three algorithms:
a. Baseline: K-means clustering on the combined user Lohas matrix with the user-ad link matrix. We regard the user group as the target of the baseline. b. 3-stage clustering
c. Iterative cross co-clustering
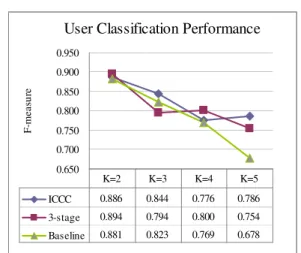
We use the decision tree as our first evaluation method, where we combine the user Lohas matrix with the user-ad link matrix as our testing data and generate the target from these algorithms. The F-measure is used to evaluate the effectiveness of each clustering algorithm. As shown in Figure 8, we discover that the baseline has poorer efficiency, except in cluster 3. The baseline uses the testing data for the clustering, which generates the user group as the target; however, it still did not work better than our proposed ICCC algorithm.
We compare the average F-measure through different classifiers: decision tree, svm, cart and logistic regression. Figure 9 illustrates the average F-measure involved in these events. Our proposed method does not outperform the others significantly in all the cases; there is a possibility that the svm and logistic regression worked better to predict the target directly generated from the K-means algorithm. Interestingly, the svm, logistic regression and K-means might have some correlation that we could not interpret.
User Classification Performance
0.650 0.700 0.750 0.800 0.850 0.900 0.950
F-measure
ICCC 0.886 0.844 0.776 0.786
3-stage 0.894 0.794 0.800 0.754 Baseline 0.881 0.823 0.769 0.678
K=2 K=3 K=4 K=5
Figure 8. Performance of user classification (by decision tree) with respect to various numbers of clusters
Average User Classification Performance
0.650 0.700 0.750 0.800 0.850 0.900 0.950
AverageF-measure
ICCC 0.890 0.832 0.784 0.774
3-stage 0.907 0.817 0.817 0.777
Baseline 0.895 0.834 0.774 0.727
K=2 K=3 K=4 K=5
Figure 9.Average Performance of user classification by four classifiers (decision tree, svm, cart, logistic regression)
Based on the experimental results, we determined that the baseline only produces a clustering according to the row or column, and it determines the difference between clusters in one layer data. However, our proposed method can take advantage of the information of users and ads to achieve a better clustering.
To summarize the above evaluation methods, the ICCC algorithm achieves better performance not only in the ad clustering but also in the user grouping in most cases. ICCC algorithm takes the ad information, user information and linkage information into account, so as to achieve the ad clustering and user grouping simultaneously and improve the effectiveness over the baseline.
VI. CONCLUSION
Traditional clustering focuses on the one-way clustering methods that cannot observe the correlations among dyadic
data. We propose the iterative cross co-clustering algorithm, ICCC, which refers to the ad-feature matrix and the user Lohas matrix. The idea of ICCC is based on using one-way clustering to achieve the co-clustering for better clustering effectiveness. When we view the ad cluster, we can also group the users at the same time and observe the correlation between user group and ad cluster.
Our evaluation method is evaluated by predicting the class, and the KL divergence is applied to evaluate the differences among the clustering algorithms. From the experimental results, we speculate that the 3-stage algorithm could group ads except for the user Lohas matrix or could group users except for the ad-feature matrix that might toward the clustering question into simpler form; thus, the 3- stage algorithm could attain better performance. However, the ICCC algorithm takes into account the ad-feature matrix, the user Lohas matrix, and the ad-user link matrix, which might contain more noise, but the ICCC sometimes outperformed the 3-stage algorithm. This finding might reflect some integration problems that we have yet to work out.
Future research could be conducted on using mathematical theorems and optimization techniques to implement co-clustering and to improve the former co- clustering algorithms using more theoretical techniques.
REFERENCES
[1] Kazunari Sugiyama, Kenji Hatano, and Masatoshi Yoshikawa
“Adaptive web search based on user profile constructed without any effort from users.” International World Wide Web Conference Proceedings of the 13th international conference on World Wide Web, pp. 675 - 684, New York, NY, USA, 2004.
[2] T.-K. Fan and C.-H. Chang: Sentiment Oriented Contexture Advertising. Journal of Knowledge and Information System, Vol. 23, No. 3, pp. 321-344, 2010.
[3] Inderjit S. Dhillon, “Co-clustering documents and words using bipartite spectral graph partitioning.” In KDD ’01: Proceedings of the seventh ACM SIGKDD international conference on Knowledge discovery and data mining. San Francisco, California pp. 269– 274.
[4] I. S. Dhillon, S. Mallela, and D. S. Modha. “Information-theoretic co- clustering.” In KDD ’03: Proceedings of the ninth ACM SIGKDD International Conference on Knowledge Discovery and Data Mining, pp. 89-98, New York, NY, USA, 2003. ACM Press.
[5] A. Banerjee, I. S. Dhillon, J Ghosh, S. Merugu, and D. S. Modha. “A Generalized Maximum Entropy Approach to Bregman Co-clustering and Matrix Approximation.” In KDD’ 04: Proceedings of the tenth ACM SIGKDD International Conference on Knowledge Discovery and Data Mining, pp. 509-514, Seattle, Washington, USA, 2004. ACM press.
[6] Hanisch D, Zien A, Zimmer R, and Lengauer T “Co-clustering of biological networks and gene expression data.” Institute for Algorithms and Scientific Computing (SCAI), Fraunhofer Gesellschaft, Schloss Birlinghoven, Sankt Augustin, 53754, Germany. [7] Bo Long, Zhongfei Zhang, and Philip S. Yu “Co-clustering by Block
Value Decomposition.” In KDD ’05: Proceedings of the eleventh ACM SIGKDD international conference on Knowledge discovery in data mining, pp. 635-640, Chicago, Illinois, USA, 2005. ACM press.