T itle
<S 1-14> D etection of interannual variability of the spatial
distribution of deforestation in B orneo by analyzing the
cloud-free daily MOD IS satellite-observed green-red vegetation index
A uthor(s )
Nagai, S hin; S uzuki, R ikie
C itation
Proceedings of the symposium "F rontier in tropical forest
research: progress in joint projects between the F orest
D epartment S arawak and the J apan R esearch C onsortium for
T ropical F orests in S arawak" (2016), 2016: 132-136
Is s ue D ate
2016-06
UR L
http://hdl.handle.net/2433/227117
R ig ht
T ype
D epartmental B ulletin Paper
S1-14
Detection of interannual variability of the spatial distribution of
deforestation in Borneo by analyzing the cloud-free daily MODIS
satellite-observed green-red vegetation index
Shin Nagai 1,2 and Rikie Suzuki 1
1
Department of Environmental Geochemical Cycle Research, Japan Agency for Marine-Earth Science and Technology, Yokohama, Japan
2Author for correspondence (e-mail: [email protected])
Abstract We examined the interannual variability of the spatial distribution of
deforestation in Borneo by analyzing the Terra and Aqua Moderate Resolution Imaging Spectroradiometer (MODIS) satellite-observed daily green-red
vegetation index (GRVI) from 2001 to 2013. In coastal regions of Sarawak
(Malaysia) and West and Central Kalimantan (Indonesia), deforestation and vegetation plantation establishment by planting oil palm or acacia were detected each year. In recent years, the area of deforestation and vegetation
recovery tended to extend into high-elevation hilly areas. These findings
suggest that the ecosystem function of carbon fixation may be continuously declining in large areas of Borneo.
Keywords Borneo, Deforestation, Green-red vegetation index, MODIS, Oil
palm
Introduction
To accurately evaluate global changes in the carbon balance under rapid climate changes, it is
crucial to assess the spatiotemporal variability of tropical ecosystem structure (biomass) and functioning (photosynthesis). The high biodiversity of tropical ecosystems also provides valuable
resources (food, timber, and genetic), as well as cultural and educational ecosystem services (SCBD 2010). However, deforestation and forest degradation have changed the land-surface
hydrology (Kumagai et al. 2013) and the carbon stock and flux (Adachi et al. 2011) in tropical
ecosystems. In insular Southeast Asia, including Indonesia and Malaysia, large areas of the tropical forest have been deforested and converted into oil palm plantations (GEAS 2011; Koh et al. 2011).
Previous studies have detected the spatial distribution of deforestation by analyzing
satellite-observed spectral reflectance data (Langner et al. 2007; Koh et al. 2011; Miettinen et al. 2011; Hansen et al. 2013). Few studies, however, have assessed the interannual variability in the
assessment may be due to limited chances for observation by satellites with high spatial resolution
(1–30 m) and the high rate of cloud contamination in daily-observed satellite data. For example, Nagai et al. (2014) reported that the frequency of satellite observation without cloud
contamination is 1–5 days/month during the southwestern monsoon period in Borneo (May to October) and 0–2 days/month in the northeastern monsoon period (November to April).
In this study, we examined the interannual variability in the spatial distribution of
deforestation in Borneo from 2001 to 2013 by analyzing the Terra and Aqua Moderate Resolution Imaging Spectroradiometer (MODIS) satellite-observed daily green-red vegetation index (GRVI).
We then evaluated the characteristics of the spatiotemporal distribution of deforestation in relation to land elevation.
Methods
Our study area was the island of Borneo, including Indonesia and Malaysia. We used the atmospherically corrected MODIS/Terra (morning observations) and MODIS/Aqua (afternoon
observations) “Surface Reflectance Daily L2G Global 500 m SIN Grid V005” data products (MOD09GA and MYD09GA; collection 5) for 2001 to 2013. The MOD09GA and MYD09GA
products were downloaded from the NASA Land Processes Distributed Active Archive Center (LP
DAAC) (https://lpdaac.usgs.gov/data_access/data_pool). We only used the MOD09GA product for 2001 and 2002 because the observation of MODIS/Aqua started in July 2002. We extracted the pixel values in the 500-m surface reflectance bands for red (620–670 nm) and green (545–565 nm)
in the MOD09GA and MYD09GA products by using the MODIS Reprojection Tool provided by
the LP DAAC (https://lpdaac.usgs.gov/tools). Daily GRVI was calculated by using the following equation (Motohka et al. 2010):
GRVI= (green – red) / (green + red) (1)
where green and red refer to the reflectance values for each pixel in the corresponding bands. To
extract high-quality GRVI data (GRVIbest, mainly without cloud contamination), we checked the
“Reflectance Data State QA (State 1 km)” values in the MOD09GA and MYD09GA products by using the MODIS Reprojection Tool.
To detect the spatial distribution of deforestation, we calculated the ratio of the number of days (No. days) of GRVIbest < 0 to No. days of all GRVIbest values for each pixel at a yearly time
step. A positive GRVI value indicates that the land was dominated by green leaves, whereas a negative GRVI value indicates that the land was dominated by red and yellow colored leaves or
bare soil (Motohka et al. 2010). Here, we assumed that a high ratio of (No. days of GRVIbest < 0) /
(No. days of all GRVIbest values) indicates deforestation (Nagai et al. 2014). We also validated satellite-observed GRVI by performing field studies in a lowland mixed dipterocarp forest in
Lambir Hills National Park (LHNP) in Sarawak, Malaysia (4°11'43.71''N, 114°2'25.55''E, 150–200 m above sea level). For a detailed description of the method of GRVI analysis and results of our
field studies in LHNP, see Nagai et al. (2014).
To examine the relationship between the spatial distribution of deforestation and land
elevation, we used the ASTER Global Digital Elevation Model, which has a 33.3-m spatial resolution (http://gdem.ersdac.jspacesystems.or.jp).
Results and discussion
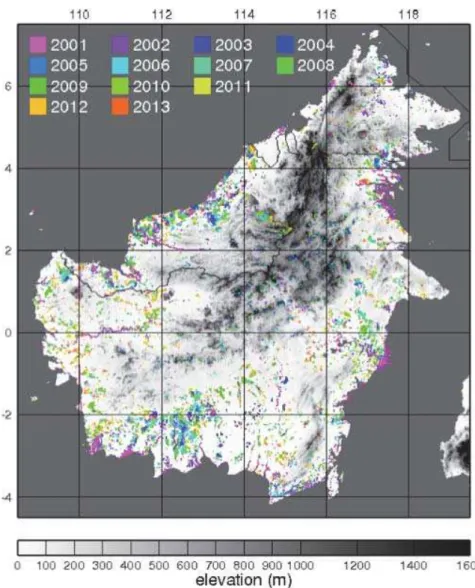
of (No. days of GRVIbest < 0) / (No. days of all GRVIbest values) was high (greater than 80 %) each
year (Fig. 1). The spatial distribution of deforestation changed from year to year as a result of deforestation and plantation establishment by planting oil palm or acacia (Nagai et al. 2014). Most
of these areas were originally peat swamp forests in Malaysia, and thickets, shrubs, grassland, cultivated perennial crops, and burnt (dry, sparse) vegetation in Indonesia (Stibig et al. 2004).
There has been marked carbon loss (stock and flow) due to land-use change from peat swamp forest to oil palm plantations (Hergoualc’h and Verchot 2011; Koh et al. 2011). Adachi et al.
(2011) reported that the total biomass and soil carbon of oil palm plantations was about one-third lower than that of rainforest 30 years after planting, based on simulations of a process-based
biogeochemical model. Thus, our findings suggest that the ecosystem function of carbon fixation
may be declining in large areas of Borneo.
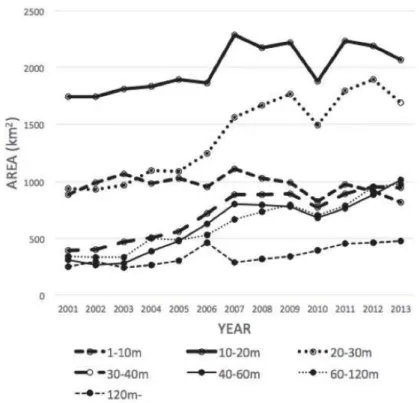
At elevations from 20 to 120 m, the area (km2) with a high ratio of (No. days of GRVIbest
< 0) / (No. days of all GRVIbest values) has increased since 2007 (Fig. 2). This means that the
Fig. 1 Spatial distribution of the areas showing (No. days of GRVIbest < 0) / (No.
deforestation and vegetation recovery by planting oil palm extended into high-elevation hilly areas
that are relatively difficult to access. Demand for palm oil products has increased with economic growth in developing countries. GEAS (2011) predicted that global demand for palm oil would
increase two-fold by 2020. Compared with Borneo (except for Sabah in Malaysia), the ratio of
oil-palm-harvested area to country area is 8- to 40-fold higher on the Malay Peninsula and in Sumatra in Indonesia (Fitzherbert et al. 2008). In 2006, the production quantity of oil palm from
Indonesia sharply exceeded that from Malaysia, although both countries have increased the production quantity since the 1970s (FAOSTAT; http://faostat.fao.org). In the near future,
especially in Indonesia, the deforestation and vegetation recovery by planting oil palm may gradually extend into high-elevation hilly areas in inland West and Central Kalimantan. In
contrast, deforestation and vegetation recovery may gradually reach a steady state in coastal regions of Sarawak (Malaysia) because of depletion of the forests to be felled. The only observed
vegetation changes will be the cycle of clear felling and replanting of oil palms at 25- to 30-year
intervals (Wahid et al. 2005; GEAS 2011).
Here we show that the analysis of cloud-free satellite-observed daily GRVI is useful for
detecting interannual variability in the spatial distribution of deforestation at a coarse spatial resolution (500 m). The recently launched Advanced Himawari Imager on the Himawari-8
next-generation geostationary meteorological satellite may help us to develop our approach owing to its high frequency of observation (every 10 min), although the spatial resolution of spectral
reflectance is inferior to that of MODIS (1 km). Further studies will also be required to estimate the interannual variability of the carbon stock and flows in tropical ecosystems by using a
Fig. 2 Interannual variability of the area in Borneo that showed (No. days of
GRVIbest < 0) / (No. days of all GRVIbest values) of more than 80%, categorized by
process-based biogeochemical model incorporating the interannual variability of the spatial
distribution of deforestation.
Acknowledgements
This study was supported by the Research Institute for Humanity and Nature (project D-04); the
Environment Research and Technology Development Fund (S-9) of the Ministry of the
Environment of Japan; KAKENHI grants (24710021 and 15H02645) from the Japan Society for the Promotion of Science; and the Hydrospheric Atmospheric Research Center, Nagoya
University.
References
Adachi M, Ito A, Ishida A, Kadir WR, Ladpala P, Yamagata Y (2011) Carbon budget of tropical
forests in Southeast Asia and the effects of deforestation: an approach using a process-based model and field measurements. Biogeosciences 8:2635–2647
Fitzherbert EB, Struebig MJ, Morel A, Danielsen F, Brühl CA, Donald PF, Phalan B (2008) How will oil palm expansion affect biodiversity? Trends Ecol Evol 23:538–545
GEAS (2011) Oil palm plantations: threats and opportunities for tropical ecosystems. UNEP
Global Environmental Alter Service, 8 pp (http://www.unep.org/GEAS)
Hansen MC, Potapov PV, Moore R, Hancher M, Turubanova SA, Tyukavina A, Thau D, Stehman SV, Goetz SJ, Loveland TR, Kommareddy A, Egorov A, Chini L, Justice CO, Townshend
JRG (2013) High-resolution global maps of 21st-century forest cover change. Science
342:850–853
Hergoualc’h K, Verchot LV (2011) Stocks and fluxes of carbon associated with land use change in
Southeast Asian tropical peatlands: A review. Global Biogeochem Cycles 25:GB2001, doi:10.1029/2009GB003718
Koh LP, Miettinen J, Liew SC, Ghazoul J (2011) Remotely sensed evidence of tropical peatland
conversion to oil palm. Proc Natl Acad Sci USA 108:5127–5132
Kumagai T, Kanamori H, Yasunari T (2013) Deforestation-induced reduction in rainfall. Hydrol Processes doi:10.1002/hyp.10060
Langner A, Miettinen J, Siegert F (2007) Land cover change 2002–2005 in Borneo and the role of
fire derived from MODIS imagery. Global Change Biol 13:2329–2340
Miettinen J, Shi C, Liew SC (2011) Deforestation rates in insular Southeast Asia between 2000
and 2010. Global Change Biol 17:2261–2270
Motohka T, Nasahara KN, Oguma H, Tsuchida S (2010) Applicability of green-red vegetation
index for remote sensing of vegetation phenology. Remote Sens 2:2369–2387
Nagai S, Ishii R, Suhaili A, Kobayashi H, Matsuoka M, Ichie T, Motohka T, Kendawang J, Suzuki R (2014) Usability of noise-free daily satellite-observed green-red vegetation index values for monitoring ecosystem changes in Borneo. Int J Remote Sens 35:7910–7926
SCBD (2010) Global biodiversity outlook 3. Secretariat of the Convention on Biological Diversity
Montreal, 94 pp
Stibig H-J, Achard F, Fritz S (2004) A new forest cover map of continental Southeast Asia derived
from SPOT-VEGETATION satellite imagery. Appl Veg Sci 7:153–162
Wahid MB, Abdullah SNA, Henson IE. (2005) Oil palm—achievements and potential. Plant Prod