sustainability
ISSN 2071-1050 www.mdpi.com/journal/sustainability ArticleThe Effects of Coal Switching and Improvements in Electricity
Production Efficiency and Consumption on CO
2Mitigation
Goals in China
Li Li 1,* and Jianjun Wang 2
1 School of Economics and Management, Beijing Information Science & Technology University,
100192 Beijing, China
2 School of Economics and Management, North China Electric Power University, 102206 Beijing,
China; E-Mail: [email protected]
* Author to whom correspondence should be addressed; E-Mail: [email protected]; Tel.: +86-138-1104-9697.
Academic Editor: Weidong Huang
Received: 28 April 2015 / Accepted: 13 July 2015 / Published: 17 July 2015
Abstract: Although the average CO2 emission for a person in China is only about 1/4 that
of a person in the US, the government of China still made a commitment to ensure that CO2
emissions will reach their peak in 2030 because of the ever-increasing pressure of global warming. In this work, we examined the effects of coal switching, efficiency improvements in thermal power generation and the electricity consumption of economic activities on realizing this goal. An improved STIRPAT model was developed to create the scenarios. In order to make the estimated elasticities more consistent with different variables selected to construct the formulation, a double-layer STIRPAT model was constructed, and by integrating the two equations obtained by regressing the series in each layer, we finally got the equation to describe the long-run relationship among CO2 emissions (Ic), the share of
coal in overall energy consumption (FMC), coal intensity of thermal power generation (CIp)
and electricity intensity of GDP (EIelec). The long term elasticities represented by the
equation show that the growth of CO2 emissions in China is quite sensitive to FMC, CIp and
EIelec. After that, five scenarios were developed in order to examine the effects of China’s
possible different CO2 emission reduction policies, focusing on improving FMC, CIp and
EIelec respectively. Through a rigorous analysis, we found that in order to realize the
committed CO2 emissions mitigating goal, China should obviously accelerate the pace in
efficiency of economic activities and a slightly slower improvement in the coal efficiency of thermal power generation.
Keywords: coal switching; coal intensity of thermal power generation; electricity intensity of GDP; renewable energies; STIRPAT
1. Introduction
Coal consumption and electricity production contribute significantly to environmental change and CO2 emissions worldwide, which are considered the major sources of global warming. This is especially
true in China. As estimated by the IEA [1], the world emitted a total of 31,734 million tons of CO2
through fuel combustion in 2012, while China emitted 8250.8 million tons, accounting for 26.00% of the world total. The statistics also show that China replaced the United States as the world’s largest CO2-emitting country in 2006. Because of this huge volume of CO2 emissions, China faced great
pressure to reduce CO2 emissions both to slow down the worldwide warming trend and for domestic
economic sustainability. Although the average CO2 emission for a person in China is only about 1/4 that
in the US, the Chinese government still promised that China will make its biggest effort to mitigate CO2
emissions, and that they will peak in the year 2030.
This is a huge promise and also a major challenge for China, and there have been criticisms from some researchers and experts saying that the goal is too ambitious to achieve. However, there are many opportunities for China to reduce CO2 emissions, with reducing the share of coal in overall energy
consumption being well-recognized as one of the most necessary ways [2,3]. Because of its carbon-intensive attributes, coal has been abandoned by many developed countries as a main fuel source in order to reduce greenhouse gas (GHG) emissions; however, in China, coal has supported more than 70% of overall energy consumption and this situation does not seem to have improved very much during last 30 years or more. It is therefore very possible for China to reduce coal consumption and increase the use of other, low-carbon fuels like renewable energy, nuclear power, biomass energy and natural gas, thus slowing down the growth of CO2 emissions. Besides coal switching, improvements in energy
efficiency of electricity production and consumption are also very crucial for reducing China’s CO2
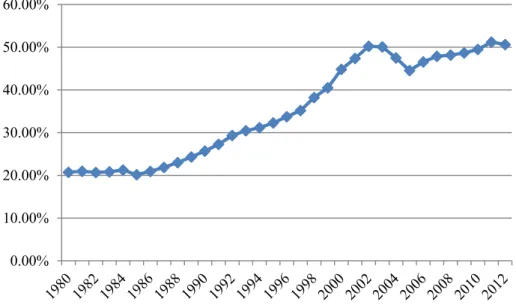
emissions. That is mainly because power generation consumed more than 50% of China’s coal resources (Figure 1) and is also the largest CO2 emitting sector in China, contributing to more than 30% of China’s
overall CO2 emissions (Figure 2). As a result of this China has made the improvement of coal efficiency
of thermal power generation a national priority for reducing GHG emissions [4]. Moreover, improvement in efficiency of electricity consumption is also important for China to mitigate CO2
Figure 1. Proportion of coal used by electric power generation in China from 1980 to 2013. Data source: self-calculated and collected from China Energy Statistical Yearbook 1986, 1991, 1996, 1999, 2004–2013 [6–11].
Figure 2. The contribution of power generation in overall CO2 emissions in China from 1980
to 2012. Data sources: data on energy consumption was self-collected from China Energy Statistical Yearbook 1986, 1991, 1996, 1999, 2004–2013 [6–11], data on CO2 was estimated by
multiplying the CO2 emission factor [12] and consumption of different kinds of energy.
Obviously, coal switching and energy efficiency improvement in electricity production and consumption have great potential for reducing CO2 emissions in China, but it is very important for policy
makers to know the extent to which improving these factors can help achieve the CO2 emissions
mitigation goal in 2030. The first important thing that needs to be known is the relationship between these factors and CO2 emissions. There are many studies that deal with the relationship between CO2
emissions and fuel switching. Özbuğday’s [13] research shows that substituting renewable energy for 0.00%
10.00% 20.00% 30.00% 40.00% 50.00% 60.00%
0 10 20 30 40 50 60 70 80 90 100
non-renewable energy reduces CO2 emissions in the long run. Jorges [14] finds that an increase in the
share of water heating and electric appliances has an effect on reducing household energy consumption and thus CO2 emissions in Mexico’s residential sector. In Luciano’s [15] research, the diversification of
the energy mix towards cleaner sources is found to be the main factor contributing to emission mitigation in Brazil. Similar research was also done in China. Geng [16] takes Liaoning Province in China as an example to investigate the different factors that contribute to the increase of CO2 emissions, the findings
show that improvement in energy intensity and fuel switching can partly offset the CO2 emission increase
caused by other factors such as growth in population and energy consumption per capita. In Yuan’s [17] research, it is found that fuel switching can reduce indirect emissions of CO2 emissions in the residential
sector of all regions in China, which is consistent with the researches of Ouyang [18], Wang [19] and Wang [20] with analyses on different sectors and regions in China. All of these studies confirm the positive role of diversification of the energy mix toward low carbon fuels in contributing to the reduction of CO2 emission; however, the effects vary greatly depending on the countries, regions, sectors and
economic developing levels researched. Also, because China’s energy consumption is dominated by coal and as pointed out by Lin [21], the share of coal in the total energy consumption is highly negatively related to the CO2 performance in China, reducing the coal share of final energy consumption is among
the first priorities in diversifying the energy mix toward low carbon fuels, like renewable energy, nuclear power, biomass fuels or natural gas. Regarding the roles of energy efficiency improvements in electricity production and consumption contributing to mitigating CO2 emissions, there are also many studies.
However, most of them just focus on the contribution of the electric power sector to CO2 emissions, as
found in [22–26] and also some specific research in China, like in [27,28]. Generally speaking, the results of this research show that improvements in energy efficiency in power generation, especially by integrating more renewable energy into the power sector, are important to reduce the CO2 emissions of
electricity production. Still other researchers study the improvement of power generation energy efficiency in contributing to reducing the overall CO2 emissions for all sectors. These can be found in
Sahbi [29] and Odenberger [30]. Although, as pointed out by Odenberger [30], integrating more renewable energy into power generation is crucial for the UK to achieve its goal of 60% reduction in CO2 by 2050
compared to 1990, Sahbi [29]’s research shows that for fossil fuel-intensive power generation (like China), to improve the energy efficiency of fossil fuel power generation and electricity consumption are more important than to increase the share of renewable energies in mitigating all sectors’ CO2 emissions.
Although there are many studies dealing with the effects of each or some of the factors, including fuel switching, energy efficiency improvement of electricity production and consumption, in contributing to the CO2 emissions mitigation, there is limited evidence available with regard to putting
them together to employ their aggregate effects on mitigating CO2 emissions in China, and this is exactly
the main contribution of this work. This work also contributes a double-layer STIRPAT model that was developed in order to make the estimation of long-term elasticities more consistent no matter what factors were selected, to reflect the technologies’ effects on CO2 emission. Based on that contribution,
the long-term elasticities of coal switching, energy efficiency improvement in thermal power generation and electricity efficiency of economic activities were estimated, which further guided the development of five scenarios used to trace the trend of CO2 emissions. Through a rigorous scenario analysis, the
of economic activities as well as coal switching in order to achieve the commitment CO2 mitigation goal
in 2030 were obtained, which provided a clear guideline for future policy makers.
The remainder of this work is constructed as follows: Section 2 introduces the double-layer STIRPAT model developed to explore the long-term relationship among coal switching, energy efficiency improvement in electricity production and consumption and the CO2 emissions trend in China during
2013–2040; Section 3 introduces the data processing methods; Section 4 develops the scenarios; Section 5 explains the results and provides the policy implications for China; and the final section concludes this work.
2. Methodology
2.1. Description
Scenario simulation A is an effective way for policy makers to preview the effects of a policy that is designed to mitigate CO2 emission. For several years’ development, there are many kinds of scenario
analysis methods that can be used to trace the long-term trend of CO2 emissions, which can be divided
into 2 categories: (1) the ones based on econometric modelling [22,31,32]; (2) and the ones based on long-run systematic energy analysis tools, such as LEAP [5,24,33], system dynamic [34] and so on. Obviously, these two kinds of methods are quite different; the econometric scenario models are useful to identify the key factors that influence the trend of CO2 emissions and also can clearly show the path
that each factor’s effect exerts in every stage, while the long-run systematic energy analysis tools are more suitable for simulating a CO2 emissions system with complex internal influences among all parts
of the system. However the difficulties in accurately carving out the internal relationships may result in large simulating errors. In this regard, through systematic tests and examination of historical data, the econometric scenario analysis can minimize the simulating errors and thus build more accurate equations that describe the long-term relationship among all the factors selected.
Because of the different inherent theories it is based on, econometric scenario analysis can be normally grouped into two kinds of research in simulating the trends of CO2 emissions. One is based on
the Kuznets curve theory [31,35], and the other one is based on IPAT (Impact of Population, Affluence and Technology) theory. In Kuznets curve theory, it is assumed that CO2 emissions are mainly caused
by affluence, while in IPAT theory, the effects of technologies and population are also included. Moreover, because technologies can be decomposed into different factors, scenario analysis based on IPAT theory is superior to Kuznets curve theory in scaling the effects of various factors in contributing to the development of CO2 emissions.
The basic philosophy in the IPAT model is that the environment is impacted by the growth of population, income and technologies used for economy, and the formula is [36]
I=P×A T× (1)
Rosa developed the STIRPAT (stochastic impacts by regression on population, affluence, and technology) model [37] to evaluate the different effects of P, A and T on the change in environment impacts, which can be calculated as
b c d
I =aP A T e (2)
where a is the constant of the model, b, c and d are the coefficients, and e is the model residual error term.
Equation (2) can be further transformed into
lnI=lna+blnP+clnA+dlnT+lne (3) Equation (3) shows that the elasticity of P, A and T to I can be represented by b, c and d, which means that every 1% increase in P, A and T can result in a%, b% and c% of increase in I respectively. Because the technologies influencing CO2 emissions can be explained by different factors like energy intensity,
fuel mix and industrial structure, the STIRPAT model is widely used to express the relationship among different factors that contribute to change in CO2 emissions [38–41].
2.2. A double-Layers STIRPAT Model
One of the biggest challenges in using the STIRPAT model to simulate the long-term relationship among population, affluence, technologies and CO2 emissions is that the coefficients obtained by the
econometric model depend greatly on what factors are chosen to reflect the technologies, even for the same regions. For example, in both Meng’s [42] and Li’s [43] research, the driving factors of China’s CO2 emissions are researched, but because of the different factors selected to reflect the technologies,
with Meng [42] selecting CO2 intensity of GDP and Li [43] selecting energy intensity, the elasticities of
both population and affluence are quite different in these two studies. The results of Meng [42] show that a 1% increase in population and affluence will result in a 1.81% and 1.91% increase in CO2
emissions, respectively, while in Li’s [43] research, these two figures are 1.12% and 1.31%. This is quite confusing, and in order to conquer this obstacle in using the STIRPAT model, this work developed a double-layer STIRPAT model, the basic framework of which is illustrated by Figure 3. This framework illustrates the thought that CO2 emissions in China are basically caused by the activities of the
population, affluence and energy consumption technologies. The change in energy consumption technologies can be further reflected by the change of fuel mix, industrial structure and some other unknown factors. Thus, the basic STIRPAT model can be further developed into a double-layer model which is formulated as
lnI=lna+blnP+clnA+dlnET +lne (4)
1 2 3
lnET =lnET +lnET +lnET +lnETn (5) where ET represents the level of energy consumption technologies, and ET1, ET2, …, ETn represent the
factors that influence the level of energy consumption technologies. Equations (4) and (5) show that, from a mathematical view, because there exists an equation that can explain the relationship among I and ET, and at the same time an equation describing the relationship among EI and ET1, ET2, …, ETn,
Figure 3. Double-layers STIRPAT Model.
In the above double-layer STIRPAT model, researchers can choose any factor to reflect the change in energy consumption technologies while keeping the coefficients of population and affluence irrelative to the factors chosen. Energy consumption technologies can be evaluated by the energy intensity of GDP, which is well recognized as the most important factor that contributes to CO2 emissions [44,45]. In China
and in this work, because we want to examine the effects of coal switching, energy efficiency improvement of electricity production and consumption on mitigating CO2 emissions, we chose coal
proportion in aggregate energy consumption, electricity intensity of GDP, coal intensity of thermal power generation and tertiary industry proportion in overall economy to regress the change of energy intensity in China.
The final models we used to reflect the long-term relationship among coal switching, energy efficiency improvement of electricity production and consumption can be expressed by
lnIc =a+blnP+clnGDP P/ +dlnEI+lne (6)
lnEI= f +glnFMc+hlnEIelec+ilnCIp+ jlnIS+lnk (7)
where Ic represents the amount of CO2 emissions, P represents the size of population, GDP/P represents
the gross domestic products per capita and is used to reflect people’ affluence in China, EI represents the energy intensity of GDP, FMc represents the coal proportion in aggregate energy consumption, EIelec
represents the electricity intensity of GDP and is used to reflect the electricity consumption efficiency, CIp represents the coal intensity of thermal power generation and is used reflect the energy efficiency of
electricity production, IS represents tertiary industries’ share in aggregate GDP, a and f are the model constants, e and k are the residual errors, and b, c, d, g, h, i, j are the coefficients that need to be forecasted. 3. Data Processing and Scenario Development
3.1. Data Collection
The historical period of the data is from 1980 to 2012, and the scenario period is from 2013 to 2040. The data on each kind of fuel consumption and coal intensity of thermal power generation were self-collected from China Energy Statistical Yearbook 1986, 1991, 1996, 1999, 2004–2013 [6–11]; data on amount of CO2 emissions were estimated by multiplying the CO2 emission factor [12] and
consumption of different kinds of fuels. The data on real GDP were processed by GDP value in 2012 multiplying its growth rate each year, and the energy intensity was calculated by real GDP dividing aggregate energy consumption in equivalent tons of coal, and the data on aggregate energy consumption
CO2 emissions
Energy Technologies
Fuel mix Economic Structure
unknow factors
were collected from China Statistical Yearbook 2013 [46], the same as the data on population, electricity consumption, proportion of coal in aggregate energy consumption, and share of the tertiary industry in aggregate GDP. The electricity intensity of GDP is calculated by dividing the aggregate electricity consumption by aggregate real GDP.
3.2. Data Processing 3.2.1. Unit Root Tests
In order to find the long-term equilibrium relationships among all the variables that appeared in Equations (6) and (7), it is necessary to test the stationary state of the time series before regressing, which is called a unit root test. Only if the unit root test results indicate that all the time series are stationary, which means the development of the series is independent of time, can the regressing results among the series be considered to be the long-term equilibrium relationship among all the variables. However, in real economy, the time series of most variables are not stationary. For non-stationary series, there is still the possibility of finding long-term equilibrium relationships among them. For this purpose, firstly, the unit root test should be used to find if the 1st differences of non-stationary series are stationary, that is, the series integrated in the same order 1, I(1); if this is true, then the cointegration test should be used to test if these series are cointergrated in the long run, and only if the cointegration test indicates there is at least one cointegrated equation existed among the variables can the regression be done.
Of all the unit root tests, ADF, DF-GLS and PP are the most commonly used methods to test the stationary state of a time series. The unit roots test was done by the EViews 7 software in this work. EViews series software is a commonly used econometrics tool for anyone working with time series, cross-sections, or longitudinal data. By using EViews, researchers can efficiently and easily manage their data, perform econometric and statistical analysis, generate forecasts or model simulations. The unit root test results for each of the variables are shown in Table 1. In that table, it can be seen that, under the DF-GLS and PP test scheme, the first differences of all the series tested as stationary. Although for the ADF test, neither the level of CI nor its first difference tested as stationary, but the DF-GLS and PP test results show that its first difference is stationary. Because each unit root test model has its own shortcomings and advantages for variables with different characteristics, it is difficult to say which one is superior and in our work we judge whether variables are stationary according to the results that most of the methods support, so we can still conclude that the first difference of CI tested as stationary. Thus, the unit root tests of this research show that the first differences of all the variables are stationary, that is, they are integrated of order 1, I(1).
3.2.2. Cointegration
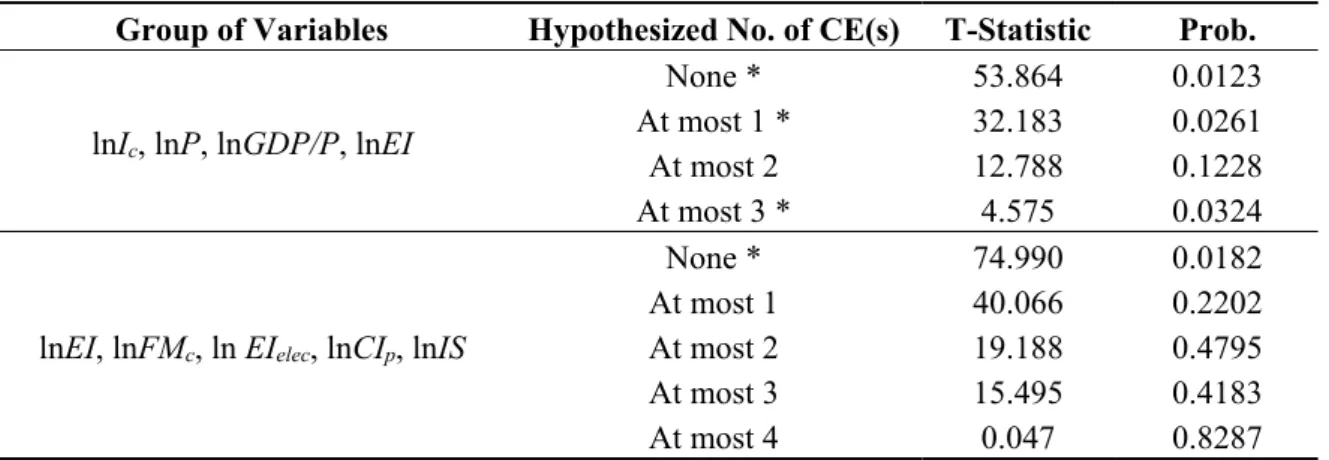
test results refuted the assumptions that there is no cointegration equation and at most 1 cointegration equation, but agreed with the assumptions that there are at most 2 cointegration equations among them. Thus, it can be inferred that lnIc, lnP, lnGDP/P and lnEI are cointegrated. Similarly, for the variables
lnEI, lnFMc, ln EIelec, lnCIp, and lnIS, the testing results imply that there is one cointegration equation
existing among them, so it can also be concluded that lnEI, lnFMc, ln EIelec, lnCIp, and lnIS, are cointegrated.
Table 1. Unit roots tests results.
Variables ADF DF-GLS PP
Level 1st Difference Level 1st Difference Level 1st Difference
lnIc 0.081 −2.801 * 0.030 −2.385 ** 0.686 −2.835 * lnP −2.245 −2.834 * 0.859 −2.665 ** −7.760 *** -
lnGDP/P 1.495 −3.453 ** 0.203 −1.968 ** 0.606 −3.362 **
lnEI −1.039 −3.103 ** 0.212 −2.955 *** −1.335 −1.612 * lnFMc −0.193 −4.404 *** −1.257 −2.218 ** −0.799 −4.520 *** lnEIelec −1.263 −3.598 ** −0.486 −3.203 *** −2.417 −2.445 **
lnCIp 4.187 0.570 0.123 −2.563 ** 3.959 −3.712 ** lnIS −2.129 −3.819 *** −0.015 −3.881 *** −2.462 −3.753 ***
* Statistical significance at the10% level; ** Statistical significance at the 5% level; *** Statistical significance at the 1% level.
Table 2. Cointergration tests results.
Group of Variables Hypothesized No. of CE(s) T-Statistic Prob.
lnIc,lnP, lnGDP/P, lnEI
None * 53.864 0.0123 At most 1 * 32.183 0.0261 At most 2 12.788 0.1228 At most 3 * 4.575 0.0324
lnEI,lnFMc, ln EIelec, lnCIp, lnIS
None * 74.990 0.0182 At most 1 40.066 0.2202 At most 2 19.188 0.4795 At most 3 15.495 0.4183 At most 4 0.047 0.8287
* Statistical significance at the10% level.
3.2.3. Estimation of the Long-Term Relationship
The unit root tests and the cointegration tests show that there is a long-term equilibrium relationship among the variables that we want to examine in this work, so we need to use some kind of estimators to regress the equations. The FMOLS (Fully Modified Least Squares) regression model was selected as the estimator of long-term relationships among the variables. Although OLS (Ordinary Least Square) estimators of the cointegrated vectors are super-convergent, their distributions are asymptotically biased and also exhibit small sample bias, while the FMOLS technique outperforms OLS in these regards [47]. The estimation was done with EViews 7, and the result for the long-term relationship among lnIc, lnP,
lnIc=0.548lnP+1.143lnGDP P/ +1.212lnEI
Adjusted R2 = 0.998, DW = 0.563 (8)
Although the high value of adjusted R2 shows that the actual curve is greatly fitted by the estimating
curve, the value of DW shows that the residual error series is positively auto-correlated; it is necessary to correct the autocorrelation of residual error series in order to get an accurate estimation of the long-term relationship, so we added the first lag of residual error into the model and the simulation result is
lnIc =0.542lnP+1.158lnGDP P/ +1.246lnEI
Adjusted R2 = 0.999, DW = 2.021 (9)
Equation (9) shows that after adding the first lag of residual error into the model, the fitting effect was slightly improved and the autocorrelation of residual error series is well eliminated, so Equation (9) can be used to reflect the long term relationship between lnIc, lnP, lnGDP/P and lnEI.
Similarly, the equation that used to reflect the long term relationship among lnEI, lnFMc, ln EIelec,
lnCIp and lnIS was obtained after adding both the first and second lag of residual errors and can be
expressed as
lnEI = −7.031 1.359ln+ FMc+1.051lnEIelec+1.549lnCIp−0.691lnIS
Adjusted R2 = 0.995, DW = 1.989 (10)
By substituting EI into Equation (9) from Equation (10), it can be seen the final equation that describes the long term relationship among lnIc, lnP, lnGDP/P, lnFMc, ln EIelec, lnCIp and lnIS should be
ln 8.758 0.542 ln 1.158ln / 1.7051ln
1.309 ln 1.9301ln 0.861ln
c c
elec p
I P GDP P FM
EI CI IS
= − + + +
+ + − (11)
4. Scenario Development
4.1. Elasticities
Equation (11) shows that the elasticities of P, GDP/P, FMc, EIelec, CIp and IS to CO2 emissions in
China are 0.542, 1.158, 1.705, 1.309, 1.930, −0.861, which means that among all the factors, increase in population, GDP per capita, coal proportion in aggregate energy consumption, electricity intensity of GDP and coal intensity of thermal power generation will result in positive growth of CO2 emissions,
while the increase in share of tertiary industry in aggregate GDP will reduce CO2 emissions. The
elasticities also show that the growth of CO2 emissions in China is more sensitive to the growth of GDP
per capita, proportion of coal in aggregate energy consumption, electricity intensity of GDP and coal intensity of thermal power generation, in which the role of coal intensity of thermal power generation ranks as the top one, followed by coal proportion in aggregate energy consumption, then the electricity intensity of GDP and finally the GDP per capita. The growth in population will also result in positive growth of CO2 emissions, but its effect is quite low compared with other factors. The increase in the
share of tertiary industry in aggregate GDP implies reduction in CO2 emissions, but the effect is rather
to improve energy efficiency of thermal power generation and electricity consumption as well as encouraging coal switching.
4.2. Features of the Scenarios
Based on the above analysis of elasticities of P, GDP/P, FMc, EIelec, CIp and IS to CO2 emissions,
five different scenarios were developed to track the CO2 emissions trend in China in 2013–2040, which
can be described as
Current scenario (C): In this scenario, the current energy savings and emissions reduction policy mechanisms will be the same as in previous years and China will not make greater efforts to improve the energy efficiency of electricity production and consumption and switch from coal consumption, so we assumed coal intensity of thermal power generation, electricity intensity of GDP, and the coal proportion in aggregate energy consumption will drop at the same rates as the average level throughout the period of 1980–2012, which were 1.38%, 1.00% and 0.215% annually.
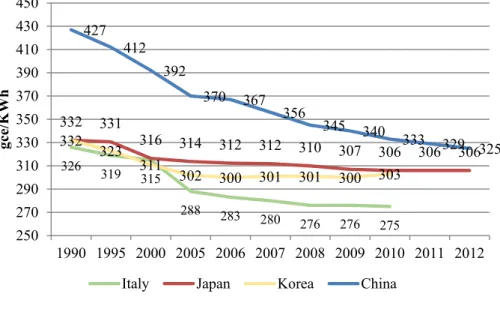
Low-coal scenario (S1): In this scenario, China will not make more efforts to improve the energy efficiency of electricity production and consumption, while in order to reduce overall carbon emissions, more policies will be enacted in order to substitute coal consumption with low carbon fuels, like renewable energies, nuclear power and biomass fuels or natural gas. In light of this, we firstly assumed in this scenario that the coal intensity of thermal power generation and electricity intensity of GDP will drop at the same pace as in the period of 1980–2012, which were 1.38% and 1.00%, while the decreasing rate of coal proportion in aggregate energy consumption will be accelerated to 2 times the historical level, which would be 0.215% during 1980–2012 and thus 0.43% in the future. Meanwhile, we slightly changed the developing trend of coal intensity of thermal power generation, because it was found that the coal efficiency of thermal power generation cannot always be improved substantially. Figure 4 shows the developing trend of coal intensity of thermal power generation for different countries in last few years, and it can be clearly seen that in the earlier years, an outstanding fall could be achieved for most of the countries, but the sharp decrease disappeared when a certain level of improvement was achieved (Japan was about 316, Korea 302 and Italy 275 g coal equivalent (gce)/KWh). According to this finding, we assumed that for China, when the coal intensity of thermal power generation reaches the level of Italy in 2010, about 275 g coal equivalent (gce)/KWh, the annual drop pace will decrease from 1.38% to 0.2%. Because in this scenario, it is assumed coal fuel is highly encouraged to be substituted by other low carbon energies, the coal share in overall primary energy consumption is assumed to drop by 2 times the average pace of the historical period, which will be 0.43% annually.
Coal-efficient thermal power generation scenario (S2): In this scenario, China will make more efforts to enact several policies to encourage or force thermal power generators to improve coal use efficiency and thus reduce the overall CO2 emissions due to compressed coal combination. At the same time, the
Electricity consumption-efficient scenario (S3): In this scenario, China will mainly resort to improving electricity consumption efficiency in order to achieve the CO2 mitigation goal, so the
reduction rate for coal intensity of thermal power generation and coal proportion in aggregate energy consumption will be the same as in 1980–2012, which was 0.215% and 1.38% annually, while the reduction pace of electricity intensity of GDP will be accelerated to 2 times the historical average level, 2.00% per year.
Integrated scenario (S4): In this scenario, China will make the same efforts to improve the energy efficiency of electricity production and consumption as well as to substitute final coal consumption with low carbon fuels. Consequently, we assumed that the decrease rate of electricity intensity of GDP, coal intensity of thermal power generation and coal proportion in aggregate energy consumption would be the same and all of them would be 1.19%, which was the historical average developing level of both coal intensity of thermal power generation and electricity intensity of GDP. That means for the coal proportion in aggregate energy consumption, the decrease rate will increase at 5.5 times the average pace in 1980–2015, the decrease rate of electricity intensity of GDP will increase slightly and the decrease rate of coal intensity of thermal power generation will slow down slightly. The same treatment was still conducted for coal intensity of thermal power generation when the level of 275 gce/KWh is achieved.
Figure 4. Coal intensity of thermal power generation for several countries.
For all the scenarios, the growth of population and GDP were assumed according to the IEA forecasting results for China [48], and the growth of share of tertiary industry in GDP was assumed based on the forecast by Jiang [49], which can also be seen in Table 3.
Table 3. Assumption for growth of population, GDP per capita and tertiary industrial proportion in GDP.
Variables Periods
2013–2020 2020–2030 2030–2040
P 0.4% 0.329% 0.244%
GDP/P 6.9% 5.3% 3.2%
IS 0.87% 1.21% 1.13%
326
319 315
288 283
280 276 276 275
332 331
316 314 312 312 310
307 306 306 306 332
323 311
302 300 301 301 300 303 427 412 392 370 367 356 345 340 333 329 325 250 270 290 310 330 350 370 390 410 430 450
1990 1995 2000 2005 2006 2007 2008 2009 2010 2011 2012
gce/KWh
5. Results Analysis
5.1. Simulation Results Analysis
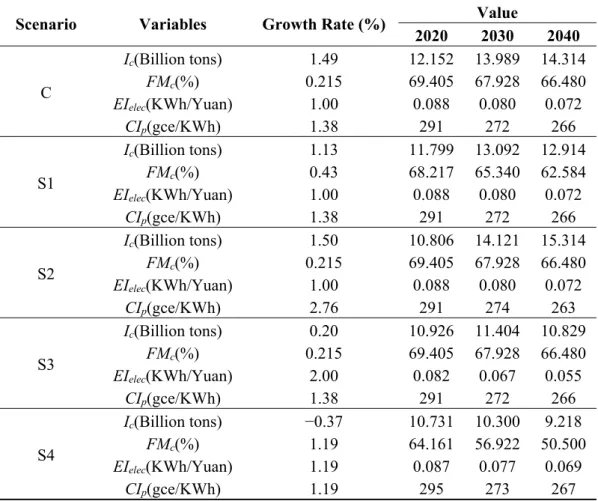
The main growth rates and values of variables in C, S1, S2, S3 and S4 are shown in Table 4 and the final simulated trends of CO2 emissions are shown in Figure 5.
Figure 5. The overall CO2 emissions in China projected for different scenarios.
Table 4. The results of the main variables in different scenarios.
Scenario Variables Growth Rate (%) Value
2020 2030 2040
C
Ic(Billion tons) 1.49 12.152 13.989 14.314
FMc(%) 0.215 69.405 67.928 66.480
EIelec(KWh/Yuan) 1.00 0.088 0.080 0.072
CIp(gce/KWh) 1.38 291 272 266
S1
Ic(Billion tons) 1.13 11.799 13.092 12.914
FMc(%) 0.43 68.217 65.340 62.584
EIelec(KWh/Yuan) 1.00 0.088 0.080 0.072
CIp(gce/KWh) 1.38 291 272 266
S2
Ic(Billion tons) 1.50 10.806 14.121 15.314
FMc(%) 0.215 69.405 67.928 66.480
EIelec(KWh/Yuan) 1.00 0.088 0.080 0.072
CIp(gce/KWh) 2.76 291 274 263
S3
Ic(Billion tons) 0.20 10.926 11.404 10.829
FMc(%) 0.215 69.405 67.928 66.480
EIelec(KWh/Yuan) 2.00 0.082 0.067 0.055
CIp(gce/KWh) 1.38 291 272 266
S4
Ic(Billion tons) −0.37 10.731 10.300 9.218
FMc(%) 1.19 64.161 56.922 50.500
EIelec(KWh/Yuan) 1.19 0.087 0.077 0.069
CIp(gce/KWh) 1.19 295 273 267
8 9 10 11 12 13 14 15 16 17
2013 2014 2015 2016 2017 2018 2019 2020 2021 2022 2023 2024 2025 2026 2027 2028 2029 2030 2031 2032 2033 2034 2035 2036 2037 2038 2039 2040
CO2
emissions (Billion tons)
C: Figure 5 indicates that except S4, the CO2 emissions of all the other scenarios will increase
compared to the level in 2012, and the growth of C is the fastest, which will increase to nearly 16 billion tons in 2040, an increase of 48.27%. The CO2 emissions peak level of scenario C is 15.753
billion tons, which will be reached in 2038 (Figure 5), and this implies that if China does not change its current carbon mitigation policies, the CO2 mitigation commitment goal for 2030 cannot be achieved.
S1: As the results of S1 show, the CO2 emissions will reach over 14 billion tons in S1 by the end of
2040, which is higher than the level in 2012 by 33.76%. The peak CO2 emissions will be reached in
2037 (Figure 5), a total of about 14.338 billion tons, about 9% lower than the peak level in scenario C. The results of S1 imply that, although encouraging extensive coal switching cannot cause peak CO2
emissions to come earlier, it is very helpful in reducing the overall amount of CO2 emissions.
S2: The CO2 emissions of S2 will reach over 15 billion tons in 2040, an increase of 44.54% comparing
with the level in 2012. The peak level will be reached in 2038 (Figure 5), which is the same as in scenario C and later than scenario S1. The peak level is 15.257 billion tons, slightly lower than the peak level in scenario C and much higher than scenario S1.
S3: The fast improvement of electricity intensity of GDP in S3 will help China to achieve the peak CO2 emissions level of 11.512 billion in 2032, which is much earlier than in scenarios C, S1 and S2, but
still cannot meet the commitment requirement. The peak CO2 emissions level in S3 is 26.92%, 19.71%
and 24.55% less than the peak levels in scenarios C, S1 and S2, respectively. The simulation results of S3 show that intensively reducing electricity intensity of GDP can greatly speed up the coming year of peak CO2 emissions and can also reduce the total amount of CO2 emissions in China.
S4: The integrated improvements in coal efficiency of thermal power generation and electricity efficiency of economic activities and coal switching in S4 reduce the CO2 emissions substantially in
2013–2040, a bit more than 9.0 billion tons in 2040, reduced by 41.32%, 34.95%, 39.81% and 14.88% compared with the levels in C, S1, S2 and S3 in 2040, respectively. The peak level of CO2 emissions in
S4 is 10.73 million tons, which is far less than the peak levels in C, S1, S2 and S3. The peak time is 2020, which is much earlier than in scenarios C, S1, S2 and S3. The results in S3 and S4 show that by cooperatively improving the electricity efficiency of economic activities and substituting coal consumption can effectively help China to achieve the CO2 emissions mitigate commitment.
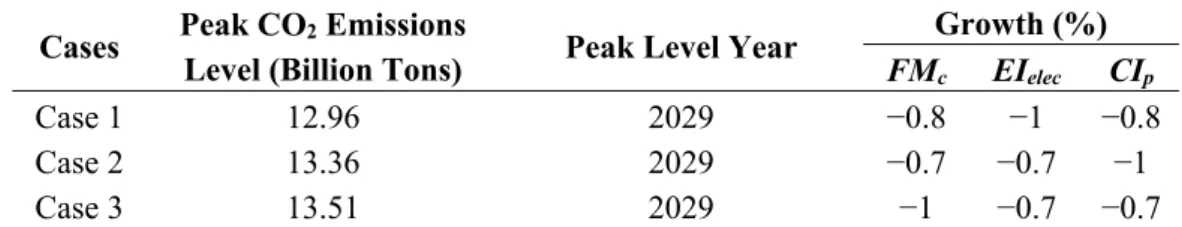
However, because the peak year 2020 is too much earlier than commitment year 2030, we need to try to modify the decreasing rates of the defined three variables in S4 step by step in order to find a new peak year which is much closer to 2030, since heavy regulation on CO2 emissions always means a loss
of economic growth. We found that after the decreasing rates of all the three variables drop to less than 1% per year, the peak year will suddenly jump from 2023 to 2032, so we kept on trying by slowing down the decrease rates of two of the three variables, and keeping the decrease rate of the other at 1%. As a result, we found four cases with different values of the three variables in which the peak CO2 emissions
years were very close to the committed peak year of 2030 (Table 5). As Table 5 shows, although the peak level years of Case 1, Case 2 and Case 4 were very similar, the peak CO2 emissions levels were
Table 5. Different cases that can meet the commitment peak year requirement.
Cases Peak CO2 Emissions
Level (Billion Tons) Peak Level Year
Growth (%)
FMc EIelec CIp
Case 1 12.96 2029 −0.8 −1 −0.8
Case 2 13.36 2029 −0.7 −0.7 −1
Case 3 13.51 2029 −1 −0.7 −0.7
5.2. Policy Implications
Substituting coal consumption with low-carbon fuels: The results in Case 1 show that China should at least reduce the coal proportion in aggregate energy consumption by 0.8% per year, and this will reduce the coal proportion in aggregate energy consumption by 56.39% in 2040. This reduction pace is much quicker than the historical average level, and that means China should make more efforts in encouraging the consumption of non-coal energies. Actually, China has the potential to increase the share of low-carbon fuels in overall energy consumption. Figure 6 shows the historical development of non-coal fuels’ proportion of overall energy consumption in China, it can be clearly seen that the proportions of low-carbon fuels, like nuclear energy and renewable energy, are rather low in China, especially wind, solar and nuclear power. There is a great deal of room for the substitution of renewable energy for coal.
Figure 6. Non-coal proportion in aggregate energy consumption in China from 1980 to 2012.
Improving the coal efficiency of thermal power generation: The results of Case 1 also show that China should keep on improving the coal efficiency of thermal power generation. Although as Figure 4 shows, the coal intensity of thermal power generation was greatly improved in 1990–2012, which decreased by 23.89% at the end of 2012, the level was still much higher than other developed regions. The coal intensity of China’s thermal power generation was 325 gce/KWh in 2012, nearly the same level as Japan in 1995, Korea in 1995, and Italy in 1990 [6–11]. Therefore, China should keep on improving the coal
-5.0 0.0 5.0 10.0 15.0 20.0 25.0
%
Petroleum Natural gas
Hydropower Nuclear power
efficiency of thermal power generation; however, given that the pace of coal switching will be accelerated greatly, the pace can be slowed down. This gives the policy makers more opportunity.
Improving electricity efficiency of economic activities: The results of Case 1 show that the electricity efficiency of economic activities should at least keep the same improvement pace as the historical level so as to achieve the commitment CO2 emissions mitigation goal in 2030. Although China’s electricity
efficiency of economic activities greatly improved in 1980–2012, decreasing from 0.121 KWh/Yuan in 1980 to 0.095 KWh/Yuan 2012, by 20.74%, when compared with the world average level, or the OECD countries’ average level or even the non-OECD countries’ average level, the level of China’s electricity intensity of GDP is much higher than other countries (Figure 7). This means the electricity efficiency of China’s economic activities is very low, so the government should exert even more efforts to encourage improvements in electricity consumption efficiency.
Figure 7. World electricity intensity of GDP in 2011 [11]. 6. Conclusions
As the largest CO2 emissions producer in the world, China has the responsibility to mitigate CO2
emissions to slow down global warming. This work deals with the problem of what China can do to achieve the CO2 emissions mitigation commitment by 2030, and the research results indicate that the
change in China’s CO2 emissions greatly depends on how much coal accounts for overall energy
consumption, how efficient the coal used for thermal power generation is, and how efficiently electricity is used for economic activities. Therefore, in the future, China should at least do the following three kinds of works in order to achieve the CO2 emissions mitigation goal in 2030: intensively substitute coal
fuels with low-carbon fuels, like renewable energy, nuclear power, biomass fuels or natural gas; continue improving the coal efficiency of thermal power generation at a slower pace; and increase the electricity efficiency of economic activities as usual.
Although these findings are quite useful for policy makers to make decisions, there are still some points missing in this work and we continue researching them in the future. The policy implications cannot provide more instructive suggestions for the government to specifically regulate the development
0.39
0.27
0.72
1.06
0 0.2 0.4 0.6 0.8 1 1.2
World OECD Total NON-OECD Total China
(kW•
h
of nuclear energy and renewable energy. Since, in our STIRPAT model, the regression results show that there are no econometrical long-term relationships between the shares of nuclear energy or renewable energy in overall energy consumption and CO2 emissions, which may be due to their very small size, we
cannot simulate their future effects on CO2 emissions in our model. Consequently, if we want to precisely
identify the effects of developing nuclear energy and renewable energy in contributing to CO2 emissions
mitigation, we need to use other research methods to achieve greater insight; these are the main research areas for our future work. Furthermore, for the coal intensity of thermal power generation, in this work we only wanted to examine its overall and long-term performance on the environmental side, so we did not add too much technical analysis, which is another main research point in our future work.
Acknowledgments
This work was financially supported by the National Natural Science Foundation of China (71403030, 71401054) and the Beijing Philosophy and Social Science Fund (13JGC074, 14JGC108).
Author Contributions
Li Li mainly constructed the work, designed the scenarios and analyzed the results; Jianjun Wang was mainly responsible for the model construction and calculation.
Conflicts of Interest
The authors declare no conflict of interest. References
1. IEA. CO2 Emissions from Fuel Combustion Highlights 2014. Available online
http://www.iea.org/publications/freepublications/publication/co2-emissions-from-fuel-combustion-highlights-2014.html (accessed on 19 February 2015).
2. Chandran Govindaraju, V.G.R.; Chor, F.T. The dynamic links between CO2 emissions, economic
growth and coal consumption in China and India. Appl. Energy 2013, 104, 310–318.
3. Harry, B.; Shuddhasattwa, R.; Ruhul, S. Coal consumption, CO2 emission and economic growth in
China: Empirical evidence and policy responses. Energy Econ. 2012, 34, 518–528.
4. Xu, Y.; Yang, C.J.; Xuan, X.W. Engineering and optimization approaches to enhance the thermal efficiency of coal electricity generation in China. Energy Policy 2013, 60, 356–363.
5. Cai, W.J.; Wang, C.; Wang, K.; Zhang, Y.; Chen, J.N. Scenario analysis on CO2 emissions reduction
potential in China’s electricity sector. Energy Policy 2007, 35, 6445–6456.
6. DES-NBSC (Department of Energy Statistics, National Bureau of Statistics, China). China Energy Statistical Yearbook, 1986; China Statistical Press: Beijing, China, 1987.
7. DES-NBSC (Department of Energy Statistics, National Bureau of Statistics, China). China Energy Statistical Yearbook, 1988; China Statistical Press: Beijing, China, 1989.
9. DES-NBSC (Department of Energy Statistics, National Bureau of Statistics, China). China Energy Statistical Yearbook, 1996; China Statistical Press: Beijing, China, 1997.
10. DES-NBSC (Department of Energy Statistics, National Bureau of Statistics, China). China Energy Statistical Yearbook, 1999; China Statistical Press: Beijing, China, 2000.
11. DES-NBSC (Department of Energy Statistics, National Bureau of Statistics, China). China Energy Statistical Yearbook, 2004–2013; China Statistical Press: Beijing, China, 2005–2014.
12. Wang, J.J.; Li, L. Empirical Analysis on Relation between Electricity Consumption and Carbon Emission Based on Stochastic Impacts by Regression on Population, Affluence and Technology Model. Power Syst. Technol. 2014, 38, 628–632.
13. Özbuğday, F.C.; Erbas, B.C. How effective are energy efficiency and renewable energy in curbing CO2 emissions in the long run? A heterogeneous panel data analysis. Energy 2015, 82, 734–745.
14. Jorge, R.; Claudia, S.; David, M. The structure of household energy consumption and related CO2
emissions by income group in Mexico. Energy Sustain. Dev. 2010, 14, 127–133.
15. Luciano, C.F.; Shinji, K. Decomposition of CO2 emissions change from energy consumption in
Brazil: Challenges and policy implications. Energy Policy 2011, 39, 1495–1504.
16. Geng, Y.; Zhao, H.Y.; Liu, Z.; Xue, B.; Fujita, T.; Xi, F.M. Exploring driving factors of energy-related CO2 emissions in Chinese provinces: A case of Liaoning. Energy Policy 2013, 60,
820–826.
17. Yuan, B.L.; Ren, S.G.; Chen, X.H. The effects of urbanization, consumption ratio and consumption structure on residential indirect CO2 emissions in China: A regional comparative analysis.
Appl. Energy 2015, 140, 94–106.
18. Ouyang, X.L.; Lin, B.Q. An analysis of the driving forces of energy-related carbon dioxide emissions in China’s industrial sector. Renew. Sustain. Energy Rev. 2015, 45, 838–849.
19. Wang, P.; Wu, W.S.; Zhu, B.Z.; Wei, Y.M. Examining the impact factors of energy-related CO2
emissions using the STIRPAT model in Guangdong Province, China. Appl. Energy 2013, 106, 65–71.
20. Wang, Y.N.; Zhao, T. Impacts of energy-related CO2 emissions: Evidence from under developed,
developing and highly developed regions in China. Ecol. Indic. 2015, 50, 186–195.
21. Lin, B.; Du, K. Energy and CO2 emissions performance in China’s regional economies: Do market-oriented reforms matter? Energy Policy 2015, 78, 113–124.
22. Sunil, M. CO2 emissions from electricity generation in seven Asia-Pacific and North American
countries: A decomposition analysis. Energy Policy 2009, 37, 1–9.
23. Robert, H.; Wina, G. How much CO2 emissions do we reduce by saving electricity? A focus on
methods. Energy Policy 2013, 60, 803–812.
24. Betül, Ö.; Erdem, G.; Selahattin, İ. The scenario analysis on CO2 emission mitigation potential in
the Turkish electricity sector: 2006–2030. Energy 2013, 49, 395–403.
25. Damien, C.; Toshko, Z. Emissions targeting and planning: An application of CO2 emissions pinch
analysis (CEPA) to the Irish electricity generation sector, Energy 2008, 33, 1498–1507.
26. Aparna, D.; Saikat, K.P. CO2 emissions from household consumption in India between 1993–94
and 2006–07: A decomposition analysis, Energy Econ. 2015, 41, 90–105.
28. Zhang, M.; Liu, X.; Wang, W.W.; Zhou, M. Decomposition analysis of CO2 emissions from
electricity generation in China, Energy Policy 2013, 52, 159–165.
29. Sahbi, F.; Muhammad, S. What role of renewable and non-renewable electricity consumption and output is needed to initially mitigate CO2 emissions in MENA region? Renew. Sustain. Energy Rev.
2014, 40, 80–90.
30. Odenberger, M.; Johnsson, F. Achieving 60% CO2 reductions within the UK energy
system—Implications for the electricity generation sector. Energy Policy 2007, 35, 2433–2452. 31. Yin, J.H.; Zheng, M.Z.; Chen, J. The effects of environmental regulation and technical progress on
CO2 Kuznets curve: An evidence from China. Energy Policy 2015, 77, 97–108.
32. Chikaraishi, M.; Fujiwara, A.; Kaneko, S.; Poumanyvong, P.; Komatsu, S.; Kalugin, A. The moderating effects of urbanization on carbon dioxide emissions: A latent class modeling approach. Technol. Forecast. Soc. Chang. 2015, 90, 302–317.
33. Rogan, F.; Cahill, C.J.; Daly, H.E.; Dineen, D.; Deane, J.P.; Heaps, C.; Welsch, M.; Howells, M.; Bazilian, M.; Gallachóir, B.P.Ó. LEAPs and Bounds—An Energy Demand and Constraint Optimized Model of the Irish Energy System. Energy Effic.2014, 7, 441–446.
34. Feng, Y.Y.; Chen, S.Q.; Zhang, L.X. System dynamics modeling for urban energy consumption and CO2 emissions: A case study of Beijing, China. Ecol. Model. 2013, 252, 44–52.
35. Andrés, R.L.; Ángel, M.N.; José-Enrique, G.R.; Antonio, A.G. Studying the relationship between economic growth, CO2 emissions, and the environmental Kuznets curve in Venezuela (1980–2025).
Renew. Sustain. Energy Rev. 2015, 41, 602–614.
36. Ehrlich, P.; Holdren, J. The impact of population growth. Science 1971, 171, 1212–1217.
37. Dietz, T.; Rosa, E. Effects of population and affluence on CO2 emissions. Proc. Natl. Acad. Sci. USA
1997, 94, 175–179.
38. Li, H.N.; Mu, H.L.; Zhang, M.; Gui, S.S. Analysis of regional difference on impact factors of China’s energy—Related CO2 emissions. Energy 2012, 39, 319–326.
39. Wang, Y.N.; Zhao, T. Impacts of energy-related CO2 emissions: Evidence from under developed,
developing and highly developed regions in China. Ecol. Indic. 2015, 50, 186–195.
40. Salim, R.A.; Shafiei, S. Urbanization and renewable and non-renewable energy consumption in OECD countries: An empirical analysis, Econ. Model. 2014, 38, 581–591.
41. Shafiei, S.; Salim, R.A. Non-renewable and renewable energy consumption and CO2 emissions in
OECD countries: A comparative analysis. Energy Policy 2013, 66, 547–556.
42. Meng, M.; Niu, D.X.; Shang, W. CO2 emissions and economic development: China’s 12th
five-year plan. Energy Policy, 2012, 42, 468–475.
43. Li, H.N.; Mu, H.L.; Zhang, M.; Li, N. Analysis on influence factors of China’s CO2 emissions based
on Path–STIRPAT model. Energy Policy 2011, 39, 6906–6911.
44. Tan, Z.F.; Li, L.; Wang, J.J.; Wang, J.H. Examining the driving forces for improving China’s CO2
emission intensity using the decomposing method. Appl. Energy 2011, 88, 4496–4504.
45. Xu, J.H.; Fan, Y.; Yu, S.M. Energy conservation and CO2 emission reduction in China’s 11th
Five-Year Plan: A performance evaluation. Energy Econ. 2014, 46, 348–359.
47. Phillips, P.C.B.; Moon H.R. Linear regression limit theory for nonstationary panel data. Econometrica 1999, 67, 1057–1112.
48. IEA. World Energy Outlook 2014. Available online: http://www.worldenergyoutlook.org/ publications/weo-2014/ (accessed on 30 March 2015).
49. Jiang, K.J.; Hu, X.L.; Zhuang, X.; Liu, Q. The 2050 low carbon scenario of China and low carbon developing path, Sino-Glob. Energy 2009, 14, 1–7.

![Figure 7. World electricity intensity of GDP in 2011 [11].](https://thumb-ap.123doks.com/thumbv2/123deta/6871024.246506/16.892.200.701.426.729/figure-world-electricity-intensity-gdp.webp)
