Development of concepts for expanding the
use of no-tillage farming in organic
agriculture
2016.3
United Graduate School of Agricultural Science Tokyo University of Agriculture and Technology
I Omnium autem rerum,
ex quibus aliquid acquiritur, nihil est agricultura melius,
nihil uberius, nihil dulcius, nihil homine libero dignius.
Abstract
cereal grains to enhance the weed suppression and the total grain yield, (v) to investigate if autumn seeding compared to spring seeding of grain legumes can enhance the weed competition of legume cash crops, (vi) to determine if the transition to the no-till system can be alternatively realised through no-till seeding of legume cover crops or if tillage is needed for sufficient weed suppression and cover crop production.
The non-legume cover crop biomass production ranged from 0.95 to 7.73 Mg ha-1, with fertiliser increasing the total biomass at locations with low N status. Sunflower consistently displayed large biomass and N accumulation at all locations and fertiliser variations, although not always significantly more than other species. Most shoot-N was stored in sunflower leaf material, which can be easily mineralised making it less suited as cover crop before no-till sown spring grain legumes. Rye, which produced slightly less biomass, but accumulated more N in the stem biomass, would be better suited than sunflower in this type of system. The N mineralisation simulation from rye biomass indicated long N immobilisation periods potentially improving weed suppression within no-till sown legume cash crops.
The legume cash crop winter field pea (normal leafed variety), displayed in the no-till system grain yields of up to 3.39 Mg ha-1 which was similar to the plough tillage system. For spring faba bean and field pea the yield in the reduced tillage system amounted to 2.92 and 3.29 Mg ha-1, respectively which was similar to the plough tillage system, but did not exceed 2.15 Mg ha-1 in the no-tillage system. Narrow-leafed lupin consistently displayed yields below 0.65 Mg ha-1 in the no-tillage system. Normal leafed winter field pea appeared to be best suited for the transition period to an organic no-tillage system due to the autumn seeding and its high competitive ability. Spring faba bean and field pea can be successfully grown in the reduced tillage system. Intercropping can increase the total grain yield and weed competition as long as sufficient soil nitrogen resources are plant available.
The no-tillage sown monocropped and intercropped legume cover crop total shoot dry matter, shoot N accumulation and N2 fixation differed with year, location, tillage system and
species due to variations in weather, inorganic soil N resources and weed competition. Biomass production reached up to 1.65 and 2.19 Mg ha-1 (both intercropped field peas), and N2 fixation up to 53.7 and 60.5 kg ha-1 (both common vetches) in the no-till and reduced
Abbreviations
a.s.l above sea level
BO Bockelwitz (trial location)
cv. cultivar
C Carbon
DM dry matter
DWD Deutscher Wetterdienst (German Meteorological Service)
GR Groß Radisch (trial location)
IC intercropped
KÖ Köllitsch (trial location)
LfULG Sächsisches Landesamt für Umwelt, Landwirtschaft und Geologie (Saxon State Office for Environment, Agriculture and Geology)
MC monocropped
N Nitrogen
PI Pillnitz (trial location)
RG Reinhardtsgrimma (trial location)
Contents
Abstract ... I Abbreviations ... IV Contents ... V
List of figures………...…VIII
List of tables………XI
1. Chapter: Introduction ... 1
1.1 No-till seeding in organic farming ... 1
1.2 Strategies for the implementation of no-tillage practices in organic agriculture ... 2
1.3 Characteristics of cover crop materials ... 2
1.4 Advancements in seeding technology ... 4
1.5 Timing of legume cash crop seeding and use of intercrops ... 4
1.6 No-till sown legume cover crops ... 5
1.7 General objectives and thesis layout ... 6
2. Chapter: The Suitability of Non-legume Cover Crops for Inorganic Soil Nitrogen Immobilisation in the Transition Period to an Organic No-till System ... 8
2.1 Introduction ... 8
2.2 Materials and Methods ... 9
2.2.1 Experimental study site and field trial setup ... 9
2.2.2 Sample collection and analysis ... 10
2.2.3 Statistical Analyses ... 12
2.2.4 Simulation of N mineralisation ... 13
2.3 Results ... 18
2.3.1 Climate ... 18
2.3.2 Cover crop emergence ... 18
2.3.3 Dry matter production ... 20
2.3.4 Shoot N accumulation and inorganic soil N ... 21
2.3.5 C : N ratio in stem and leaf material ... 25
2.3.6 Simulated N mineralisation from cover crop residues ... 26
2.4 Discussion... 33
2.4.1 Dry matter production ... 33
2.4.2 Evaluation of cover crops for N immobilisation in no-till systems based on N mineralisation after conventional tillage ... 38
3. Chapter: Short-term Effects of Differentiated Tillage on Dry Matter Production and Grain Yield of Autumn and Spring Sown Grain Legumes Grown
Mono-cropped and InterMono-cropped with Cereal Grains in Organic Farming ... 40
3.1 Introduction ... 40
3.2 Material and methods ... 41
3.2.1 Experimental study site ... 41
3.2.2 Field trial setup ... 42
3.2.3 Sampling and measurement ... 44
3.2.4 Statistical Analyses ... 47
3.3 Results ... 48
3.3.1 Crop establishment ... 48
3.3.2 Soil temperature ... 50
3.3.3 Shoot dry matter production ... 50
3.3.4 Grain yield ... 54
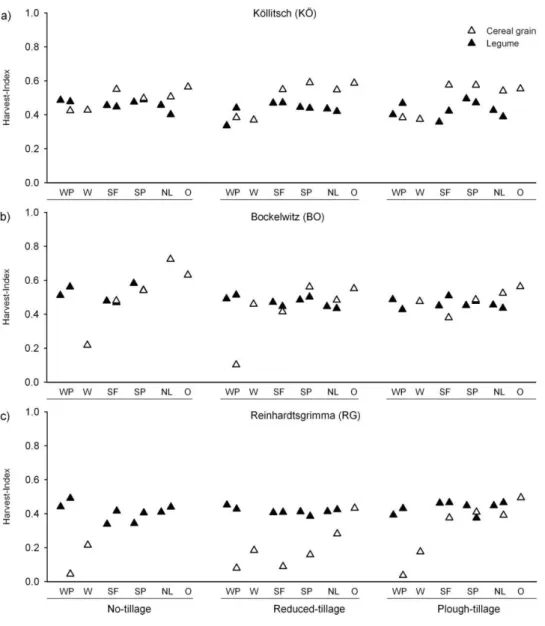
3.3.5 Harvest index ... 56
3.4 Discussion... 59
3.4.1 Crop establishment and overwintering ... 59
3.4.2 Crop biomass production and weed suppression ... 60
3.4.3 Grain yield and harvest index ... 62
3.5 Conclusion ... 64
4. Chapter: Evaluation of monocropped and intercropped grain legumes for cover cropping in no-tillage and reduced tillage organic agriculture ... 65
4.1 Introduction ... 65
4.2 Material and methods ... 66
4.2.1 Experimental sites and setup ... 66
4.2.2 Sample collection and analysis ... 68
4.2.3 Statistical analyses ... 70
4.3 Results ... 71
4.3.1 Weather conditions ... 71
4.3.2 Cover crop emergence ... 71
4.3.3 Cover crop shoot and weed dry matter production ... 73
4.3.4 Cover crop shoot N accumulation ... 80
4.3.5 N2 fixation ... 83
4.4 Discussion... 85
4.4.1 Crop establishment ... 85
4.4.2 Evaluation of cover crop species ... 85
4.4.3 Influence of available inorganic soil N level and weather conditions ... 87
4.5 Conclusion ... 88
5. Chapter: General discussion ... 90
5.1 Introduction ... 90
5.3 Grain production of autumn and spring sown legume cash crop monocropped and
intercropped with cereal grains after variable tillage ... 92
5.4 Legume cover crop biomass production and weed suppression in systems with reduced and without tillage ... 94
5.5 Conclusion ... 96
5.6 Further research ... 97
References ... 98
Appendix ... 111
List of Figures
Fig. 2.1. Conceptual diagram of the residue decomposition model (Nicolardot et al. 2001), continuous lines indicating C fluxes, dashed lines indicating N fluxes. ... 14 Fig. 2.2a-b. Comparison of proportionate net N mineralisation in no-till (a) and tilled
conditions (b) from immature crop residues with fixed dry matter (1 Mg ha-1) and C content (40%) as well as variable C : N ratios (8 to 20 : 1). ... 16 Fig. 2.3a-c. Total dry matter (DM) partitioned into cover crop stem and leaf material, as
well as weed biomass in plots of rye (R), oats (O), sunflower (S), mustard (M), buckwheat (B), hemp (H) and no cover crop – weeds (W), respectively. The cover crop and weed dry matter was produced without fertiliser (left side
columns) and with 50 kg N ha-1 fertiliser (right side columns), respectively. ... 20 Fig. 2.4a-c. Inorganic soil N at seeding (SN) and after harvest in plots of rye (R), oats (O),
sunflower (S), mustard (M), buckwheat (B), hemp (H), no cover crop – weed plot (W) and bare soil fallow (F), respectively. Shoot N accumulation of the respective cover crops partitioned into stem and leaf material as well as weed shoot N accumulation. Shoot N accumulation without fertiliser (left side
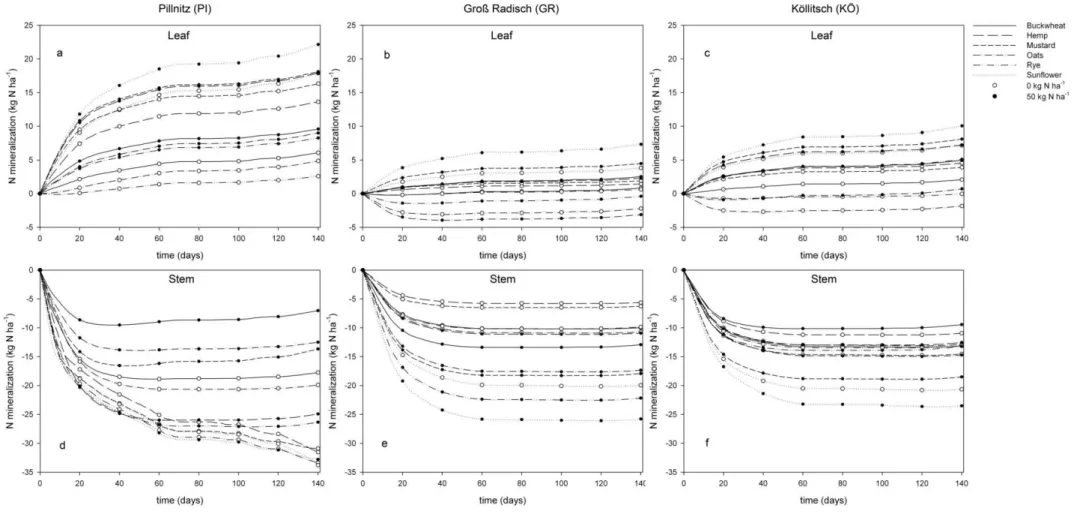
columns) and with 50 kg N ha-1 fertiliser (right side columns), respectively. ... 23 Fig. 2.5a-f. Proportionate net N mineralisation of separate cover crop leaf material (a-c)
and stem material (d-f) at the Pillnitz (PI), Groß Radisch (GR) and Köllitsch (KÖ) location. ... 28 Fig. 2.6a-f. Net N mineralisation of separate cover crop leaf material (a-c) and stem
material (d-f) at the Pillnitz (PI), Groß Radisch (GR) and Köllitsch (KÖ)
location. ... 31 Fig. 2.7a-f. Proportionate net N mineralisation (a-c) and net N mineralisation (d-f) of
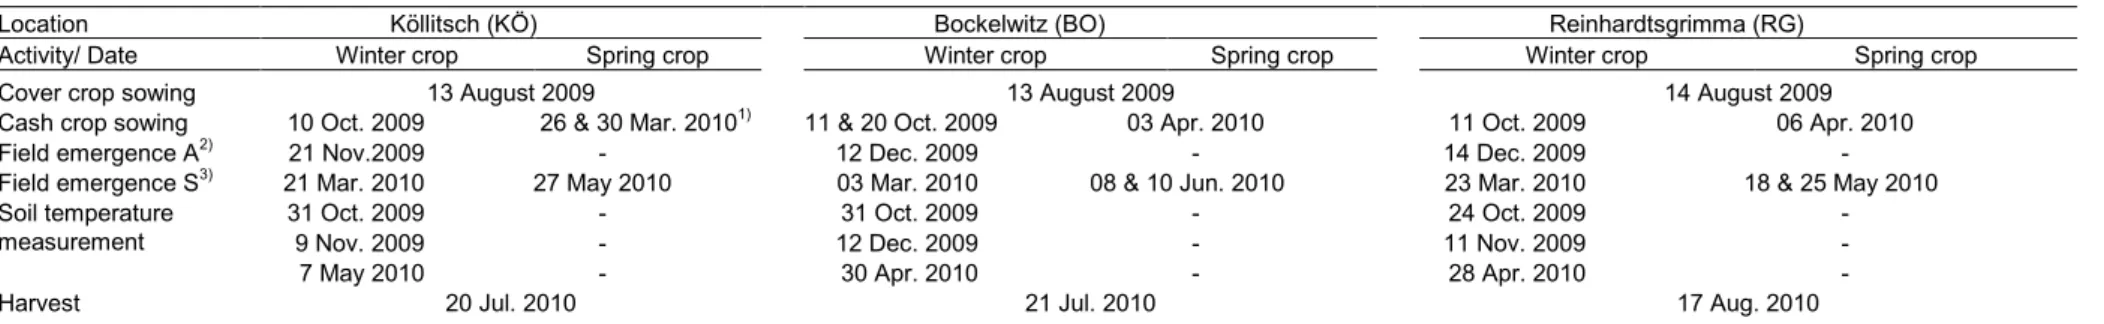
combined cover crop leaf and stem material at the Pillnitz (PI), Groß Radisch (GR) and Köllitsch (KÖ) location. ... 32 Fig. 3.1a-b. Monthly mean temperatures and precipitation from August 2009 to August
2010 in Köllitsch (KÖ), Bockelwitz (BO) and Reinhardtsgrimma (RG). ... 43 Fig. 3.2. Daily mean temperatures from 1 January to 31 March 2010 at Köllitsch (KÖ),
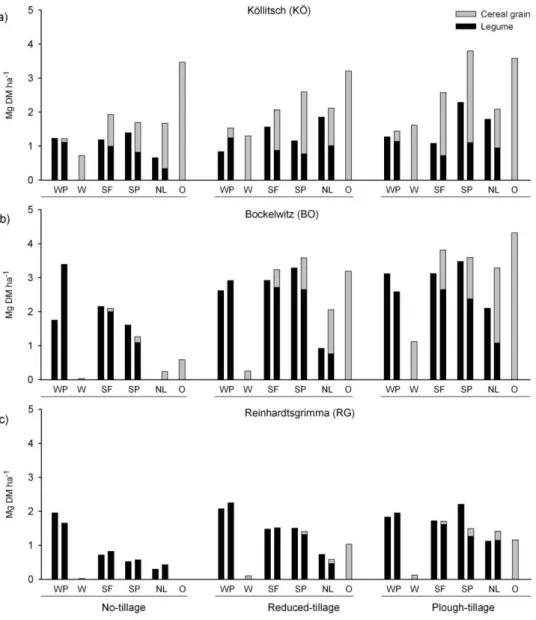
Fig. 3.3a-c. Shoot dry matter (DM) production of legume and cereal grain. Each column pair represents monocropped (left) and intercropped (right) plant stands of winter field pea (WP), spring faba bean (SF), spring field pea (SP), and narrow-leafed lupin (NL), respectively. The single columns represent monocropped plant stands of winter wheat (W) and oats (O). ... 52 Fig. 3.4a-c. Shoot dry matter (DM) production of weeds. Each column pair represents the
weed dry matter production in plots of monocropped (left) and intercropped (right) plant stands of winter field pea (WP), spring faba bean (SF), spring field pea (SP), and narrow-leafed lupin (NL), respectively. The single columns represent the weed dry matter production in monocropped plant stands of
winter wheat (W) and oats (O). ... 55 Fig. 3.5a-c. Grain yield of legumes and cereal grains. Each column pair represents
monocropped (left) and intercropped (right) plant stands of winter field pea (WP), spring faba bean (SF), spring field pea (SP), and narrow-leafed lupin (NL), respectively. The single columns represent monocropped plant stands of winter wheat (W) and oats (O). ... 57 Fig. 3.6a-c. Harvest index of legumes and cereal grains. Each column pair represents
monocropped (left) and intercropped (right) plant stands of winter field pea (WP), spring faba bean (SF), spring field pea (SP), and narrow-leafed lupin (NL), respectively. The single columns represent monocropped plant stands of winter wheat (W) and oats (O). ... 58 Fig. 4.1. Shoot dry matter (DM) of legumes and sunflowers at harvest I. Each column pair
represents monocropped (left) and intercropped (right) plant stands of faba bean (FB), field pea (FP), narrow-leafed lupin (NL), grass pea (GP), and common vetch (CV), respectively. The single column represents monocropped plant
stands of sunflower (S).. ... 77 Fig. 4.2. Shoot dry matter (DM) of legumes and sunflowers at harvest II. Each column pair
represents monocropped (left) and intercropped (right) plant stands of faba bean (FB), field pea (FP), narrow-leafed lupin (NL), grass pea (GP), and common vetch (CV), respectively. The single column represents monocropped plant
Fig. 4.3. Inorganic soil N at seeding, after harvest II, and shoot N accumulation of legumes and sunflower at harvest II. The first column pair represents the inorganic soil N content at seeding in the main plot for no-till (NT) and reduced tillage (RT), respectively; remaining column pairs represent monocropped (left) and intercropped (right) contents after harvest II of faba bean (FB), field pea (FP), narrow-leafed lupin (NL), grass pea (GP), and common vetch (CV),
respectively. The single column represents monocropped plant stands of
sunflower (S).. ... 82
Fig. A 1. Prototype plot seeder with cross-slot openers ... 112
Fig. A 2a-b. Cross-slot opener (red arrows indicating seed travel and placement) ... 112
Fig. A 3. Field pea emerging though cover crop residues ... 1123
Fig. A 4. Hemp cover crop in early September at the trial location Pillnitz ... 113
Fig. A 5a-c. Rye, oats and sunflower cover crops (respectively), in early September at the trial location Groß Radisch ... 114
Fig. A 6a-c. Mustard, buckwheat and hemp cover crops (respectively), in early September at the trial location Groß Radisch ... 115
Fig. A 7a-c Rye, oats and sunflower cover crops (respectively), in early September at the trial location Köllitsch ... 116
Fig. A 8a-c Mustard, buckwheat and hemp cover crops (respectively), in early September at the trial location Köllitsch ... 117
Fig. A 9a-c MC winter field pea at flowering in the no-till, reduced tillage and plough tillage system (respectively), at the trial location Reinhardtsgrimma ... 118
Fig. A 10a-c IC spring field pea at flowering in the no-till, reduced tillage and plough tillage system (respectively), at the trial location Bockelwitz... 119
Fig. A 11a-b MC field pea in the no-till and reduced tillage system (respectively), in early September at the trial location Reinhardtsgrimma 2009 ... 120
Fig. A 12a-b MC Grass pea in the no-till and reduced tillage system (respectively), in early September at the trial location Köllitsch 2009 ... 121
Fig. A 13a-b MC common vetch in the no-till and reduced tillage system (respectively), in late October at the trial location Reinhardtsgrimma 2010 ... 122
List of Tables
Table 2.1. Site specific soil information, experimental and simulation details. ... 11 Table 2.2. Monthly mean, trial period and simulation period mean temperature, monthly
precipitation and cumulative precipitation during the cover crop trial and
simulation period. ... 17 Table 2.3. Sources of variation, field emergence, dry matter production of combined and
separated cover crop materials and the proportion of stem dry matter (Stem%), weed dry matter production, N accumulation in combined and separated cover crop materials and N accumulated in the cover crop stem (N% Stem), N accumulation in weed biomass, C : N ratio in stem and leaf material, and the inorganic soil N in the 0 to 0.6 m soil horizon after harvest. ... 19 Table 2.4. Cover crop field emergences (averaged across fertiliser levels). ... 19 Table 2.5. Proportion of the cover crop stem (stem%) on the total dry matter production. ... 22 Table 2.6. Proportion of total N accumulated in the stem (N% stem) of individual cover
crops (averaged over fertiliser levels). ... 24 Table 2.7. C : N ratio in cover crop stem and leaf material. ... 27 Table 3.1. Field trial preparation, data measurement and sample collection dates. ... 45 Table 3.2. Crop species, cultivar, 1000 seed weight, monocropped (MC) and intercropped
(IC) seeding rate (target plant population) used in the field trials. ... 45 Table 3.3. Sources of variation of percentage of target crop plant population, legume
overwintering, crop and weed dry matter production, grain yield and harvest index. ... 49 Table 3.4. Monocropped (MC) and intercropped (IC) winter legume overwintering in the
no-tillage (NT), reduced tillage (RT) and plough tillage system (PT). ... 49 Table 3.5. Percentage of target crop plant population in spring of monocropped and
intercropped legumes and oats in the no-tillage (NT), reduced tillage (RT) and plough tillage system (PT). ... 51 Table 3.6. Soil temperatures in autumn and spring in no-tillage (NT), reduced tillage (RT)
and plough tillage (PT) winter-legume plots. ... 51 Table 4.1. Soil, experimental details and date of first daily mean below 0°C (End of
growing season by temperature definition). ... 67 Table 4.2. Monthly mean and trial period mean temperature, monthly precipitation and
Table 4.3. Sources of variation, degrees of freedom and statistical significance of the sources of variation for of field emergence (legumes and monocropped
sunflower), total cover crop and weed dry matter production at harvest I and II, inorganic soil N 0 to 0.3 m soil core, shoot N accumulation (shoot N) and N2
fixation. ... 74 Table 4.4. Field emergence of legumes and monocropped sunflowers (averaged across
tillage systems). ... 75 Table 4.5. Shoot dry matter (DM) production of weeds in no-till (NT) and reduced tillage
(RT) cover crop plots and the control plot at harvest I and II, as well as weed dry matter production at harvest II (averaged over tillage systems and
locations). ... 76 Table 4.6. Weed biomass compositions at Reinhardtsgrimma and Köllitsch in 2009 and
2010 in the no-till (NT) and reduced tillage (RT) system. ... 81 Table 4.7. N2 fixation of legume cover crops in the no-till (NT) and reduced tillage (RT)
system.. ... 84
1.
Chapter: Introduction
1.1 No-till seeding in organic farming
Sustainable organic farming is based on the principle of soil fertility preservation. This stands in contrast to the widespread use of deep inversion plough tillage for primary tillage in organic farming systems (Wilhelm et al., 2011). The continued use of the mouldboard plough is due to its proven efficiency for weed control (Gruber and Claupein, 2009). However, this labour and energy intensive technique reduces the soil's aggregate stability and organic matter content (Schjønning and Rasmussen, 1989; Hermawan and Cameron, 1993) leading to soil erosion. No-till practices on the contrary can diminish soil erosion to tolerable rates (Montgomery, 2007), stabilise soil aggregates and increase soil organic carbon close to the soil surface while reducing the annual CO2 emissions (Carter, 1992; Madari et al., 2005; He et
al., 2009; Ussiri and Lal, 2009).
Nonetheless, to date, the adaption of organic no-tillage systems is negligible under the temperate climate conditions of central Europe. In this region the average annual precipitation range (Germany 551.6 – 1018.1mm) (Becker, 2013) is higher than in the semi-arid and arid regions of North America and Central Asia in which the conventional no-tillage systems are widely used. No-tillage practices can increase the soil water storage (Fabrizzi et al., 2005) but potential yield increases due to the water preservation are limited in central Europe so that the adaption rate will only increase if economic or environmental benefits arise. Economic benefits from reduced fuel consumption and lower labour costs due to omitted tillage are often already offset in the transition period to the no-tillage system by yield reductions (Reicosky and Saxton, 2007) as a result of poor crop emergence, increased weed pressure and reduced N mineralisation.
1.2 Strategies for the implementation of no-tillage practices in organic agriculture
The production of large amounts of mulch material has to be ensured by choosing the right strategy depending on the point in the crop rotation and the related status of N availability as well as the N requirements of the following crop.
Transitioning to organic no-tillage at the end of a yearly crop cycle by omitting stubble tillage can increase perennial weed growth (Pekrun and Claupein, 2006) especially in cases of high N availability. To improve the conditions in the transition period it is advisable to remove very competitive perennial weeds after harvest by plough tillage and suppress emerging weeds through the establishment of cover crops, which produce a weed suppressing soil cover in which the spring cash crops are directly sown. Today, cover crops in Central Europe are predominantly used to reduce soil erosion and nitrogen (N) leaching. For this purpose cover crops need to develop quickly and cover the ground, ideally producing ≥2.0 Mg ha-1above ground dry matter and accumulate ≥60 kg N ha-1. The ability of cover crops to suppress weeds and reduce their germination and growth through low N availability is a new core task which is particularly important for grain legume cash crops in organic no-tillage systems.
Cover crop plants can reduce weed growth through light interception, above and below ground competition and uptake of available inorganic nutrient resources particularly nitrate N (Kruidhof et al., 2008; Spies et al., 2011). For systems with subsequent legume cash crops weeds can be suppressed by the thick residue mulch that retains accumulated N, intercepts light and has, in some species, allelopathic properties (Barnes and Putnam, 1983; Putnam and DeFrank, 1983; Teasdale and Mohler, 2000).
1.3 Characteristics of cover crop materials
A high quality residue has a high C : N ratio which results in slow decomposition and N mineralisation, while low quality residues with low C : N ratios are mineralised in a short period of time. Plant parts differ in their C : N ratio depending on their phenological growth stage (Steer et al., 1985), making the compartmentalisation important for the evaluation of the residue quality. The C : N ratio of stem material increases as they develop and mature due to the relocation of N during the generative growing phase into inflorescence and seeds. The result is that the C : N ratio is usually highest in the stem material and lowest in the leaf and inflorescences. For a slow residue decomposition and N mineralisation it is therefore not only important to select for species with a large C : N ratio for the whole plant, but to select for cover crops that produce large amounts of stem material with a high C : N ratio before reaching maturity. The C : N ratio in legume plant material is usually much lower than in non legumes (Smith and Sharpley, 1990), thus it can be beneficial to use non legume cover crops for reduced N mineralisation and better retention of residues on the soil surface. The non legume species rye, oats, sunflower, mustard, buckwheat and hemp have been evaluated as cover crops through the determination of their total biomass production (Stivers-Young, 1998; Creamer and Baldwin, 2000; Clark, 2007; Miyazawa et al., 2010; Forentìn et al., 2011). Rye, oats and mustard have been in use as cover crops in organic farming in Central Europe. Sunflower, buckwheat and hemp are considered to be promising new cover crops.
Cereal cover crops can use the plant available soil nitrogen (N) resources to produce large quantities of plant material with a wide carbon (C) to N ratio (Ruffo and Bollero, 2003) which can result in a N immobilisation and reduced weed growth. Additionally rye mulch has shown the ability to reduce the weed emergence and the weed biomass under no-tillage conditions (Barnes and Putnam, 1983). For the transition to an organic no-tillage system the mulch layer should be established with a cover crop in late summer right after the last stubble tillage.
Low inorganic soil N, as a result of slow N mineralisation, can have negative effects on both non-legume weeds and cash crops. Grain legume cash crops are able to substitute for low inorganic soil N by symbiotic N2 fixation which makes them suitable for the transition period
to an organic no-till system. Diametrically opposed to high N demand by non legume cash crops high inorganic soil N resources (in particular nitrate) are undesired for grain legume cash crops because they limit the symbiotic N2 fixation. For peas it has been shown by Voisin
et al. (2002) that soil nitrate contents have to fall below the threshold value of <56 kg N ha-1 to initiate symbiotic N2 fixation. In their experiments, peas in their vegetative and beginning
of seed filling state, began to display reduced symbiotic N2 fixation at soil nitrate contents of
large amounts of biomass to accumulate and immobilise as much inorganic soil N as possible. In a succeeding pea cash crop this could help to maximise the percentage of the total crop N derived from symbiotic N2 fixation. Large amounts of residues are also needed for sufficient
weed suppression (Teasdale et al., 1991), while low soil nitrate availability could additionally reduce the germination of weeds like Chenopodium album L. that require nitrate to break their seed dormancy. This could be advantageous for grain legumes especially in their early growing period in which their slow initial development (Giunta et al., 2009), makes them susceptible to weed competition (Nelson and Nylund, 1962).
1.4 Advancements in seeding technology
While the weed suppression increases with mulch quantity (Teasdale and Mohler, 2000) the crop seed placement is impaired by heavy residue layers. With no-till disk machines seeds can end up positioned on top of hairpinned residues while shank type openers are not practicable under very heavy residue conditions due to poor residue flow leading to plugging problems of the seeding unit. The embedding of seeds in hairpinned residues can result in reduced crop emergences in dry conditions due to poor seed-soil contact (Baker and Saxton, 2007). Therefore special no-tillage seeding techniques have to be used for thick cover crop residue layers. The inverted T-cross slot openers (Fig. A 1-2a-b), were developed for the use in high residue environments (Baker, 2007) and can improve the seed placement under those conditions by placing the seed into horizontal slots below the residue covered soil surface, creating water vapour rich conditions that favourably affect germination (Fig. A 3; Wuest, 2002; Baker, 2007).
1.5 Timing of legume cash crop seeding and use of intercrops
Even with weed suppressing plant mulch present and crop seed placement with advanced seeding technology the crop-weed competition can still be shifted in favour of weed growth due to the slow early development of large seeded grain legumes.
(Jensen, 1996) to increase the crop-weed competition of the IC crop stands compared with the monocropped (MC) legumes. This can considerably reduce the weed biomass production compared with MC legume plant stands as was shown for winter wheat and winter faba bean by Bulson et al. (1997).
Winter wheat is well adapted to the winter conditions in central Europe and can be intercropped with both the winter faba bean and field pea. Both of these legumes have shown the capability to overwinter under central European conditions (Arbaoui et al., 2008; Urbatzka et al., 2012). However they are also susceptible to frost damage if there is no protective snow cover. Experiments in the harsh winter conditions of North America have shown that long stubble can significantly increase the winter wheat survival due to the increased snow depth and higher soil temperatures (Larsen et al., 1988). For the winter legumes a similar result could be achieved with cover crop residues which increase snow trapping and protect the winter legumes in the no-tillage system.
In spring the advanced winter legume development will only be a competitive advantage against the weeds if sufficient quantities of legumes overwinter. In years with a low overwintering percentage the spring sown legumes could reach higher yields and show a better weed suppression than the winter legumes.
Depending on the point in crop rotation and the soil N status cover cropping might require additional fertilisation for non-legume cover crops or the use of legume cover crops.
1.6 No-till sown legume cover crops
In some conditions it can therefore be advisable to transition to the no-till system after grain cash crop harvest in summer with the establishment of no-till seeded cover crops. This can reduce the weed competition for the cover crop because the available N resources for weeds have been depleted by the cash crop, whereas perennial weeds that are favoured by the omission of tillage (Moonen and Barberi, 2004), were cut in the harvest process. The no-till seeding of cover crops can also reduce the annual weed population density as weed seeds are not incorporated into the soil and germination from the weed seed bank is not induced by tillage (Bilalis et al., 2001). During the cover cropping period, the weed growth will be reduced through cover crop-weed competition for light, water and nutrients.
termination by tillage or herbicides is not possible and alternative methods like mowing or rolling can delay the cash crop seeding and pose the risk of regrowth. The termination of cover crops during winter is also advantageous in dry years because it allows the soil water resources to be replenished over winter while frost resistant cover crops would continue their resource usage throughout spring, with possibly detrimental effects for the subsequent cash crop (Clark, 2007).
Growing a cover crop mixture of legumes and a non-legume, like rye, can further deplete available soil N sources for weeds, reducing their growth and increasing the legume N2
fixation efficiency (Brainard et al., 2012). The additional biomass production of the non-legume can increase the total intercropped biomass over the monocropped biomass production. The use of rye can be problematic in an organic no-till system when insufficient winter kill delays the cash crop seeding, because for the successful termination by the alternative use of a roller-crimper, rye has to reach anthesis (Mirsky et al., 2009). Alternatively sunflowers can be used and as a warm season crop they will be terminated by frost. Sunflowers are well suited as an intercrop partner due to the complementary characteristics to legumes, such as early ground shading. Successful conventional sunflower cropping in a well fertilised no-till system has shown their suitability for conservation tillage (Halvorson et al., 1999).
Low inorganic soil N resources after the harvest of cereals can be compensated by legumes through N2 fixation (Reiter et al., 2002). The N2 fixation can be a competitive advantage over
the weeds and increase the available N resources for the subsequent cash crop, which will be provided through decomposing legume residue (McVay et al., 1989). This could, to some extent, compensate for the decreased mineralisation in the no-till system.
1.7 General objectives and thesis layout
results will be a valuable contribution for the development of a more sustainable organic no-tillage system.
The objectives of this study were:
(i) To examine six non-legume cover crops (rye, oats, sunflower, mustard, buckwheat and hemp) for their suitability for cover cropping preceding no-till sown legume cash crops through evaluation of their ability to produce biomass and reduce plant available inorganic soil N resources by N accumulation and assessment of long term N immobilisation in plant compartments with a high C : N ratio through N mineralisation with the STICS crop model.
(ii) To determine if the total biomass production and N accumulation can be increased by incorporating organic fertiliser before seeding.
(iii) To assess the suitability of three different legume species (field pea, faba bean and narrow-leafed lupin) for no-till cash crop systems by examination of their grain production after no-till, reduced tillage and plough tillage.
(iv) To determine the capacity of intercropped plant stands of legume cash crops and cereal grains to enhance the weed suppression and the total grain yield.
(v) To investigate if autumn seeding can enhance the weed competition of legume cash crops.
(vi) To determine if the transition to the no-till system can be alternatively realised through no-till seeding of legume cover crops or if tillage is needed for sufficient weed suppression and cover crop production.
2.
Chapter: The Suitability of Non-legume Cover Crops for
Inorganic Soil Nitrogen Immobilisation in the Transition Period
to an Organic No-till System
2.1 Introduction
The evaluation of cover crops through determination of their biomass production and weed suppression is common. However, for the use in the transition period to an organic no-till system the cover crops need to reduce the plant available N in the soil and produce large amounts of biomass with slow N mineralisation. Therefore a novel approach should be used to evaluate potential cover crops by their proportion of stem, leaf and inflorescence with regards to total cover crop biomass, the C : N ratio of the plant compartments and the related N mineralisation. The total and partitioned cover crop biomass and N accumulation as well as the individual C : N ratio of plant partitions can each be used to evaluate the quantity and quality performance of different plant species. However, the production of large amounts of biomass combined with a large N accumulation does not necessarily lead to an extended period of low N availability. For a more specific cover crop selection based on their overall properties, all factors can be combined in a model simulation like the residue decomposition model of the STICS (Simulateur mulTIdisciplinaire pour les Cultures Standard) model (Brisson et al., 1998). The simulated proportional net N mineralisation of separated leaf and stem material could help to identify species specific N mineralisation behaviour of the plant compartments while the combined simulation of the different materials from one species would account for material interactions during mineralisation. Cover crop species often differ in their leaf and stem biomass production and in the amount of N that is accumulated in these plant compartments. Their characteristics vary as well and it is important to simulate the net N mineralisation from the individual residues to predict the amount of released N over winter potentially influencing the early weed competition and the onset of symbiotic N2 fixation in
the succeeding legume cash crop. These new methods could help to identify cover crops more precisely for the transition to organic no-tillage systems.
cover crop biomass production. The larger dry matter production could result in improved residue cover and weed suppression in the early cash crop phase.
It was the objective of our trials with non-legume cover crops to test the following hypotheses: (i) The cover crop species rye, oats, sunflower, mustard, buckwheat and hemp differ in their partitioning of biomass, N accumulation and C : N ratio in stem material as well as in combined leaf and inflorescence material. (ii) The use of fertiliser before seeding increases the total biomass production and N accumulation of the non legume cover crops. (iii) Cover crop species differ in the ability to reduce plant available inorganic soil N during growth and in their potential to immobilise the accumulated N over winter and spring. As a result, these species vary in their suitability as cover crops preceding no-till sown legume cash crops.
2.2 Materials and Methods
2.2.1 Experimental study site and field trial setup
Field trials were conducted from July to October 2008 in three different environments (three site-years): at the long term organically farmed research field of the University of Applied Sciences Dresden at Pillnitz (PI; 51°00'N, 13°53'E, 116 m a.s.l.), at a long-term certified organic farm at Groß Radisch (GR; 51°15'N, 14°41'E, 240 m a.s.l.), and the organic research field of the Teaching and Research Farm Köllitsch (KÖ; 51°30'N, 13°06'E, 84 m a.s.l.), Germany (at GR based on and at PI and KÖ equivalent to Council Regulation (EC) No 834/2007 (European Union, 2007). The three sites were selected to represent different climate conditions, in particular a different distribution of precipitation during the cover cropping phase. The preceding crops before the cover cropping period were spring barley, winter triticale and winter wheat at the PI, GR and KÖ location, respectively. At the GR and KÖ locations the grain was harvested in early August 2008 and the straw was transported off the field. At PI the spring barley was chopped with a flail mower on the 18 June due to insufficient plant development; residues remained in the field.
annuus L., cv. Methasol), white mustard (Sinapis alba L., cv. Signal), buckwheat (Fagopyrum esculentum Moench, cv. Spacinska) and hemp (Cannabis sativa L., cv. Bialobrzeskie) with seeding rates (viable seeds): 300, 350, 90, 150, 200 and 150 seeds m-2, respectively), no cover crop (weeds only) and bare soil fallow without vegetation (managed through periodical flame weeding, every 14 days). The seeding rates were in the upper range of local customary seeding rates to achieve rapid ground cover and soil protection as well as weed suppression. Plots without cover crop were used to examine weed growth potential and weed competition by evaluated cover crop species. Bare soil fallow was included in the study as a control to determine the influence of cover cropping on the soil N mineralisation during the cover cropping period.
Two days before seeding, the plough tillage (0.25 m) and the seedbed preparation with a rotary harrow (0.08 m) was carried out at the GR and KÖ location (Table 2.1). At GR, the field was additionally rolled before seeding. At PI, the residue incorporation by plough tillage and seedbed preparation was performed one week (26 June 2008) after barley growth was terminated with a flail mower. At the day of seeding, the fertiliser (fertilised plots only) in the form of horn grist (DCM - Deutsche CUXIN Marketing GmbH, Germany) at a rate of 50 kg N ha-1 was incorporated at a depth of 0.05 m with a plot seeder (Type HEGE 80, Wintersteiger, Austria). The seeding of the cover crops (row spacing 0.15 m) was carried out with the same plot seeder at a depth of 0.03 m. The no cover crop (weeds) and fallow plot without vegetation received one pass with the empty plot seeder. The cover crop field emergence was determined two to three weeks after seeding with four repetitions per plot (four randomly selected rows one metre long).
2.2.2 Sample collection and analysis
Soil samples were collected directly after seeding (ten sample points for each main plot) and after cover crop biomass sampling in October (four sample points for each subplot). At both PI and KÖ, the soil samples were taken from 0 to 1.2 m (four equal core sections at 0.3 m), while at GR the sampling depth was limited to the soil layer from 0 to 0.6 m (two equal core sections at 0.3 m) due to high stone content in the soil layer below 0.6 m. Core samples of the same depth-level were homogenised and stored in cold storage coolers in the field, followed by deep freezing to -18°C the day of sample collection until the final analyses. Within one hour of defrosting, soil extracts with 0.01 M CaCl2 were prepared, and NO3-N and
Table 2.1.Site specific soil information, experimental and simulation details.
Site Pillnitz (PI) Groß Radisch (GR) Köllitsch (KÖ)
Soil type (FAO classification)a Calcaric Cambisol Eutric Gleysol Arenic Fluvisol
Soil texture Sandy Loam Slightly Loamy Sand Loamy Sand
Soil pH (0.01 M CaCl2) 6.0 5.4 5.5
Soil P (CAL; mg kg-1)b 41 23 26
Soil K (CAL; mg kg-1)b 146 134 66
Soil Mg (0.01 M CaCl2; mg kg -1
) 78 63 115
Tillage and seedbed preparation 26 June 2008 9 August 2008 11 August 2008
Fertiliser incorporatedc 29 July 2008 11 August 2008 13 August 2008
Cover crop sowing date 29 July 2008 11 August 2008 13 August 2008
Field emergence determined 19 August 2008 24 August 2008 27 August 2008
Harvest 25 October 2008 30 October 2008 31 October 2008
Start of Simulation 25 October 2008 30 October 2008 31 October 2008
End of Simulation 13 March 2009 18 March 2009 19 March 2009
a
Soil type according to IUSS Working Group WRB, (2006).
b
Calcium Acetate Lactate (CAL) extraction method after Schüller (1969).
c
Only in fertiliser plots.
12 Analytical B.V., Breda, Netherlands) based on the VDLUFA method A 6.1.4.1 (Thun and Hoffmann, 1991) and DIN ISO 14255 : 1998-11 (DIN Deutsches Institut für Normung e.V., 1998), respectively. Soil sampling depth varied between GR and the other two locations as described so that only the samples up to 0.6 m soil depth were used for the comparative analysis of all trial sites.
At the biomass harvest in October an area of 2.04 m2 of each plot was cut by hand and the plant cover was separated into cover crops and weeds. The above ground gross fresh weight of cover crops and weeds was determined directly after harvest in the laboratory using a laboratory scale (SI 6002, Denver-Instrument). Samples of 200 to 400 g were dried in a drying cabinet at 105°C to constant weight for the dry matter weight calculations. To determine the C and N content in cover crop stem, leaf and inflorescence material additional plants were harvested from each plot. Ten representative plant shoots per plot were sampled for sunflower, mustard, buckwheat and hemp while twenty plant shoots per plot were sampled for rye and oats. For each plant, the shoot, leaves and inflorescence were separated from the stem by hand. The leaf and inflorescence material were combined and were declared as leaf material. The stem and leaf material fresh weight were determined and the plant parts were dried for the dry matter weight calculations in a drying cabinet at 60°C. The dried plant parts were finely ground (< 0.2 mm) with an ultra centrifugal mill (ZM 1000, Retsch, Germany). Analysis for %C and %N was performed with an elemental analyser (TruSpec Macro, LECO, USA) in compliance with the VDLUFA method 4.1.2 (Bassler, 1976) and DIN ISO 10694 : 1996-08 (DIN Deutsches Institut für Normung e.V., 1996) respectively.
2.2.3 Statistical Analyses
The cover crop field emergences, cover crop C : N ratio of stem and leaf material, stem percentage of the total biomass (stem%) and %N in stem biomass did not require any transformation while the logarithmic transformation was applied to all other data sets. Homogeneity of variance was tested and in case of heterogeneous variances the model was fitted for partitioned variances (Littell et al., 2011). The degrees of freedom were determined based on the Kenward-Roger method. Least square means were calculated and mean comparisons were carried out with the Tukey-Kramer test (α = 0.05) within the SAS procedure MIXED.
2.2.4 Simulation of N mineralisation
The residue decomposition module of the STICS model (Brisson et al., 1998) was utilised to predict the N mineralisation from residues produced by the different cover crops. The decomposition model considers three pools: the cover crop residues, the microbial biomass decomposing the residues and the humified organic matter (Brisson et al., 1998; Nicolardot et al., 2001). Daily changes in these pools are related to their C : N ratio and the amount of carbon in these pools. During the decomposition of the cover crop residue, carbon is either emitted as CO2 or incorporated in microbial biomass. Crop residue N that is not used for the
growth of microbial biomass is released to the pool of inorganic N. This pool also acts as a source of inorganic N for the development of microbial biomass. Decomposing microbial biomass releases C and N which is partly included in humified organic matter, partly emitted as CO2 or, in the case of N, released as inorganic N. This flow of C and N is characterised by
the model through (i) the plant residue decomposition rate constant (k) and the accumulation of C from residue in the microbial biomass (Y), (ii) the decay rate constant of the microflora
(λ) and the amount of microbial C humification (coefficient h), (iii) the C : N ratios of the three pools C : NResidue, C : NMicrobial biomass and C : NHumus (Fig. 2.1) (Brisson et al., 2009;
microbial biomass (h), with the C : N ratio of residues. In additional soil incubation experiments Justes et al. (2009) confirmed these relationships and further evaluated and parameterised the model for immature autumn grown cover crops with a wide range of C : N ratios. Under field conditions the decomposition model was recalibrated and successfully validated for incorporated immature cover crop residues by Justes and Mary (2004).
Fig. 2.1.Conceptual diagram of the residue decomposition model (Nicolardot et al. 2001), continuous lines
indicating C fluxes, dashed lines indicating N fluxes.
For the C : N ratio model parameter the input bounds are 6 and 200. However preliminary simulations displayed N mineralisation inconsistencies at low C : N ratios. The simulations using hypothetical immature crop residues with a fixed dry matter (1 Mg ha-1) and C content (40%) as well as variable C : N ratios (8 to 20 : 1) showed that under no-till conditions the simulated proportionate net N mineralisation (% of added N) was not graduated according to its residue C : N ratio (Fig. 2.2a). Default climate conditions from April to December were used (average temperature 14.2°C, cumulative precipitation 513 mm). Within the first 180 days, the N mineralisation on the soil surface was lower for residues with a C : N ratio of 10 to 12 than for residues with a C : N ratio of 13 to 20. With tillage (0.25 m depth), the simulated net N mineralisation was fine graded and fell with increasing C : N ratios from 8 to 20 (Fig. 2.2b), similar to the results published by Nicolardot et al. (2001) and Justes et al. (2009). Due to the discrepancy between the literature and the simulation results under no-till conditions, the simulation with tillage was applied instead. Within the soil, the net N mineralisation is usually lower (Coppens et al., 2006) due to N stabilisation by microbial biomass, but the simulation still delivers valuable indicators for the evaluation of cover crop species.
(climate data) (DWD 2014 and LfULG 2014 personal communication), and from external sources and the literature (soil characterisations) (LfULG, 2014a; LfULG 2014 personal communication; Lux, 2015; Table 2.1 and 2.2). The model was run from 25 October, 30 October and 31 October (day of biomass harvest) at PI, GR and KÖ, respectively for 140 days up to the intended seeding of pea cash crops in March (Table 2.1). The initial condition for the simulation was the presumed termination of the cover crops with a roller-crimper at the day of the biomass harvest. The input for the model was a single intervention (stem or leaf biomass) or two interventions (stem and leaf biomass) of organic residue supply with the same quantity of stem, leaf or combined stem and leaf dry matter present at biomass harvest. The residue
type input parameter was ‘immature crop residues’ with plant species and plant compartment
16
Fig. 2.2a-b. Comparison of proportionate net N mineralisation in no-till (a) and tilled conditions (b) from immature crop residues with fixed dry matter (1 Mg ha-1) and
C content (40%) as well as variable C : N ratios (8 to 20 : 1).
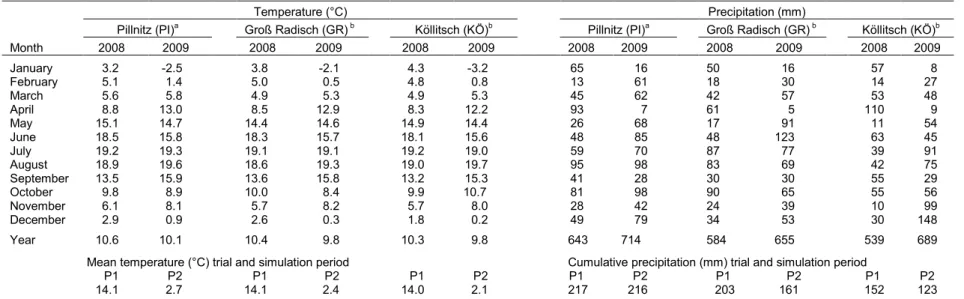
Table 2.2.Monthly mean, trial period and simulation period mean temperature, monthly precipitation and cumulative precipitation during the cover crop trial and
simulation period.
Temperature (°C) Precipitation (mm)
Pillnitz (PI)a Groß Radisch (GR) b Köllitsch (KÖ)b Pillnitz (PI)a Groß Radisch (GR) b Köllitsch (KÖ)b
Month 2008 2009 2008 2009 2008 2009 2008 2009 2008 2009 2008 2009
January 3.2 -2.5 3.8 -2.1 4.3 -3.2 65 16 50 16 57 8
February 5.1 1.4 5.0 0.5 4.8 0.8 13 61 18 30 14 27
March 5.6 5.8 4.9 5.3 4.9 5.3 45 62 42 57 53 48
April 8.8 13.0 8.5 12.9 8.3 12.2 93 7 61 5 110 9
May 15.1 14.7 14.4 14.6 14.9 14.4 26 68 17 91 11 54
June 18.5 15.8 18.3 15.7 18.1 15.6 48 85 48 123 63 45
July 19.2 19.3 19.1 19.1 19.2 19.0 59 70 87 77 39 91
August 18.9 19.6 18.6 19.3 19.0 19.7 95 98 83 69 42 75
September 13.5 15.9 13.6 15.8 13.2 15.3 41 28 30 30 55 29
October 9.8 8.9 10.0 8.4 9.9 10.7 81 98 90 65 55 56
November 6.1 8.1 5.7 8.2 5.7 8.0 28 42 24 39 10 99
December 2.9 0.9 2.6 0.3 1.8 0.2 49 79 34 53 30 148
Year 10.6 10.1 10.4 9.8 10.3 9.8 643 714 584 655 539 689
Mean temperature (°C) trial and simulation period Cumulative precipitation (mm) trial and simulation period
P1 P2 P1 P2 P1 P2 P1 P2 P1 P2 P1 P2
14.1 2.7 14.1 2.4 14.0 2.1 217 216 203 161 152 123
P1, mean temperature and cumulative precipitation during the cover cropping period from cover crop seeding to cover crop dry matter sampling (from August to October 2008). P2, mean temperature and cumulative precipitation during the crop simulation period from termination to seeding of the cash crop (November 2008 to March 2009).
a
Climate data (DWD 2014 personal communication).
b
Climate data (LfULG 2014b).
18
2.3 Results
2.3.1 Climate
The climate differed between locations in terms of total precipitation and its monthly distribution. In both years, the total precipitation at PI, GR and KÖ ranged above the historical average (597, 554 and 453 mm, respectively) (LfULG 2014 and SBS 2015 personal communication; LfULG, 2014b; DWD 2014 and 2015 personal communication). The total precipitation in 2008 and 2009 was largest at PI with a difference of +59 mm in both years to GR, and +104 and +25 mm (2008 and 2009, respectively) to KÖ (Table 2.2). In the cover cropping period, the monthly precipitation in August 2008 at PI and GR was 126 and 98% higher, respectively than at KÖ, while in September slightly more precipitation occurred at KÖ than at the other locations. During the main months of the simulation period the cumulative precipitation at PI and GR was 76 and 31% higher, respectively than at KÖ.
Mean annual temperatures in 2008 at PI, GR and KÖ were 10.6, 10.4 and 10.3°C, respectively (Table 2.2). These temperatures were between 0.3 and 0.5°C above the long term average, whereas in 2009 they were similar or slightly below the average (10.1, 9.9, 10.0°C, at PI, GR and KÖ, respectively) (LfULG 2014 and SBS 2015 personal communication, LfULG, 2014b; DWD 2014 and 2015 personal communication). Monthly mean temperatures in the cover cropping period (August to October) varied only marginally between the three locations. However, monthly mean temperatures during the second and third month of the N mineralisation simulation were at PI 1.1 and 0.7°C (December and January, respectively) higher than at KÖ.
2.3.2 Cover crop emergence
Table 2.3.Sources of variation, field emergence, dry matter production of combined and separated cover crop materials and the proportion of stem dry matter
(stem%), weed dry matter production, N accumulation in combined and separated cover crop materials and N accumulated in the cover crop stem (N% stem), N
accumulation in weed biomass, C : N ratio in stem and leaf material, and the inorganic soil N in the 0 to 0.6 m soil horizon after harvest.
Source of Field Shoot dry matter production Shoot N accumulation C : N ratio Soil Nc
variation emergence Total Stem Leaf Stem%a Weeds Total Stem Leaf N% Stemb Weeds Stem Leaf 0 to 0.6 m
Location (L) n.s. *** *** *** n.s. *** *** *** *** n.s. *** *** *** n.s.
Fertiliser (F) n.s. *** *** *** * n.s. *** *** *** *** ** ** *** ***
Species (S) *** *** *** *** *** *** *** *** *** *** *** *** *** ***
L x F n.s. ** *** * ** n.s. * n.s. * n.s. n.s. * * *
L x S *** ** *** *** *** *** ** *** * *** *** *** *** ***
F x S n.s. n.s. n.s. * *** ** n.s. n.s. n.s. *** * n.s. n.s. n.s.
L x F x S n.s. n.s. n.s. n.s. n.s. n.s. n.s. n.s. n.s. n.s. * n.s. n.s. **
a proportion of cover crop stem dry matter on total cover crop dry matter production; b
proportion of N accumulation stored in the cover crop stem; c inorganic soil N.
Component of variation: *, **, *** significant at P levels of P < 0.05, 0.01, 0.001, respectively; n.s., not significant.
Table 2.4.Cover crop field emergences (averaged across fertiliser levels).
Cover crop field emergence (% germinated plants of viable seeds)
Species Pillnitz (PI) Groß Radisch (GR) Köllitsch (KÖ)
Rye 80 b A 70 b A 75 b A
Oats 83 ab A 97 a A 91 a A
Sunflower 93 a A 94 a A 82 ab A
Mustard 51 c B 46 c B 75 b A
Buckwheat 87 ab A 86 a A 93 a A
Hemp 61 c B 58 c B 88 a A
Within a column, lower case letters display significant differences between cover crops based on Tukey-Kramer means separation (α= 0.05);
within a row, upper case letters display significant differences between locations based on Tukey-Kramer means separation (α= 0.05).
20
2.3.3 Dry matter production
At PI the seedbed preparation took place almost 7 weeks earlier, and the cover crop seeding was carried out 13 and 14 days ahead of the locations GR and KÖ, respectively. This might have contributed to a larger biomass for all species at PI compared to GR and KÖ. Cover crop plant stands in early September are shown in Fig. A 4 and A 5 to A 8a-c. Total dry matter production ranged from 4.32 to 7.73 Mg ha-1, 0.95 to 3.73 Mg ha-1 and 2.16 to 3.94 Mg ha-1 at PI, GR and KÖ, respectively (Table 2.3, Fig. 2.3a-c). Even with this variation, the cover crop species with the largest biomass production were similar at all locations. At PI and KÖ the sunflower displayed the largest dry matter production (7.46 and 3.53 Mg ha-1, respectively, data not shown), while at GR the sunflower, oats and rye produced equally large amounts of biomass (3.15, 2.59 and 2.43 Mg ha-1, respectively). At PI and KÖ the total biomass production by rye (5.51 and 2.82 Mg ha-1, respectively) was second to sunflower.
Fig. 2.3a-c. Total dry matter (DM) partitioned into cover crop stem and leaf material, as well as weed
biomass in plots of rye (R), oats (O), sunflower (S), mustard (M), buckwheat (B), hemp (H) and no cover
crop – weeds (W), respectively. The cover crop and weed dry matter was produced without fertiliser (left
The separation of the total biomass into stem and leaf material revealed divergent amounts of stem and leaf biomass produced by the different species. The largest stem dry matter production at PI, GR and KÖ was shown by sunflower and rye and, at PI, by mustard. At PI, sunflower had the largest leaf biomass, while at GR and KÖ oats and sunflower displayed an equally large leaf dry matter production. Sunflower produced large amounts of stem and leaf material, but the stem proportion of the total biomass was comparatively low. Rye and mustard were the species which displayed, at all locations, consistently the largest stem% (Table 2.5). At all locations oats displayed the lowest stem% among the species. It was noted that at PI the sunflower stem% was equally low, while it was larger than oats at GR and KÖ.
Averaged over locations, the incorporation of fertiliser before seeding only increased the stem% of oats and buckwheat. Fertiliser consistently increased the total cover crop and stem biomass at GR and KÖ, but had no effect at PI. Averaged over locations, the leaf dry matter was significantly larger in the fertilised plots of rye, sunflower, mustard and hemp while the remaining species showed no response to additional fertilisation.
The weed biomass in the cover crop plots was highest at GR and lowest at KÖ, ranging from 0.02 to 2.18 Mg ha-1, without cover cropping the weed biomass was similar at PI and GR and larger than at KÖ (Table 2.3, Fig. 2.3a-c). At all locations cover cropping significantly reduced the weed biomass compared to weed plots without cover crops. At GR and KÖ, the weed biomass in hemp plots was larger than in the other cover crops. At PI the weed biomass in plots of hemp was without difference to the other crops. Fertilisation before seeding increased the weed biomass in rye and oats, but had no effect on the weed biomass in the plots with the other species.
2.3.4 Shoot N accumulation and inorganic soil N
22
Table 2.5.Proportion of the cover crop stem (stem%) on the total dry matter production.
stem% on total dry matter production
Pillnitz (PI) Groß Radisch (GR) Köllitsch (KÖ) Fertiliser x Speciesb
Species -N +N L x Sa -N +N L x S -N +N L x S -N +N
Rye 75 71 73 a A 71 71 71 ab A 74 69 71 a A 73 a A 70 ab A
Oats 57 58 57 c A 51 61 56 d A 56 58 57 d A 54 c B 59 d A
Sunflower 61 55 58 c C 69 68 69 b A 64 63 63 c B 65 b A 62 d A
Mustard 71 73 72 a A 72 74 73 a A 71 69 70 a A 71 a A 72 a A
Buckwheat 60 65 62 b B 63 72 67 bc A 66 68 67 b A 63 b B 68 bc A
Hemp 63 64 64 b A 62 66 64 c A 66 68 67 b A 64 b A 66 c A
-N: without fertiliser; +N: with 50 kg N ha-1
incorporated before seeding;
a
L x S, Location x Species interaction: Within a column lower case letters display significant differences between species based on Tukey-Kramer means separation (α = 0.05), within a row, upper case letters display significant differences between locations based on Tukey-Kramer means separation (α = 0.05);
b
Fertiliser x Species interaction: Within a column lower case letters display significant differences between species based on Tukey-Kramer means separation (α = 0.05), within a row, upper case letters display significant differences between fertiliser treatments based on Tukey-Kramer means separation (α = 0.05).
Fig. 2.4a-c. Inorganic soil N at seeding (SN) and after harvest in plots of rye (R), oats (O), sunflower (S),
mustard (M), buckwheat (B), hemp (H), no cover crop – weed plot (W) and bare soil fallow (F),
respectively. Shoot N accumulation of the respective cover crops partitioned into stem and leaf material as
well as weed shoot N accumulation. Shoot N accumulation without fertiliser (left side columns) and with
Within the species there were only small variations in their ability to reduce inorganic soil N resources as shown by similar inorganic soil N contents in cover crop plots.
At PI and GR fertilisation before seeding significantly increased the inorganic soil N resources in the bare soil fallow plots; this was not the case in most of the cover crop plots. Exceptions were plots of buckwheat at PI and GR, hemp at PI and sunflower at GR which showed significant larger inorganic soil N contents in the fertilised compared to the unfertilised plots.
At PI, GR and KÖ the largest total N accumulation was displayed by sunflower with 127.8, 39.2 and 53.3 kg ha-1, respectively (data not shown). Equally large was the accumulation by mustard at PI (117.3 kg ha-1), and by rye, oats (both species 30.4 kg ha-1) and buckwheat (29.2 kg ha-1) at GR (data not shown). The total N accumulation of the remaining cover crops at PI and KÖ did not vary significantly from one to another.
At PI and KÖ the largest N accumulation in stem material was shown by mustard (56.7 kg ha-1) at PI and rye (22.6 kg ha-1) at KÖ (data not shown). At GR the rye (14.4 kg ha-1) accumulated the most N in the stem, but without significant difference to buckwheat, mustard and sunflower. Instead of storing N in the stem, the sunflower allocated significantly more N than the other species in its leaf material. Only at GR the N in oats leaf material was similarly large as in sunflower.
A species specific increased allocation of N towards the immature cover crop stem was consistently shown at all locations by rye. The proportion of total N in the rye stem material ranged between 48 and 53% (Table 2.6). Similarly large allocations to the stem material were only shown by mustard at PI and GR. For sunflower the proportion of accumulated N in the stem material only ranged between 27 and 29%.
Table 2.6.Proportion of total N accumulated in the stem (N% stem) of individual cover crops (averaged
over fertiliser levels).
% of total N accumulation in cover crop stem
Species Pillnitz (PI) Groß Radisch (GR) Köllitsch (KÖ)
Rye 51 a 48 a 53 a
Oats 36 c 33 cd 35 c
Sunflower 29 d 28 d 27 d
Mustard 48 ab 44 ab 39 b
Buckwheat 45 b 42 b 43 b
Hemp 32 cd 37 c 42 b
Within a location column, lower case letters display significant differences between
cover crop species based on Tukey-Kramer means separation (α = 0.05).
21, 56 and 61%, respectively (data not shown). Furthermore, fertiliser increased the share of N accumulated in stem material for buckwheat and hemp. In the fertilised rye the proportion of accumulated N in the stem was reduced and a higher percentage of N was stored in the leaf material. The accumulation of N in leaf material at GR and KÖ was increased through additional fertilisation by 49 and 57%, respectively, while it had no effect at PI.
In cover crop plots the accumulation of N in weed biomass was significantly lower than in the no cover crop – weed plot. The exception was the N accumulation in weed biomass in the unfertilised hemp plot at GR which was similar to the no cover crop – weed plot.
2.3.5 C : N ratio in stem and leaf material
During biomass harvest at the end of October most cover crops had an emerging inflorescence or were flowering. Due to the earlier seeding at PI, the majority of species displayed advanced growing stages compared to the other locations. Growing stages at GR and KÖ were similar at the time of harvest (data not shown). However, the C : N ratio of stem and leaf material displayed no consistent differences between locations. The stem C : N ratio ranged from 25 to 64, 42 to 88 and 32 to 74 at PI, GR and KÖ, respectively (Table 2.7). Independent from fertilisation the largest stem C : N at PI, GR and KÖ was consistently shown by sunflower (52, 82, 67, respectively). Only at PI, hemp (53) displayed an equally large stem C : N ratio. The growing stages of mustard at all locations and of buckwheat at the PI and KÖ locations were similar. Yet all cover crops, with the exception of rye and hemp, displayed a significantly lower C : N ratio at the PI location than at GR and KÖ. N fertilisation reduced the stem C : N only at PI and KÖ (-14 and -11, respectively) but had no effect at GR.
2.3.6 Simulated N mineralisation from cover crop residues
2.3.6.1Proportionate net N mineralisation and immobilisation from residue N input
The proportionate net N mineralisation (percentage mineralised of total incorporated N) from separate and combined leaf and stem material input displayed some variations between locations in conjunction with the variability of C : N ratios at the PI, GR and KÖ location (Table 2.7 and Fig. 2.5a-f). The proportionate net N mineralisation from leaf N input after 140 days ranged from 8.0 to 29% at PI, -12 to 27% at GR and -9 to 25% at KÖ. In March, the N input of leaf material for the majority of cover crops was, to some extent, mineralised at GR and KÖ. Exceptions were the N immobilisation at GR for both fertilised and unfertilised oats and fertilised rye leaf material and at KÖ for unfertilised leaf material of oats and rye (Fig. 2.5b-c). A larger proportional net N mineralisation cumulation after 140 days was shown by fertilised mustard leaf material (29, 24 and 24% of total incorporated leaf N at PI, GR and KÖ, respectively) as well as by unfertilised sunflower leaf material (20, 16 and 21% of total incorporated leaf N at PI, GR and KÖ, respectively) (Fig. 2.5a-c).
The proportionate net N immobilisation ranged, for the majority of cover crops stem materials, from -14 to -96% at PI, -72 to -139% at GR and -37 to -121% at KÖ for total incorporated stem N (Fig. 2.5d-f). Exceptions, with a larger net N immobilisation proportional to its N input, were shown at PI by unfertilised hemp stem material (-136% of total incorporated stem N) and at GR and KÖ by unfertilised and fertilised sunflower stem material (between -137 and -230% of total incorporated stem N). However, in the presence of sunflower leaf material the net N immobilisation would not be as high.
Table 2.7.C : N ratio in cover crop stem and leaf material.
C : N ratio in cover crop stem and leaf material
Pillnitz (PI) Groß Radisch (GR) Köllitsch (KÖ)
Cover crop stem -N +N L x Sa -N +N L x S -N +N L x S
Rye 50 36 43 b AB 44 61 53 bc A 42 34 38 c B
Oats 48 32 40 bc B 61 61 61 b A 55 46 51 b A
Sunflower 54 49 52 a C 88 75 82 a A 74 60 67 a B
Mustard 39 27 33 c B 43 54 49 c A 55 46 50 b A
Buckwheat 40 25 32 c B 58 42 50 bc A 56 32 44 bc A
Hemp 64 42 53 a A 52 58 55 bc A 44 37 41 c B
Cover crop leaf
Rye 18 15 17 a B 19 21 20 b A 21 15 18 b B
Oats 18 16 17 a C 24 25 24 a A 23 20 21 a B
Sunflower 14 14 14 b A 15 14 15 d A 14 13 14 d A
Mustard 12 11 11 c B 15 14 15 d A 14 13 13 d A
Buckwheat 17 15 16 a B 19 17 18 bc A 17 15 16 c B
Hemp 13 12 12 c B 16 16 16 cd A 14 12 13 d B
-N: without fertiliser; +N: with 50 kg N ha-1
incorporated before seeding;
a
L x S, Location x Species interaction: Within a column lower case letters display significant differences between species based on Tukey-Kramer means separation(α = 0.05), within a row, upper case letters display significant differences between locations based on Tukey-Kramer means separation (α = 0.05).
Fig. 2.5a-f. Proportionate net N mineralisation of separate cover crop leaf material (a-c) and stem material (d-f) at the Pillnitz (PI), Groß Radisch (GR) and Köllitsch
(KÖ) location.
Without fertiliser, oats and rye were the only species which displayed a large net N immobilisation (between -40 and -50% of N input by leaf and stem residue) at two locations, while for sunflower this was only the case at one location (Fig. 2.7a-c). Oats grown in low inorganic soil N conditions at GR and KÖ showed net N immobilisation of -45 and -46% of N input by leaf and stem residue, respectively (PI -21%). The net N immobilisation for unfertilised rye was -48, -34 and -42% of N input by leaf and stem residue at PI, GR and KÖ, respectively. For unfertilised sunflower -20, -49 and -28% of N input by leaf and stem residue was immobilised at PI, GR and KÖ, correspondingly. Fertilisation decreased the potential N immobilisation at PI and KÖ for all three species and increased the N immobilisation at GR for rye and oats by 23 and 7 percentage points, respectively.
2.3.6.2Net N mineralisation from separated and combined leaf and stem material
The estimated net N mineralisation patterns of leaf and stem material, as well as combined stem and leaf material, were influenced by the residue material and varied between the cover crop species. Differences in N mineralisation of residues between locations appeared in the form of increased N mineralisation from leaf material and reduced N immobilisation from stem material at PI compared with GR and KÖ (Fig. 2.6a-f). After 140 days the potential N mineralisation from leaf material ranged from 2.6 to 22.1, -3.1 to 7.3 and -1.8 to 10.0 kg N ha
-1
at PI, GR and KÖ, respectively (Fig. 2.6a-c). At all locations the majority of N mineralisation from leaf material occurred during winter, within the first 60 days of the simulation. At the end of the simulation in March the cumulative net N mineralisation from unfertilised oats leaf material was 4.8, -2.2 and -1.8 kg N ha-1 at PI, GR and KÖ, respectively and lower than the N mineralisation by unfertilised sunflower (17.9, 3.8 and 7.2 kg N ha-1 at PI, GR and KÖ, respectively).
Fig. 2.6a-f. Net N mineralisation of separate cover crop leaf material (a-c) and stem material (d-f) at the Pillnitz (PI), Groß Radisch (GR) and Köllitsch (KÖ) location.
Fig. 2.7a-f. Proportionate net N mineralisation (a-c) and net N mineralisation (d-f) of combined cover crop leaf and stem material at the Pillnitz (PI), Groß Radisch
(GR) and Köllitsch (KÖ) location.