Article
Economic and Environmental Analysis of Investing in
Solar Water Heating Systems
Alexandru ¸Serban1, Nicoleta B˘arbu¸t˘a-Mi¸su2, Nicoleta Ciucescu3, Simona Paraschiv4 and Spiru Paraschiv4,*
1 Faculty of Civil Engineering, Transilvania University of Brasov, 500152 Brasov, Romania;
2 Faculty of Economics and Business Administration, Dunarea de Jos University of Galati, 47 Domneasca Street, 800008 Galati, Romania; [email protected]
3 Faculty of Economics, Vasile Alecsandri University of Bacau, 157 Marasesti Street, 600115 Bacau, Romania; [email protected]
4 Faculty of Engineering, Dunarea de Jos University of Galati, 47 Domneasca Street, 800008 Galati, Romania;
* Correspondence: [email protected]; Tel.: +40-721-320-403
Academic Editor: Francesco Asdrubali
Received: 26 August 2016; Accepted: 2 December 2016; Published: 8 December 2016
Abstract:Solar water heating (SWH) systems can provide a significant part of the heat energy that
is required in the residential sector. The use of SWH systems is motivated by the desire to reduce energy consumption and especially to reduce a major source of greenhouse gas (GHG) emissions. The purposes of the present paper consist in: assessing the solar potential; analysing the possibility of using solar energy to heat water for residential applications in Romania; investigating the economic
potential of SWH systems; and their contribution to saving energy and reducing CO2emissions.
The results showed that if solar systems are used, the annual energy savings amount to approximately
71%, and the reduction of GHG emissions into the atmosphere are of 18.5 tonnes of CO2over the
lifespan of the system, with a discounted payback period of 6.8–8.6 years, in accordance with the savings achieved depending on system characteristics, the solar radiation available, ambient air temperature and on heating load characteristics. Financially, the installation of SWH systems determines net savings of 805–1151 Euro in a 25-year period in the absence of governmental subsidies. According to the sensitivity analysis, installing a SWH system with subsidies of up to 50% determines the reduction of the discounted payback period to 3.1–3.9 years and the increase of net savings to 1570–1916 Euro. These results indicate that investing in these systems is cost-effective for Romanian households as long as the governmental subsidies increase.
Keywords: solar energy; solar water heating; solar fraction; energy savings; GHG emissions;
sensitivity analysis; governmental subsidies; economic analysis; environmental analysis
1. Introduction
The development of energy production from renewable resources is one of the priority goals of
the European Union [1] in the energy field. The renewable resources development aims to reduce the
import dependence on fossil fuels, and also to reduce CO2emissions. In areas where solar intensity
is high, and the share of fossil fuels in the supply of the domestic hot water is substantial, the solar energy can be used to achieve significant energy savings, as well as a mechanism for sustainable
development [2,3].
Solar systems can cover a significant part of the hot water needs depending on local and
seasonal climatic conditions [4]. They present both economic and ecological benefits. These systems
use renewable energy for water heating and produce no direct emissions with greenhouse effect. Considering the whole life cycle, solar water heating (SWH) systems produce greenhouse gas (GHG) emissions although they are low compared to fossil reference systems, thus contributing to the
reduction of GHG emissions and to the improvement of the air quality locally [5–9]. Moreover, SWH
systems can substantially reduce fossil fuel consumption [10].
Solar water heating systems are a fully mature technology. These systems have been used for several decades to provide heat energy to households. In most cases, solar systems can provide only a certain part of the energy needs, meaning a complementary heating system is required.
More than 50% of dwellings within Romania are individual houses where about 60% of the total inhabitants live. At least 50% of these homes are suitable for solar installation. According to the
Census of Population and Houses from 2011 [11], the average size of a household is lower in urban
areas—2.5 persons/household—compared to rural areas—2.8 persons/household.
Rural population of Romania was approximately 46% of the Romanian population in 2011 [11].
This percentage reveals the potential of replacing the conventional water heating systems with solar
systems in rural areas. Romania has a great potential of solar energy, as shown in Figure1.
Figure 1.Average monthly global irradiation received on a horizontal plane in Romania [12].
The average monthly solar radiation in Romania is very good for solar applications and varies
between 0.9 and 1.46 kWh/m2in the coldest month and between 4.87 and 6.86 kWh/m2in summer [13].
The annual average of daily global solar radiation in Romania is 3.34 kWh/m2. The intensity of solar
radiation is higher in Eastern and Southern Regions of Romania. Despite the excellent solar potential, the use of solar water heating systems in Romania is only of 5%, these systems being installed mainly in new homes.
Thus, the purpose of this paper is to assess the solar potential and to analyse the possibility of using solar energy to heat water for residential applications in Romania. The present paper also aims at investigating the economic potential of solar water heating systems and their contribution to saving
energy and reducing CO2emissions.
2. Solar Water Heating Systems
Energy used for heating water is an important part of total energy consumption in the residential
sector [14]. However, the distribution of energy consumption for various uses of homes cannot be
results either from empirical surveys or approximate calculations based on the analysis of the actual need for hot water of different categories of users. According to these approaches, water heating
accounts for about 20% of the total energy consumption in the domestic sector [15].
The most popular and economical way to use the solar energy is the solar water heating. Due to the small number of system components and since the investment and operating costs are relatively
low, solar water heating systems are suitable for low temperature applications under 50◦
C.
Basically, there are two types of SWH systems: active (with pump) and passive (no pump) [16].
A typically active solar system consists of a collector, storage tank, pump, heat exchanger and an auxiliary heating system. The working fluid may be pure water, glycol, or another fluid with a high specific heat. The main types of solar collectors used in common applications are flat plate collectors and those with vacuum tube. Flat plate collectors are more widely used because of the lower price.
Solar water heating systems with natural circulation (passive systems) are the simplest and most
widely used devices for collection and use solar energy [17]. They are intended to provide hot water
for households and rely on natural circulation or thermosiphon principle. They provide hot water at
a temperature of about 50◦C and consisting of a collector, storage tank and connecting pipes.
A SWH system reduces, but does not eliminate, the need for electric or gas heating water. The performance of a SWH system can be defined by solar fraction. The effective solar fraction of a SWH system depends on the intensity of solar radiation, the technical characteristics of the individual system and the load characteristics.
SWH system is one of the most common application of solar energy utilization system, but their globally installation is not commonly employed due to its high initial cost. Using SWH system will bring economic benefits compared to conventional systems over the long span time. The paper focuses on long-term economic feasibility analysis of SWH systems. SWH systems payback period varies from one region to another, as it depends on many factors such as the price of fossil fuels, the consumption
of hot water, solar radiation, etc. [18].
After studying the specialty literature, we observed a considerable technically development and
application of SWH systems [18–22], in order to assess their contribution to reduction of conventional
energy and greenhouse gas emissions [23], substitute the fossil fuels used in heat production and
increase the exploitation of renewable energy sources. Thus, the intensive research in the field of solar thermal collectors has had the aim to improve the specification of solar thermal collectors to
increase their efficiency within approximately 20 years [24–27]. However, they still have a higher
initial cost than conventional water heating systems, this being a major obstacle to its adoption by low income families and leading to the need for an economic analysis of this system. For this reason, many government authorities have created public policies to encourage the use of these technologies
primarily among the low-income population [5,28–30].
From constructive and functional standpoint, SWH systems are of different types depending on the requirement and location parameters that affect its performance. Mugniera and Selemea (2015) studied these systems based on an innovative and energy efficient concept to optimize solar energy valorisation all year long, showing the high interest of such strategy to combine long term quality,
simplicity of use and economic efficiency [31]. Considering economic and environmental benefits,
SWH system must have an affordable price, especially for low-income families, in order to motivate people to use renewable energy and SWH system. Hence, it is necessary to analyse the economic feasibility of this system.
Over time there were made a series of studies on the economic performance of SWH systems compared to conventional systems that use electricity. Mateus and Oliveira (2009) studied three different locations and climates: Berlin (Germany), Lisbon (Portugal), and Rome (Italy), regarding energy use and economic benefits, according to different local costs for energy (gas, electricity and
water), and highlighting savings in CO2emissions and the optimization of solar collector size and
The majority of studies found that in terms of installation expenditures and energy cost over the total life of the system, solar water heating technology has proven to be cost efficient for several
domestic and industrial applications, this being proved by analyses of the systems performances [16].
This is the reason for the SWH systems widespread usage and applications in both domestic and industrial sectors. Shukla (2013) showed that SWH is not only environmentally friendly but also requires minimal maintenance and operation cost compared to other solar energy applications. SWH systems are cost effective with an attractive payback period of 2–4 years depending on the type and size of the system, and generate extensive researches performed to further improve the thermal efficiency
of solar water heating [33].
In Serbia, Jovanovic et al. (2011) developed a method of multi-criteria analysis in order to analyse possible substitutions of fossil fuel used for hot water production in a heating plant with biomass and solar energy. When the ecological indicator had priority, the Gas + Solar + Biomass and Gas + Solar energy options showed the best level of sustainability. The Biomass energy option was in the group of energy options with low levels of sustainability in this case, due to calculation of the
ecological indicator, and the atmospheric concentrations of CO2emitted have been calculated for
combustion of biomass in life-time of boiler and they assumed that the carbon from biomass is not
entirely “biogenic” [34].
In Polish conditions, Chwieduk (2010) studied active systems with flat plate solar collectors that can be used with good efficiency for many different applications. In Poland, domestic hot water systems are effective during spring and summer, especially from May to the end of August. In average in that time they can provide about 80%–100% of total demand. Economic efficiency expressed by the payback time of active SWH system investment differs depending on the solar system producer
and the fuel/heat source that is substituted, and can range from 6 to 16 years [35]. From the economic
cost-effectiveness analysis of SWH systems, Sawicka-Chudy et al. (2016) found that the simple payback
time of modernization is around 16 years [24].
Argiriou et al. (1997) found a better cost–benefit ratio, a low payback period for SWH systems and
a reduction of CO2emissions by 40% in Greece [36]. Martinopoulos and Tsalikis (2014) demonstrated
in their study in Greece that discounted payback period is strongly influenced by the climatic zone of the building and the type of fossil fuel substituted. In all cases, the solar system covers at least 45% of the total space and water heating loads while the payback period is as low as 4.5 years with an annual
abatement of more than 50 t of CO2in the worst case scenario [37].
In Croatia, Lugari´c et al. (2010) developed a study for choosing the appropriate location for household SWH systems installation, using three investment strategies, varying in financial resources according to profiled income categories of households in the country. Their results show that without using loans or subsidies, net present value varies between 459.32 Euro and 1197.40 Euro, simple payback period between 11 and nine years and internal rate of return between 13% and 19%. When loans and subsidies are considered, net present value varies between 1222.60 and 2034.53 Euro, simple payback period between nine and eight years and internal rate of return between 22% and
52% [28]. The financial analysis of SWH systems installation in six cities from Serbia showed that 20%
subsidy is justified already by CO2mitigation potential of SWH systems, while 50% subsidy reduce
payback period to 5.5–6 years [30].
2.1. Experiences in Solar Water Heating Systems in Europe
The most important application of SWH systems is for heating domestic hot water. In 2013, 94% of the energy provided by SWH systems was used worldwide for heating domestic hot water, 84% mainly by small-scale systems in single family houses and only 10% by larger applications attached to multi-family houses, hotels, schools, etc. Globally, in 2013, SWH systems contributed about
1.2% to the overall domestic hot water and space heating demand in buildings [38].
for space heating and domestic hot water for large housing estates (central solar heating plants with seasonal storage (CSHPSS)) or to supply heat to large multiple dwellings, hospitals, hostels or to the
district heating systems of large housing estates (solar systems with diurnal heat storage) [39,40].
In Europe, Germany is typically at the forefront of alternative energy production. The 2013 capacity of this country to use solar water heating technologies accounted for 3.3% of the global market, and since then it has had the largest number of new installations throughout the European Union. While in Europe considerable progress has been recently made in the development of organic Rankine cycle (ORC) systems for small-scale power generation from solar energy, in Romania the level
of installation of simple solar water heating systems is the lowest in Europe [41,42].
Table1shows that Romania ranks 7th in terms of the number of inhabitants out of the 31 countries
listed. In terms of solar radiation intensity, we can notice that Romania is among the top 10 countries that have large amounts of solar radiation, but despite these favourable conditions, the installed solar collector area per 1000 inhabitants is very low, Romania ranking 29th place. Another very important factor that could be decisive for this situation is the minimum income per month, which in Romania is 237 EUR/month, being among the smallest in Europe, while the European average is 810 EUR/month,
according to the Table1.
Table 1.Total solar collector area installed by the end of 2012 in Europe (revised 2015) (m2).
No. Country Inhabitants
Total Installed Solar Collector
Area (m2)
Installed Solar Collector Area per
1000 Inhabitants (m2/1000 inh.)
Horizontal Radiation (kWh/m2/Year)
Monthly Minimum Wage (EUR)
1 Albania 3,011,405 111,921 37 1604 160
2 Austria 8,221,646 4,929,656 599 1126
-3 Belgium 10,444,268 429,533 41 971 1501
4 Bulgaria 6,981,642 122,100 17 1188 214
5 Croatia 4,475,611 120,000 26 1212 407
6 Cyprus 1,155,403 709,923 614 1886 924
7 Czech Republic 10,609,762 891,738 84 998 360
8 Denmark 5,556,452 684,673 123 989
-9 Estonia 1,266,375 6520 5 960 430
10 Finland 5,266,114 48,502 9 948
-11 France 65,951,611 2,186,269 33 1112
-12 Germany 81,147,265 16,675,320 205 1091 1473
13 Greece 10,772,967 4,122,000 382 1585 684
14 Hungary 9,939,470 236,550 23 1199 358
15 Ireland 4,775,982 271,968 56 949 1545
16 Italy 61,482,297 3,446,766 56 1419
-17 Latvia 2,178,443 4040 1.8 991 370
18 Lithuania 3,515,858 6000 1.7 1001 350
19 Luxembourg 514,862 39,800 77 1037 1923
20 Macedonia 2,087,171 36,890 17 1381 210
21 The Netherlands 16,805,037 864,642 51 999 1502
22 Norway 5,085,582 39,088 7 971
-23 Poland 38,383,809 1,211,500 31 1024 430
24 Portugal 10,799,270 858,995 79 1686 530
25 Romania 21,790,479 110,700 5 1324 237
26 Slovakia 5,488,339 147,000 26 1214 405
27 Slovenia 1,992,690 186,800 93 1115 791
28 Spain 47,370,542 2,962,824 62 1644 757
29 Sweden 9,647,386 450,000 46 934
-30 Switzerland 7,996,026 2,141,490 267 1094
-31 United Kingdom 63,395,574 728,673 11 943 1398
Source: Data extracted from [43–46].
2.2. Rural Energy Program
contribute to environmental goals. Rural areas represent 90% of all territory in the EU 27 and 56% of
the population [47].
In Romania, rural communities face considerable challenges because the income per household
is 30% lower than in urban areas, unemployment tends to be higher too, as does fuel poverty [48].
They need help and support, particularly when it comes to energy choices.
Rural regions in Romania have different characteristics in terms of energy access and use compared to urban areas and they rely more on carbon intensive fuels that include coal, diesel and wood. In some remote areas, the rural inhabitants have no access to electricity supply and gas and therefore they have a more limited choice of energy solutions. Moreover, the rural buildings are relatively old, sub-optimally insulated and equipped with inefficient heating units, so the people from these areas
may face higher energy bills [49].
The distribution of dwellings by type of building, on area of residence are shown in Table2,
which also reveals that in rural areas, single dwelling buildings are predominant, and account for approximately 98% of all buildings.
Table 2.The number of dwellings grouped by type of building, by residence in 2009.
Total Urban Urban Rural Rural
TOTAL dwellings 7,383,643 4,257,683 3,125,960
Single dwellings 4,182,986 1,134,468 26.65% 3,048,518 97.52%
Two dwellings 63,601 41,249 0.97% 22,352 0.72%
3–16 dwellings 439,744 405,702 9.53% 34,042 1.09%
Over 16 dwellings 2,697,312 2,676,264 62.86% 21,048 0.67%
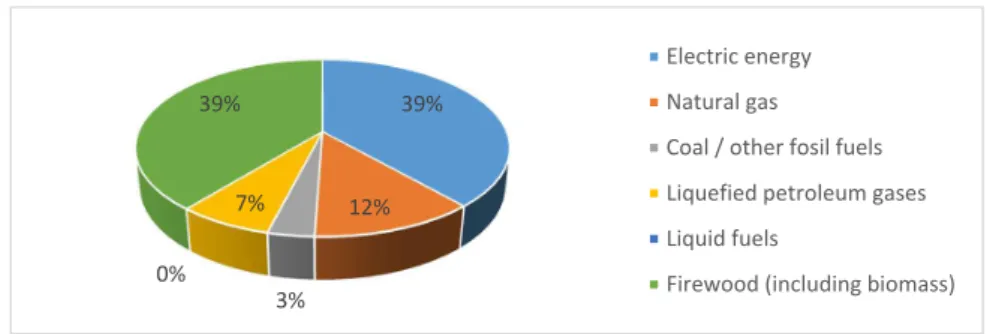
Moreover, Figure2shows that the electricity (39%) and biomass (39%) are the main sources that
meet the energy demand for hot water in the rural areas.
39%
12%
3% 7%
0% 39%
Electric energy
Natural gas
Coal / other fosil fuels
Liquefied petroleum gases
Liquid fuels
Firewood (including biomass)
Figure 2.The structure of houses according to the energy source used for heating water in 2009.
All these above-mentioned factors combined show the great environmental, social and economic potential of transition to cleaner renewable energy sources that are locally available. The rural energy use is important because rural communities have a higher carbon footprint than their urban compatriots and thus are forced to choose high polluting energy sources, such as coal, diesel or wood.
3. Solar Potential Analysis in 52 Romanian Cities
3.1. Climatic Data
Solar energy is a clean source of energy and does not contribute to global warming. The performance of a SWH system is heavily dependent on climatic conditions. The monthly average values data used for simulation of solar water system in 52 locations in Romania were provided by
Retscreen software [13]. The data required are the monthly average of the solar global radiation on
The maximum radiation for the locations included in this analysis occurs in May and June. The timing of this peak roughly coincides with the June solstice when day lengths are maximum and solar heights are their greatest. However, the monthly temperature variations do not follow the changes in radiation exactly. The peak monthly temperatures occur about two months after the net radiation maximum in July and August. This lag is probably caused by the delayed movement of stored heat energy in the ground into the atmosphere. The minimum monthly temperatures occur in January and do not coincide with the lowest values of net radiation, which occur during the December solstice.
3.2. Solar Radiation on a Tilted Surface
In order to design and assess the efficiency of the solar collectors, it is necessary to know solar radiation intensity for that location. Thus, the data related to hourly, daily and monthly average solar radiation that reaches the horizontal and tilted surfaces are essential for designing the solar water
heating equipment [50].
Solar radiation incident on the solar collector surface depends not only on the solar radiation
intensity but also on and the angle made by the collector and the sun [51]. When solar radiation is
perpendicular on absorbing surface of the collector, the power on collector surface will be maximum and equal to that of solar radiation. Because the angle between fixed surface of collector and the sun is changing continuously, the power on fixed surface of the collector is lower than the incident
radiation [52,53].
Because solar collectors are inclined at a certain angle to the horizontal is necessary to determine
the solar radiation incident on their surface [54–57]. The tilted angle of the collector has a major impact
on the solar radiation incident on its surface. The tilt angle of the collector was considered equal to the
latitude of the location, in order to maximize the solar energy collected throughout the year [58–60].
Because the solar collector will be inclined at an angle of 45◦
(the latitude of the locations) from the horizontal, it was necessary to calculate the amount of solar radiation incident on a surface tilted at this angle.
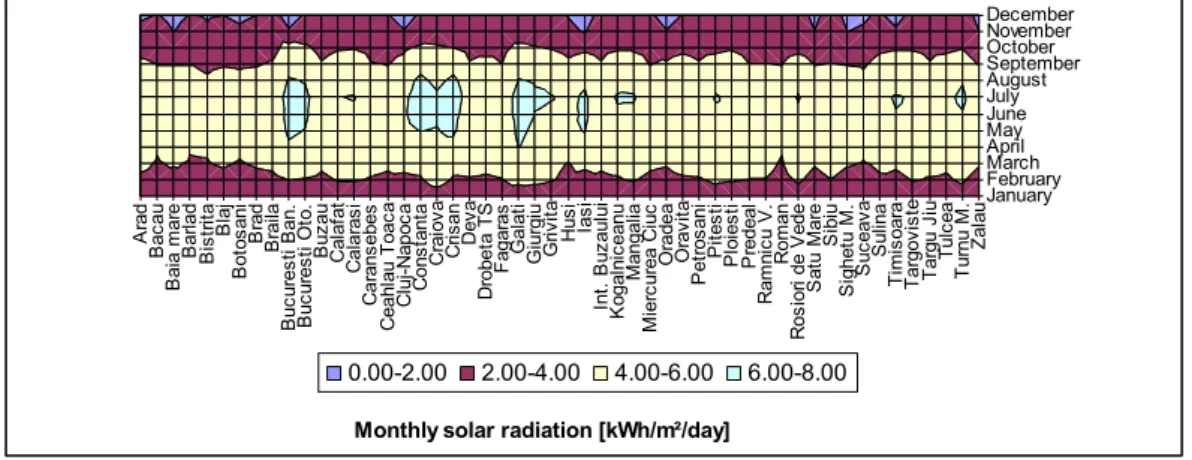
Figure3shows the monthly variation of the power available on the tilted surface of the solar
collector at a 45◦
angle calculated for the locations analysed.
Ar a d Ba c a u Ba ia m a re Ba rl a d Bi s tr it a Bl a j B ot os ani Br a d B ra ila B u cu re st i B a n . B u cu re sti O to . Bu z a u Ca la fa t Ca la ra s i C a rans ebes C eahl au T o ac a C luj -N apoc a C ons tant a C rai ov a Cr is a n De v a D robet a T S F agar as Ga la ti G iurgi u Gr iv it a Hu s i Ia s i Int . B uz aul ui K ogal ni c eanu M ang al ia M ie rc u rea C iuc O rade a Or a v it a P et ros ani Pi te s ti P loi es ti P redeal Ra m n ic u V . Ro m a n R os ior i de V ede S a tu M a re Si b iu S ighet u M . S uc eav a S u lin a T im is oara T a rgov is te T a rgu J iu Tu lc e a T u rnu M . Za la u January February March April May June July August September October November December
Monthly solar radiation [kWh/m²/day]
0.00-2.00 2.00-4.00 4.00-6.00 6.00-8.00
Figure 3.Monthly variation of global radiation on the surface of the solar collector tilted by an angle of 45◦
.
It can be observed that the available power on the solar collector surface for this tilt angle increases throughout the year, even in the cold period. Average daily solar radiation increases from
3.51 kWh/m2/day to 4.15 kWh/m2/day.
a house, in general, do not match each other, the peak solar radiation occurs near noon, but the peak hot water demand is in the late evening or early morning when solar radiation is not available.
Many of these factors are fairly predictable, and thermal energy storage is generally required to couple the time-dependent hot water demands of a residential house with time-dependent solar energy source. The solar water heating system analysed in this study is a thermosiphon system (natural circulation) as the most common and simplest installation in the Romania, it converts energy
of solar radiation to useful energy for sanitary water heating at a temperature of 50–60◦C. The main
components of the system are the solar collector, the hot storage tank and the supporting structure.
Table3presents the basic parameters of the analysed system.
Table 3.Parameters of the solar water system considered.
Parameter Value
Average number of people per house [11] 3
Occupancy rate 100%
Daily hot water usage estimate (rural area) [61] 75 L/day
Hot water temperature 50◦
C
Operating days per week 7
Solar water heater type Glazed
Collector area [13] 2.2 m2
Collector slope 45◦
FR (τα)coefficient [13] 0.69
FRUL coefficient [13] 4.12 W/m2/K
Auxiliary capacity 1.5 kW
Backup water heating electric resistance
SHW initial & installation cost (offer was made by the company Cyclone) [62] €765
Electricity rate [63] 0.126€/kWh
Project life 25 years
Incentives and grants (per cent of initial cost) 0%
Annual O&M cost (per cent of initial installed cost) [64] 1.0% These characteristics of the system were considered in the following calculations.
3.3. Calculation of the Monthly Energy Demand
Domestic hot water consumption depends on many factors, such as consumer habits, sanitation facilities of homes and the energy cost. Demand varies depending on time of day, days of the week and
season [65]. According to the literature, per capita demand for domestic hot water, to an apartment
with a centralized distribution system is between 40 and 80 L/day [66].
However, the use of hot water differs from one household to another and, thus, in most cases, there is a peak in energy consumption in the morning, late afternoon and evening. Within the consumption profile, 45% of the daily energy is used in the late afternoon and evening when occupants get back home from work.
In individual homes, where water is heated on kitchen stoves, the consumption of hot water for sanitary needs is much lower than in homes with centralized system. As the standard of living of these homes is improving, the total consumption of hot water and, thus, the energy demand will increase significantly. Most often the water for sanitary needs is heated using electricity, but a large percentage is still heated on kitchen stoves, with small efficiency, and involves the use of wood or agricultural waste.
For individual homes in rural areas without centralized distribution system, consumption of hot
water between 20 and 25 L/day was considered with an average water temperature of 50◦C [61].
Very good results can be achieved, especially in locations in the southern of Romania, where the sunshine period is the highest during the year. Due to the low cost of installation and maintenance, the passive systems are thus much more cost-effective and, on winter, auxiliary electric heating solutions can be added if need be. Calculation of the monthly energy demand for preparation of domestic hot water is necessary for determining the collection surface and the storage volume. Effective energy demand is calculated as the energy needed to heat water at the specified temperature.
The monthly energy requiredQloadfor heating water is determined as [67]:
Qload =Vw×ρw×Nd×cpw×(Th−Tc), (1)
whereVwis total volume of hot water used in building (L/day);ρwis specific mass of water (1 kg/L);
Ndis number of days in the month;cpwis specific heat of water (kWh/kg/K);This the temperature
required to the hot water (K); andTcis the inlet temperature of cold water (K).
The groundwater supply temperature, which is the inlet temperature of cold water in the solar
collector has simulated as proposed by Arias-Penas et al. (2015) [68].
Required load is proportional to the number of days per week in which the system is used. Regarding the thermal load, although the hot water demand varies from day to day and from one consumer to another, the total demand of heat energy was considered fairly constant throughout the year. This is not very fair during the summer, when consumption is slightly higher. However, at this time, the heat demand for hot water is about as high as in the winter due to the higher temperature of the feed water.
3.4. Solar Collectors Efficiency
Useful energy provided by the solar collector can be calculated with the following formula [57,69]:
Qu =FRA[(τα)It−UL(Th−Ta)], (2)
whereFRis the collector heat removal factor,Ais the area of the collector (m2),Itis the solar radiation
to the plane of the collector (W/m2),(τα)is the product of transmittance and absorbance,Tais the
monthly ambient temperatures of the installation site (K) andULis the heat loss coefficient of the
collector (W/m2).
The efficiency of plane solar collector is:
η=FR (τα)− FRUL(Th
−Ta)
It , (3)
Because solar energy is a time-dependent energy resource, the solar system requires a thermal energy storage.
The energy balance of the water tank storage is:
mcpw
Th=Qu−Qload−(U A)s(Th−Ta), (4)
wheremis mass of water in the tank storage andQloadis energy removed from the tank to the load.
Another indicator related to the performance of the solar water heating system is the solar fraction. The solar fraction is the stake of solar energy in the total load of conventional water heater. The greater is the solar fraction, the greater the solar contribution will be for water heating, which reduces the energy required for the auxiliary system. The solar fraction ranges between 0 and 1.
The solar fractionf is defined as the ratio of the useful solar energy supplied by the system and
the energy required for heating water. Figure4presents the average annual solar fraction of SWH
system for the locations analysed and considering a constant load profile. The average annual solar
55 60 65 70 75 80
ArBadacau
Bai a m are Bar lad Bist
ritaBlaj
Boto saniBradBraila
Bucu rest i Ba n. Buc ures
ti O to. Buz au Cala fat Cal aras i Caran seb es Cea hlau Toaca Cluj -Nap oca Cons tant a Cra iova Cris an Deva Drob eta T
S Faga ras Gala ti Giurg iu Griv ita HusiIasi
Int. Buzau lui Kogal nicea nu Mang alia Mierc urea C
iuc Ora dea Orav ita Petro san i Pites ti
Ploie sti
Pre dea
l
Ramn icuR V.oman
Rosi ori d
e V ede
Sat u Ma
re Sibi
u
Sighe tu M
. Suce ava Sulin a Timis oara Targ ovis te Targ u Jiu
Tulc ea
Turnu M . Zalau S o la r fr a c ti o n [% ]
Figure 4.Predicted solar fraction of SWH system.
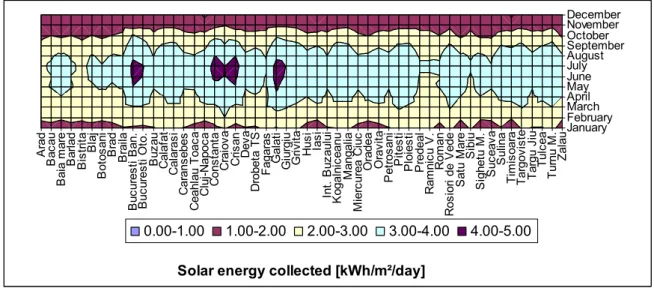
Figure 5 shows the monthly average variation in energy collected for analysed locations.
The figure shows that the maximum energy is collected in July being of 4.36 kWh/m2/day and
the average amount of annually collected energy will be of 2.64 kWh/m2/day. It can be noticed that
in December the incident solar radiation shows a decrease and therefore the energy collected will be
reduced, this having a minimum of 0.88 kWh/m2/day.
Ar a d Ba c a u Ba ia m a re Ba rl a d Bi s tr ita Bl a j B ot os ani Br a d Br a ila B u cu re st i B a n . B u cu re st i O to . Bu z a u Ca la fa t Ca la ra s i C ar ans e bes C e ahl a u T o ac a C luj -N ap oc a C ons tant a Cra io v a Cr is a n De v a D rob et a T S F agar as Ga la ti Gi u rg iu G riv it a Hu s i Ia s i In t. Bu z a u lu i K o gal n ic e anu M anga lia M ier c ur e a C iuc O ra dea Or a v it a P et ros ani Pi te s ti P loi es ti P redeal Ra m n ic u V . Ro m a n R os ior
i de V
ede Sa tu M a re Si b iu S igh et u M . Su c e a v a S u lin a T im is oar a T ar gov is te T a rgu J iu Tu lc e a T ur nu M . Za la uJanuary February March April May June July August September October November December
Solar energy collected [kWh/m²/day]
0.00-1.00 1.00-2.00 2.00-3.00 3.00-4.00 4.00-5.00
Figure 5.Variation of monthly solar energy collected for analysed locations.
Figure6shows that the maximum auxiliary electricity consumed during the year is approximately
2.43 kWh/m2/day in December.
Ar a d Ba c a u Ba ia m a re Ba rl a d Bi s tr ita Bl a j B o tos ani Br a d B ra ila B u cu re st i B a n . B u cu re st i O to . Bu z a u Ca la fa t Ca la ra s i C ar an s ebes C e ahl au T o ac a C lu j-N apoc a C o ns tant a Cra io v a Cri s a n De v a D robe ta T S F agar as Ga la ti G iur gi u G riv it a Hu s i Ia s i In t. Bu z a u lu i K og al ni c eanu M ang al ia M ie rc ur ea C iuc O radea Or a v it a P e tr os ani Pi te s ti P loi es ti P redeal Ra m n ic u V . Ro m a n R os ior
i de V
ede Sa tu M a re Si b iu S ighet u M . Su c e a v a S u lin a T im is oar a T a rgov is te T ar gu J iu Tu lc e a T ur nu M . Za la uJanuary February March April May June July August September October November December
Auxiliary energy [kWh/m²/day]
0.00-0.50 0.50-1.00 1.00-1.50 1.50-2.00 2.00-2.50
Figure 6.Variation of monthly auxiliary energy.
4. Economic and Environmental Impact Analysis
This study aims to determine whether residential solar systems are financially attractive investments for homeowners in the absence of governmental subsidies or other material support or in
the presence of subsidies, on the basis of cash flows estimated as energy savings [30].
4.1. Economic Features
Typically, investors will consider making such investment only if it is profitable. The main objective of evaluation of this investment is to calculate the expected cash flows and the indicators of selecting investments in order to determine whether the investment will be suitable for the investor.
Treated as a financial investment, the attractiveness of residential solar energy systems depends on the following parameters: the initial cost of system, maintenance costs, the lifespan of the system, the amount and form of energy used, the concordance between solar energy captured and load, the cost of the energy consumed using conventional energy and awarded grants.
Investment valuation methods applied in this study include: net present value (NPV), savings to investment ratio (SIR), simple payback period (SPB)/discounted payback period (DPB)/modified discounted payback period (MDPB) and internal rate of return (IRR), in accordance with possible lifespan period of maximum 25 years.
The economic analysis includes the cost of SWH system of 765 Euro being offered by the company
Cyclone and cash flows generated on the exploitation period of maximum 25 years [63]. In this study,
it was considered that all cost of the SWH system was paid entirely at the beginning without taking out any loans. The total capital investment includes all costs incurred to purchase the equipment needed for the SWH system (purchased equipment costs), the costs of labour and materials for installing that
equipment (direct installation costs) and some other costs (indirect installation costs) [70].
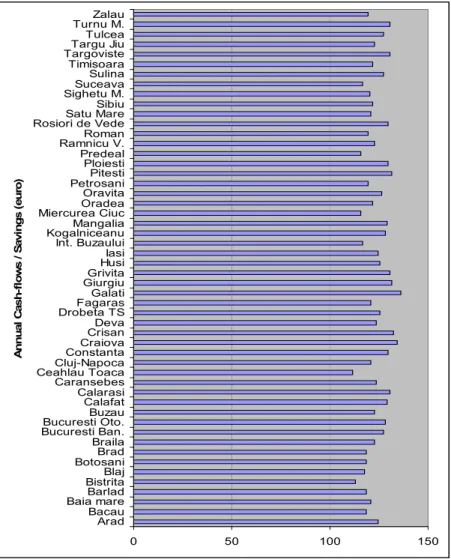
The cash flows represent the savings obtained by using SWH system comparing with the classic
electric systems of heating water. These savings for each city are presented in Figure7. The savings are
referred to the costs of replaced energy (electricity), and were considered constant on the forecasting period that is the lifespan of the SWH system.
0 50 100 150
Arad Bacau Baia mareBarlad BistritaBlaj BotosaniBrad Braila Bucuresti Ban.Bucuresti Oto. Buzau Calafat Calarasi Caransebes Ceahlau ToacaCluj-Napoca ConstantaCraiova CrisanDeva Drobeta TSFagaras Galati GiurgiuGrivita HusiIasi Int. Buzaului KogalniceanuMangalia Miercurea CiucOradea Oravita PetrosaniPitesti Ploiesti Predeal Ramnicu V.Roman Rosiori de VedeSatu Mare Sibiu Sighetu M.Suceava Sulina Timisoara TargovisteTargu Jiu Tulcea Turnu M.Zalau
A
n
n
u
a
l C
a
s
h
-f
lo
w
s
/ S
a
v
in
g
s
(
e
u
ro
)
Figure 7.Annual savings.
4.1.1. Net Present Value and Savings to Investment Ratio
The net present value (NPV) of a stream of payments is defined as the sum of the discounted values of the individual terms in the stream, where each term is discounted to a common reference
date [71]. NPV is the sum of all the future cash flows to determine the present value. Cash flows
include the both inflows (investment cost) and outflows (savings generated on the exploitation period) that are discounted at a rate.
Assuming that our initial investment isI0and savings are net cash flows (CFi) on exploitation
period, where the forecasting period is i = 1÷n, which corresponds to the lifespan of the SWH
system,nbeing 25 years. Assuming thatris the social discount rate of 5% according to the Guide
to Cost–Benefit Analysis of Investment Projects [72], the NPV of the introducing SWH system is
determined by deduction of the present value of savings resulted by the exploitation of the initial investment value in SWH system:
NPV=−I0+
n
∑
i=1CFi
(1+r)i, (5)
Saving to investment ratio (SIR) is used when benefits occur primarily as cost reductions [73].
We can use here SIR because it is recommended for use when debt financing is not present [74].
The formula is:
SIR= NPV
I0 , (6)
where
NPV is the present value of net savings of the activity; and
I0is the present value of the investment costs, without considering replacement costs and also
salvage values.
Calculating NPV and SIR for a lifespan between 1 and 25 years, we found that NPV without subsidies (NPV-S0%) became positive earliest in Year 7 for Galati (21.81 Euro) where the yearly savings are the highest and the investment become profitable, SIR-S0% being of 0.0285, and at the latest in Year 9 for Ceahlau Toaca (21.81 Euro) where the yearly savings are the lowest, and SIR-S0% is only 0.0352. In addition, for an exploitation period of 20 years, the NPV-S0% and SIR-S0% varies between 623.46 Euro and 0.8150 (Ceahlau Toaca), respectively, and 929.58 Euro and 1.2151 (Galati), respectively, and, for a lifespan of 25 years, NPV-S0% and SIR-S0% range between 805.26 Euro and 1.0526, respectively, and 1151.46 Euro and 1.5052, respectively.
A SIR-S0% of 1.5052 registered for Galati, when the lifespan is 25 years, shows that the investment will save 1.5052 Euro on average for every 1 Euro invested, over and above the required rate of return reflected in the discount rate.
4.1.2. Simple Payback Period and Discounted Payback Period
Simple payback period (SPB) is a quick, simple way to compare alternative investments. Simple payback is the number of years necessary to recover the project cost of an investment under
consideration [74]. One drawback to the SPB method is that it ignores the time value of money,
i.e. the use of SPB implies that there are no opportunity costs to the investor and consequently the
investor’s discount rate is zero [75]. However, the simple payback method can be useful if there
are uncertainties, such as uncertain tenure or life of the technology. When there is a high degree of uncertainty associated with future cash flows, SPB gives an indication of how long one’s assumptions
must hold to ensure that at least the principal is returned to the investor [74].
Simple payback periods are determined mainly by the solar radiation intensity in the analysed locations, they are being minimal for areas with high global solar radiation. The minimum value of simple payback period is 5.6 years for Galati and the maximum value of 6.9 years was found for Ceahlau Toaca when considering 0% subsidies. An average simple payback period in the other locations was determined to be approximately 6.2 years. The simple payback period for solar systems installed in Ceahlau Toaca is higher by 22% compared to that of Galati, and by 11% compared to the average SPB registered in all areas.
The discounted payback period (DPB) is the number of years that will pass before the investment
cost is recovered; it is calculated while accounting for the time-value of money [70]. The DPB period
works as a quick assessment of the time period during which an investor’s capital is at risk [74].
The DPB period is determined by:
DPB=
ln
1
1−I0×r
CF
ln(1+r) , (7)
in Ceahlau Toaca is higher by 27% compared to that of Galati, and by 14% compared to the average DPB registered in all areas.
This discounted payback period has some limits in the sense that does not take into account the post-payback period cash flows of investments. If we take into account all cash flows discounted on the lifespan period of SWH system, we can determine the modified discounted payback period (MDPB) as follows:
MDPB= n I0
∑
i=1
CFi
(1+r)i n
, (8)
In this case, we will obtain different MDPB depending on the lifespan period considered in the analysis, between 1 and 25 years. Thus, the minimum value of MDPB is nine years for Galati and the maximum value of 11 years was found for Ceahlau Toaca when considering 0% subsidies and 20 years for lifespan. When the lifespan is considered 25 years, MDPB is 10 years to Galati and 12.2 years to Ceahlau Toaca. These values are higher than DPB because take into account all cash flows actualized until the end of lifespan considered.
4.1.3. Internal Rate of Return
The internal rate of return (IRR) approach determines the discounted rate at which the cumulative NPV of the investment costs would exactly equal the cumulative NPV of all investment benefits if
both are discounted at the internal rate of return [76]. Therefore, the investment with an IRR greater
than the cost of capital is approved [77]. The IRR is the rate that sets the NPV of the cash-flows equal
to zero. The IRR is therefore expressed by:
NPV=0,
n ∑ i=1
CFi
(1+IRR)i −I0=0
(9)
Calculating IRR for a lifespan period between 1 and 25 years, we found that IRR without any subsidies (IRR-S0%) for an exploitation period of 20 years varies between 13.44% (Ceahlau Toaca) and 17% (Galati), and, for a lifespan of 25 years, IRR-S0% ranges between 14% and 17.5%.
According to the results presented above, installing a SWH system without subsidies presents a payback period ranging between 6.8 and 8.6 years. From a financial standpoint, the installation of SHW will determine savings between 1570 Euro and 1916 Euro on a 25-year period.
4.2. Sensitivity Analysis of the Impact of Subsidies
In many developing countries, such as Romania, certain programs have been developed, aiming at improving air, water and soil quality by reducing pollution caused by the burning of wood and fossil fuels used to produce thermal energy for heating and domestic hot water. Thus, these programs stimulate the introduction of the systems that use renewable, non-polluting sources. Grants that have been given for residential solar systems also raise an issue of social justice, because these systems are typically purchased by high-income families. Moreover, because of eligibility conditions, low-income families cannot access these funds, even if subsidies would be 90% of eligible costs. Consequently, subsidies granted in developing countries aimed at encouraging low-income families to adopt these
systems could not achieve their goal, as was the case in Romania [29].
4.2.1. Sensitivity Analysis of the Impact of Subsidies on NPV and SIR
Analysing the impact of changes in the investment cost as a result of grants, we can conclude:
(1) When the subsidies are 15%, NPV-S15% and SIR-S15% became positive earliest in Year 6 for Galati (39.93 Euro, 0.0614) and at the latest in Year 8 for Ceahlau Toaca (69.84 Euro, 0.1074). During a 20-year exploitation period, the NPV-S15% and SIR-S15% vary between 738.21 Euro and 1.1353 (Ceahlau Toaca) and 1044.33 Euro and 1.6060 (Galati), respectively, and, for a lifespan of 25 years, NPV-S15% and SIR-S15% range between 920.01 Euro and 1266.21 Euro, and between 1.4149 and 1.9473, respectively.
(2) When the subsidies are 30%, NPV-S30% and SIR-S30% became positive earliest in Year 5 for Galati (53.21 Euro, 0.0994) and at the latest in Year 6 for Ceahlau Toaca (30.00 Euro, 0.0560). For an exploitation period of 20 years, the NPV-S30% and SIR-S30% vary between 852.96 Euro and 1.5928 (Ceahlau Toaca) and 1159.08 Euro and 2.1645 (Galati), respectively, and, for a lifespan of 25 years, NPV-S30% and SIR-S30% range between 1034.76 Euro and 1380.96 Euro and between 1.9323 and 2.5788, respectively.
(3) When the subsidies are 50%, NPV-S50% became positive in Year 4 for all cities, while SIR-S50% is positive, with a minimum of 0.0329 in Ceahlau Toaca and maximum 0.2606 in Galati. For an exploitation period of 20 years, the NPV-S50% and SIR-S50% vary between 1005.96 Euro and 2.6300 (Ceahlau Toaca) and 1312.08 Euro and 3.4303 (Galati), respectively, and, for a lifespan of 25 years, NPV-S50% and SIR-S50% range between 1187.76 Euro and 3.1052 and 1533.96 Euro and 4.0103, respectively.
We can observe that, for Galati, which is the location with the highest intensity of solar radiation and thus offers the best conditions for SWH installation, NPV increases between 12% and 41% for a 20-year lifespan and between 10% and 33% for a 25-year lifespan, when subsidies increase from 0% to 50%. SIR increases with between 32% and 182%, for a 20-year lifespan and between 29% and 166% for a 25-year lifespan.
4.2.2. Sensitivity Analysis of the Impact of Subsidies on SPB, DPB and MDPB
Analysing the impact of reducing the investment cost as a result of subsidies granted, we found that:
(1) SPB decrease from 5.6 years to 4.8 years (S15%), 3.9 years (S30%) and 2.8 years (S50%) in the area with the highest intensity of solar radiation (Galati) and from 6.9 years to 5.8 years (S15%), 4.8 years (S30%) and 3.4 years (S50%) in the area with the lowest intensity of solar radiation (Ceahlau Toaca). The results show that a reduction of up to 50% in the investment cost determines a reduction of up to 50% in SPB.
(2) DPB decrease from 6.8 years to 5.6 years (S15%), 4.5 years (S30%) and 3.1 years (S50%) in Galati and from 8.6 years to 7.1 years (S15%), 5.6 years (S30%) and 3.9 years (S50%) in Ceahlau Toaca. The results show that a reduction of 50% in the investment cost determines a reduction of 54%–55% in the DPB, depending on the area of installation SWH system.
(3) MDPB was calculated for each strategy for a lifespan between 1 and 25 years in all areas. We also found a decreasing of MDPB when the subsidies increase.
For the area with the highest intensity of solar radiation, the MDPB decreases from nine years to 7.7 years (S15%), 6.3 years (S30%) and 4.5 years (S50%) for 20-year lifespan and from 10 years to 8.5 years (S15%), seven years (S30%) and five years (S50%) for 25-year lifespan, which shows that, when investment cost is reduced by 50% because of subsidies, the MDPB is also reduced by 50%. A similar evolution is registered for all areas included in this study.
4.2.3. Sensitivity Analysis of the Impact of Subsidies on IRR
Analysing the impact of subsidies awarded on IRR we found that:
(1) When the subsidies are 15%, IRR-S15% became positive earliest in Year 5 for Galati (0.0150) and at the latest in Year 6 for Ceahlau Toaca (0.0080). For an exploitation period of 20 years, the IRR-S15% varies between 0.1630 (Ceahlau Toaca) and 0.2040 (Galati) and, for a lifespan of 25 years, IRR-S15% is between 0.1678 and 0.2072, respectively.
(2) When the subsidies are 30%, IRR-S30% became positive earliest in Year 4 for Galati (0.0063) and at the latest in Year 5 for Ceahlau Toaca (0.0133). For an exploitation period of 20 years, the IRR-S30% varies between 0.2029 (Ceahlau Toaca) and 0.2510 (Galati) and, for a lifespan of 25 years, IRR-S30% is between 0.2061 and 0.2530, respectively.
(3) When the subsidies are 50%, IRR-S50% became positive earliest in Year 3 for Galati (0.0329) and at the latest in Year 4 for Ceahlau Toaca (0.0641). For an exploitation period of 20 years, the IRR-S50% varies between 0.2895 (Ceahlau Toaca) and 0.3547 (Galati) and, for a lifespan of 25 years, IRR-S50% is between 0.2908 and 0.3553, respectively.
We can conclude that when the investment costs are reduced by 50% due to governmental subsidies, the IRR increases with ratio between 107.4% and 116.4% for a lifespan between 20 and 25 years for the area where the intensity of solar radiation is the lowest, and between 103% and 109% for the area with the highest intensity. Based on economic indicators, Galati proved to be the best location for installing SWH systems. In all cases, simple payback period was less than seven years.
According to the results of the sensitive analysis, installing a SWH system with subsidies of up to 50% determines the reduction of simple payback period to 2.8–3.4 years. From a financial standpoint, the installation of SWH systems will determine savings between 1570 and 1916 Euro on a 25-year period and internal rate of return between 0.2908 and 0.3553, which shows that investing in SWH systems is cost-effective and feasible as long as the grant percentage increase.
The very high yields produced currently by solar installations have made the savings to investment ratio become more attractive to domestic users. Thus, the investment in a solar system for domestic water heating is recovered in a reasonable period of 6–8 years. Considering the lifetime exceeding 20 years, the implementation of such a system is cost-effective and if we consider the obvious probability in the future of price increase to fossil fuels, it will lead in the future to the increase the return on investment. As the payback period is reduced, the installation of SWH will be more attractive and the savings thus achieved will be higher over the life period of the project.
4.3. Greenhouse Gas Emission Analysis
Although solar energy is considered the cleanest energy source available, interaction with the environment occurs over the whole life cycle of a SWH system (materials, manufacturing,
transportation, use and final disposal or recycling) [15,78]. These interactions can lead to depletion of
natural sources, greenhouse effect, acidification, eutrophication, etc. [79].
We evaluate the environmental impacts associated with greenhouse gas emissions of a solar water heating system during its operation phase. The greenhouse gas (GHG) emissions for the manufacturing and dismantling of the solar water heating system were not included in this analysis. GHG emission reductions are calculated based on the fuel type mainly used at dwellings namely electricity. The GHG
emissions are calculated using the GHG emission factor, which is the level of CO2emitted per unit
input energy. The GHG emission factor depends on the type of fuel used and the efficiency of the energy conversion device used on-site.
In order to estimate emissions from power plants, specific emission factors for each type of pollutant, which depend on fuel characteristics and combustion technology, have been used. Carbon
dioxide (CO2) is a main product from the combustion of all fossil fuels. The CO2emission is directly
related to the carbon content of fuels. Electricity is a significant source of carbon dioxide. Alongside
from fossil fuels combustion for energy and heat production. Other GHGs produced by the energy sector but in relatively low volumes such as SF6, widely used in high-voltage gas-insulated substations were neglected.
Each greenhouse gas has heat-trapping properties. To compare greenhouse gases, they are indexed according to their Global Warming Potential (GWP). This is the ability of a greenhouse gas to trap heat in the atmosphere relative to an equal amount of carbon dioxide. The effects are estimated by
converting these gases into CO2equivalent using the CO2equivalence factors to assess the GWP100.
Carbon dioxide equivalency is a quantity that describes, for a mixture and amount of greenhouse
gas, the amount of CO2that would have the same global warming potential, when measured over
a specified timescale (generally, 100 years) [80].
The GHG emissions of the solar water heating system are calculated in comparison to an electrical boiler. For the electrical boiler an average annual total efficiency of 33% (total efficiency includes the efficiency of the electrical boiler, the grid transmission losses and the average electrical efficiency of the
national power grid) was assumed [81]. Because the CO2emission factor for electrical energy is highly
dependent on the fuel mix, we assume this factor constant although the fuel mix is likely to change in
the future. In this case, CO2equivalent emission for electric backup system is 299.02 g of CO2per kWh
of produced electricity considering the mix of electricity in Romania [64].
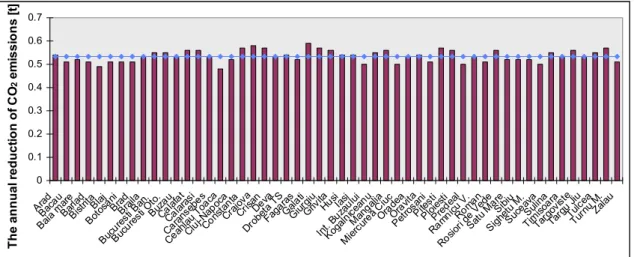
From the viewpoint of environmental protection, it was found that, on average, the emission in the
local atmosphere of an approximate quantity of 0.53 tonnes of CO2each year per household (Figure8),
respectively 13.25 tonnes CO2 during operation period of the SWH system can be avoided [5,82].
As we can see, by using solar energy instead of electrical energy, the production of large amounts of greenhouses gases is avoided.
0 0.1 0.2 0.3 0.4 0.5 0.6 0.7
ArBaadca u
Baia ma
re BarladBistri
ta Blaj Bot
osaniBra d Brai
la
Buc ures
ti B an.
Bucu res
ti O to. Buza u Ca lafat Ca lara si Car ans ebe s Ceahl au To
aca Cluj -Nap oca Co nsta nta Crai ova Cris an De va Drobet a T S Faga ras Ga lati Giur giu Grivi ta HusiIas
i
Int. Bu zaul ui Kogal nicean u Mang alia Mier curea Ciuc OradeaOra
vita Pet ros ani Pites ti Plo iesti Pred eal Ram nicu V. Ro man Ro sior i de Vede Satu Mar e Sibi u Sighet u M . Suce ava Sulina Timi soar a Tar gov iste
Targu J iu Tulc ea Tur nu M. Zalau T h e a n nual r e duct ion of C O2 em is s io n s [ t]
Figure 8.The annual reduction of CO2emissions.
5. Conclusions
The current solar technologies for heating water in Romania have the potential to save about 65%–80% of the energy used for this purpose in all regions. The general trend observed in this analysis is that solar water heating systems that replace conventional systems are more suitable in areas with high solar radiation. Solar heating water can especially be applied to homes and buildings in rural areas, which often have more surfaces available for installing solar collectors than those in urban areas.
For the considered solar water heating system, the operating cost savings compared to an electric water heater is about 70%. The average annual solar contribution to the hot water needs of the household is 76%, while the maximum discounted payback period of system is 8.6 years, and the average savings on lifespan are 1151.46 Euro.
Financial analysis of SWH installation for a typical household indicates that such a system is always profitable, with a simple payback period on investment of 5.6 to 6.9 years without any government subsidy. The greenhouses gases emissions analysis indicates that such a SWH system will
prevent the emission into the atmosphere of about 17 to 20 t CO2over its lifespan. When subsidies
are granted to reduce the investment costs supported by households, then the payback period is reduced considerably and the net present value, savings to investment and internal rate of return increase substantially.
It seems that the only barrier that prevents the penetration of large scale of solar water heating systems in Romania is the lack of understanding among the population of the benefits they provide and financial unattractiveness to poor households. When the population understands all these technology advantages, they accept it easily. In the case of SWH systems, for a payback period of seven years, the benefits are not immediately visible; the energy bill will be reduced, but not fast enough in order to justify the cost of installation, so that governmental subsidies will be an important incentive for beneficiaries.
Economic indicators showed that Galati is the best location for the use of solar systems. From an environmental viewpoint, it was found that, on average, the emissions in local atmosphere of
0.7 tonnes CO2per year can be avoided and the average CO2-equivalent payback period is 16 months.
Although solar water heating systems have great potential for use with subsidies, many families believe that solar water heating systems are too expensive because of the high initial investment costs.
Author Contributions:Alexandru ¸Serban and Spiru Paraschiv analysed experiences in SWH systems in Europe and accomplished the solar potential analysis in 52 Romanian cities; Nicoleta B˘arbu¸t˘a-Mi¸su and Nicoleta Ciucescu performed the economic and sensitivity analysis; Simona Paraschiv analysed similar studies performed, realised the environmental impact analysis of SWH systems and had drawn the conclusions; Nicoleta B˘arbu¸t˘a-Mi¸su wrote the paper.
Conflicts of Interest:The authors declare no conflict of interest.
References
1. European Commission.The European Union Leading in Renewables; ISA: Brussels, Belgium, 2015; pp. 1–28. 2. Dejene, A.H.; Alemayehu, G.; Björn, Z. Solar Water Heating as a Potential Source for Inland Norway Energy
Mix.J. Renew. Energy2014,2014, 968320. [CrossRef]
3. Anri, P.; Surika, R. Investigating The Financial Implications of Alternative Water Heating Systems.Int. Bus. Econ. Res. J.2013,12, 781–792. [CrossRef]
4. Majdi, H.; Nabiha, N.; Issam, A.; Abdelhamid, F. Solar water heating systems feasibility for domestic requests in Tunisia: Thermal potential and economic analysis.Energy Convers. Manag.2013,76, 599–608. [CrossRef]
5. Vanessa, M.T.B.; Racine, T.A.P. Reduction of carbon dioxide emissions by solar water heating systems and passive technologies in social housing.Energy Policy2015,83, 138–150. [CrossRef]
6. Zhang, L.; Xia, J.; Thorsen, J.E.; Gudmundsson, O.; Li, H.; Svendsen, S. Technical, economic and environmental investigation of using district heating to prepare domestic hot water in Chinese multi-storey buildings.Energy2016,116, 281–292. [CrossRef]
7. Fuentes-Cortés, L.F.; Ma, Y.; Ponce-Ortega, J.M.; Ruiz-Mercado, G.; Zavala, V.M. Valuation of water and emissions in energy systems.Appl. Energy2016, in press.
8. Denholm, P. The Technical Potential of Solar Water Heating to Reduce Fossil Fuel Use and Greenhouse Gas Emissions in the United States. Available online: http://images.hw.net/IAPMO/GreenPlumbers_ education_preview/data/downloads/national%20renewable%20energy%20laboratory%20technical% 20report.pdf (accessed on 28 November 2016).
10. Jorge, A.R.F.; Dionicio, R.F.; José, L.F.Z. Potential energy saving in urban and rural house holds of Mexico by use of solar water heaters, using geographical information system.Renew. Sustain. Energy Rev.2016,53, 243–252. [CrossRef]
11. Census of Population and Housing 2011. Statistical Approach of Strategic Importance for Romania: 20–31 October 2011. Available online: http://www.recensamantromania.ro/ (accessed on 5 February 2016). 12. Šúri, M.; Huld, T.A.; Dunlop, E.D.; Ossenbrink, H.A. Potential of solar electricity generation in the European
Union member states and candidate countries.Sol. Energy2007,81, 1295–1305. [CrossRef]
13. RETScreen International. Renewable Energy Project Analysis Software. Available online: http://www.nrcan. gc.ca/energy/software-tools/7465 (accessed on 15 May 2016).
14. Chang, K.C.; Lin, W.M.; Chung, K.M. Sustainable Development for Solar Heating Systems in Taiwan.
Sustainability2015,7, 1970–1984. [CrossRef]
15. Diakoulaki, D.; Zervos, A.; Sarafidis, J.; Mirasgedis, S. Cost benefit analysis for solar water heating systems.
Energy Convers. Manag.2001,42, 1727–1739. [CrossRef]
16. Islam, R.M.; Sumathy, K.; Samee, U.K. Solar water heating systems and their market trends.Renew. Sustain. Energy Rev.2013,17, 1–25. [CrossRef]
17. Soteris, K. Thermal performance, economic and environmental life cycle analysis of thermosiphon solar water heaters.Sol. Energy2009,83, 39–48. [CrossRef]
18. Gautama, A.; Chamoli, S.; Kumara, A.; Singh, S. A review on technical improvements, economic feasibility and world scenario of solar water heating system.Renew. Sustain. Energy Rev.2017,68, 541–562. [CrossRef]
19. Patel, K.; Patel, P.; Patel, J. Review of solar water heating systems.Int. J. Adv. Eng. Technol.2012,III(IV), 146–149.
20. Ogueke, N.V.; Anyanwu, E.E.; Ekechukwu, O.V. A review of solar water heating systems. J. Renew. Sustain. Energy2009,1, 043106. [CrossRef]
21. Sharma, A.; Chen, C.R. Solar Water Heating System with Phase Change Materials.Int. Rev. Chem. Eng.2009,
1, 297–307.
22. Commission European. Widening the Use of European Solar Thermal Technologies in Mediterranean Countries Following the Successful Model of Greece and Cyprus. PART B: I, F, RO, BG, TR. Available online: http://cordis.europa.eu/project/rcn/86979_es.html (accessed on 28 November 2016).
23. Tsilingiridis, G.; Martinopoulus, G. Thirty years of domestic solar hot water systems use in Greece–energy and environmental benefits–future perspectives.Renew. Energy2010,35, 490–497. [CrossRef]
24. Sawicka-Chudy, P.; Rybak-Wilusz, E.; Cholewa, M. Thermal efficiency of a solar power system in a collective residential structure based on performance tests.J. Renew. Sustain. Energy2016,8, 053704. [CrossRef] 25. Tang, R.; Gao, W.; Yu, Y.; Chen, H. Optimal tilt-angles of all-glass evacuated tube solar collectors.Energy
2009,34, 1387–1395. [CrossRef]
26. Zambolin, E.; Col, D.D. Experimental analysis of thermal performance of flat plate and evacuated tube solar collectors in stationary standard and daily conditions.Sol. Energy2010,84, 1382–1396. [CrossRef]
27. Pluta, Z. Evacuated tubular or classical flat plate solar collectors?J. Power Technol.2011,91, 158–164. 28. Lugari´c, L.; Majdandži´c, M.; Škrlec, D. Countrywide Positioning of Domestic Solar Water Heating Systems
Using Risk Analysis and Geographical Information System.J. Mech. Eng.2010,56, 3–17.
29. Green House Program. 2016. Available online: http://www.alternativepureenergy.ro/despre/casa-verde-2016/ (accessed on 1 July 2016).
30. Stevanovic, S.; Pucar, M. Financial measures Serbia should offer for solar water heating systems.Energy Build. 2012,54, 519–526. [CrossRef]
31. Mugniera, D.; Selemea, L.R. Practical successful results regarding electrical overall efficiency for a solar water heating and cooling system in South of France.Energy Procedia2015,70, 474–479. [CrossRef]
32. Mateus, T.; Oliveira, A.C. Energy and economic analysis of an integrated solar absorption cooling and heating system in different building types and climates.Appl. Energy2009,86, 949–957. [CrossRef]
33. Shukla, R.; Sumathy, K.; Erickson, P.; Gong, J. Recent advances in the solar water heating systems: A review.
Renew. Sustain. Energy Rev.2013,19, 173–190. [CrossRef]
34. Jovanovic, M.; Turanjanin, V.; Bakic, V.; Pezo, M.; Vucicevic, B. Sustainability estimation of energy system options that use gas and renewable resources for domestic hot water production.Energy2011,36, 2169–2175. [CrossRef]
36. Argiriou, A.; Klitsikas, N.; Balaras, C.A.; Asimakopoulos, D.N. Active solar space heating of residential buildings in northern Hellas—A case study.Energy Build.1997,26, 215–221. [CrossRef]
37. Martinopoulos, G.; Tsalikis, G. Active solar heating systems for energy efficient buildings in Greece: A technical economic and environmental evaluation.Energy Build.2014,68, 130–137. [CrossRef]
38. International Energy Agency (IEA)-Energy Technology Systems Analysis Programme (ETSAP) and International Renewable Energy Agency (IRENA). Solar Heating and Cooling for Residential Applications; Technology Brief R12. 2015. Available online: http://www.irena.org/DocumentDownloads/Publications/ IRENA_ETSAP_Tech_Brief_R12_Solar_Thermal_Residential_2015.pdf (accessed on 28 November 2016). 39. Bauer, D.; Marx, R.; Nußbicker-Lux, J.; Ochs, F.; Heidemann, W.; Muller-Steinhagen, H. German central solar
heating plants with seasonal heat storage.Sol. Energy2010,84, 612–623. [CrossRef]
40. Schmidt, T.; Mangold, D.; Müller-Steinhagen, H. Central solar heating plants with seasonal storage in Germany.Sol. Energy2004,76, 165–174. [CrossRef]
41. Freeman, J.; Hellgardt, K.; Markides, C.N. An assessment of solar-powered organic Rankine cycle systems for combined heating and power in UK domestic applications.Appl. Energy2015,138, 605–620. [CrossRef]
42. Freeman, J.; Hellgardt, K.; Markides, C.N. An Assessment of Solar–Thermal Collector Designs for Small-Scale Combined Heating and Power Applications in the United Kingdom.Heat Transf. Eng.2015,36, 1332–1347. [CrossRef]
43. Eurostat. Minimum Wages, January 2016 (EUR per Month). Available online: http://ec.europa.eu/ eurostat/statistics-explained/index.php/File:Minimum_wages,_January_2016_(%C2%B9)_(EUR_per_ month)_YB16-II.png (accessed on 28 November 2016).
44. Reinis Fisher. Minimum Wages in European Union. 2016. Available online: https://www.reinisfischer.com/ minimum-wages-european-union-2016 (accessed on 28 November 2016).
45. Mauthner, F.; Weiss, W.; Spörk-Dür, M.Solar Heat Worldwide, Markets and Contribution to the Energy Supply 2013, 2015th ed.; AEE INTEC: Gleisdorf, Austria, 2015.
46. International Data Base of the U.S. Census Bureau. Available online: http://www.census.gov/ipc/www/ idb/country.php (accessed on 28 November 2016).
47. Eurostat. Rural Development Database. Available online: http://ec.europa.eu/eurostat/web/rural-development/data/database (accessed on 28 November 2016).
48. National Institute of Statistics. Household Income and Expenditure in Quarter IV of 2015. Available online: http://www.insse.ro/cms/files/statistici/comunicate/abf/a15/abf_tr4_e15.pdf (accessed on 28 November 2016).
49. Institutul Na¸tional de Statistic˘a, Consumurile Energetice în Gospod˘arii. Available online: http://www.insse. ro/cms/files/publicatii/CENG_publicatie_tabele.pdf (accessed on 28 November 2016).
50. Ionel, L.A.; Cornelia, A.B.; Sonia, D. Estimating Solar Irradiation Absorbed by Photovoltaic Panels with Low Concentration Located in Craiova, Romania.Sustainability2015,7, 2644–2661.
51. Colienne, D.; Michel, J.; Cédric, B. Evaluation of different models to estimate the global solar radiation on inclined surfaces.Renew. Energy2013,50, 710–721.
52. Al-Rawahi, N.Z.; Zurigat, Y.H.; Al-Azri, N.A. Prediction of Hourly Solar Radiation on Horizontal and Inclined Surfaces for Muscat/Oman.J. Eng. Res.2011,8, 19–31.
53. Pandey, C.K.; Katiyar, A.K. Hourly solar radiation on inclined surfaces.Sustain. Energy Technol. Assess.2014,
6, 86–92. [CrossRef]
54. Shyam, S.C.; Rajeev, K.A. Estimation of Hourly Solar Radiation on Horizontal and Inclined Surfaces in Western Himalayas.Smart Grid Renew. Energy2011,2, 45–55.
55. Wong, L.T.; Chow, W.K. Solar radiation model.Appl. Energy2001,69, 191–224. [CrossRef]
56. Duffie, J.A.; Beckman, W.A.Solar Engineering of Thermal Processes, 2nd ed.; John Wiley & Sons: Hoboken, NJ, USA, 1991.
57. Tiwari, G.N.; Dubey, S.Fundamentals of Photovoltaic Modules and Their Applications; The Royal Society of
Chemistry: Cambridge, UK, 2010.
58. B˘alan, M.C.; Jäntschi, L.; Bolboac˘a, S.; Damian, M. Thermal Solar Collector Behaviour in Romania.Pol. J. Environ. Stud.2010,19, 231–241.
![Figure 1. Average monthly global irradiation received on a horizontal plane in Romania [ 12 ].](https://thumb-ap.123doks.com/thumbv2/123deta/6881936.248190/2.892.242.653.453.783/figure-average-monthly-global-irradiation-received-horizontal-romania.webp)