Ogata, H. et al. (Eds.) (2015). Proceedings of the 23rd International Conference on Computers in Education. China: Asia-Pacific Society for Computers in Education
Visualization and Analysis System for
Connecting Relationships of Learning Logs
Kousuke Mouri 1, Hiroaki Ogata2 , Noriko Uosaki3
1,2Faculty of Arts and Science and the Graduate School of Information Science and Electrical Engineering, University of Kyushu, Japan
3Center for International Education and Exchange, Osaka University, Japan
*{mourikousuke, hiroaki.ogata, n.uosaki}@gmail.com
Abstract: In recent years, ubiquitous learning systems based on CSUL (Computer Supported Ubiquitous Learning) and u-learning have been constructed using ubiquitous technologies such as mobile devices, RFID tags, QR codes and wireless networks. These types of learning takes place not only in-class learning but also in a variety of out-class learning spaces such as home, library and museum. However, learning materials provided by ubiquitous learning systems are in most cases, prepared by teachers or instructional designers. It makes it difficult to find relationships between a learner and other learners in different contexts. In order to link learners in the real world and learning logs that are accumulated in a cyber space by a ubiquitous learning system called SCROLL (System for Capturing and Reminding of Learning Log), this paper proposes a visualization and analysis system called VASCORLL (Visualization and Analysis system for COnnecting Relationships of Learning Logs). Using VASCORLL, learners can find other contexts where can be applied to their own learning experiences. The initial evaluation was conducted to examine whether VASCORLL can increase learners’ learning opportunities and learners can apply their own experiences to different contexts.
Keywords: ubiquitous learning log, network graph, time-map, social network analysis
1. Introduction
In recent years, researches in educational engineering have paid attention to ubiquitous learning in order to support education and learning in formal and informal learning, by using ubiquitous technologies such as sensor networks and various pieces of mobile equipment such as smartphones and mobile tablets. For example, CSUL or u-learning has been constructed using ubiquitous technologies such as mobile devices, RFID tags, QR codes and wireless networks (Hwang et al., 2008; Ogata & Yano, 2004). These types of learning takes place not only in-class learning but also in a variety of out-class learning space such as homes, libraries and museums.
For example, Hwang et al. (2008) developed a context aware ubiquitous learning system with the attached RFID tag to the plants. Application domain of their studies is nature science. When a learner arrives in front of the plant, the system will ask him/her questions about its features such as its trunk, shape and color. By answering them, the system will give candidate plants to him/her. Hereby, he/she can understand relationships between knowledge about the plant and the place where he/she learned it.
However, learning contents provided by their systems are prepared by teachers or instructors. It makes it difficult to find relationships between a learner and other learners in different contexts. For example, if a learner learns a word in an informal setting, it might be able to be applied to various learning environments. However, there is no means for him/her to know whether it can be applied to other learning environments or not.
This paper proposes a visualization and analysis system called VASCORLL (Visualization and Analysis system for COnnecting Relationships of Learning Log). VASCORLL works in a
relationships between learners’ contexts in the real world and past learners' contexts in cyber space, and then recommend knowledge that can be applied into other contexts to learners in the real world. By realizing these processes, VASCORLL provides an individual learner with relationships between his/her own experiences and other learners’ experiences in an informal setting, which will increase his/her learning opportunities. This paper describes the design, the implementation and the initial evaluation of VASCORLL.
2. Related Works
2.1 Collocational Network
Collocational networks are two-dimensional networks that contain interlinked collocation, i.e. words that occur together in a text. For example, Willaims et al. (1998) use the network as a corpus linguistic tool in order to create specialized dictionaries. Magnuson and Vanharanta (2003) also describe that it is important to visualize the most central concept in the text. For linguists, the relationships between words are important information. However, for learners in an informal setting it is also important to grasp information such as other learners' nationalities, age, gender, learning places and time connected to what they have learned. VASCORLL could link learners' contexts in real world and past learners' contexts that are accumulated in cyber space.
2.2 Geographical information system and Time-map
A geographic information system (GIS) is a system designed to capture, store, manipulate, analyze, manage, and present all types of spatial or geographical data. By mapping learning information on the map on the system, learners can easily reflect on what and where they have learned. However, previous GIS did not take time line into consideration when learners reflect on what they have learned. To tackle these issues, Johnson and Wilson (2009) developed a visualization tool of handling temporal data within a GIS framework called Time-map. As shown in Figure 1, Time-map consists of the time line and Google Maps. It represents the shift of learning history in accordance with the lapse of time.
Figure 1. Time-map
Learners might forget when and where they have learned before. Therefore, Time-map will remind them of their learning logs recorded during the specified period of time by showing them on the timeline (default: two months before and after the setting time). This visualization method can find individual learning information on the spatio-temporal dimensions, but VASCORLL can find relationships in different contexts among learners by combining Time-map with network graph. 3. System Design
3.1 Design
In this paper, Ubiquitous Learning Log (ULL) is defined as a digital record of what learners have learned in the daily life using ubiquitous technologies. Figure 2 shows the workflow to feedback them after visualizing and analyzing ULLs by VASCORLL in a cyber-physical setting. The workflow shows the following four steps:
Step1. Learners can save their experiences as ULLs with photos and videos using mobile device or desktop PC and SCROLL. The ULL includes the author name, language, time of creation, location (latitude and longitude), learning place and tags. For example, if a learner learns a natto at the supermarket, the saved ULL will be accumulated into the cyber space.
Step2. Learners do not have means to know whether their knowledge can be applied to other learning environments or not. VASCORLL allows learners to find knowledge that can be applied into different contexts, by visualizing and analyzing a large amount of ULLs that are accumulated in the cyber space.
Step3. VASCORLL feedbacks important relationships such as the most frequently learned place and time zone from the results of step 2.
Step4. It is important to recognize who is learning what, and when, where and how, so that learners can understand how their own knowledge is used in other contexts. Therefore, VASCORLL supports learners to apply their own experiences to other contexts.
Figure 2. How SCROLL and VASCORLL works All the above workflow can be supported by SCROLL and VASCORLL.
3.2 LKPTE model
To visualize and analyze several relationships between learners and ULLs, Mouri et al. (2014 & 2015) uniquely defined them in a three-layer s structure.
This paper proposes an analysis model called LKPTE
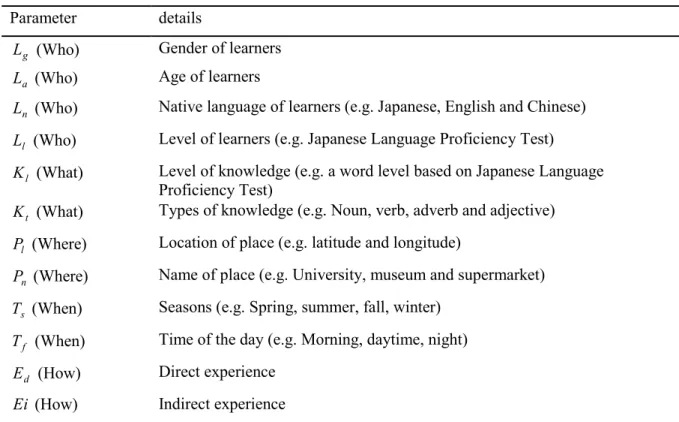
(Learner-Knowledge-Place-Time-Experiences) based on Three-layer structures and LKPTE parameters in Table 1. Using this model, VASCORLL can find the most important relationships between learners in the real world and ULLs that are accumulated in the cyber space. Table 1 shows parameters of the LKPT model.
Learners' parameter L (Who) shows their gender (L ), age (g L ), native language (a L ) and n Japanese Language Proficiency Test level of learners (L ). Using these parameters, VASCORLL can l find other learners similar to the learner.
Knowledge parameter K (What) shows the level of words (K ) decided by JLPT and l knowledge types (K ) such as noun, verb, adverb and adjective. Parameter K is to decide whether t learners level satisfy them when learning other learners experiences.
Parameter P (Where) shows location (P ) and place name (l P ). For example, there is a n possibility that ULLs in same location contain different place names such as university and restaurant. Also, there is a possibility that same place names contain different location. Parameter P distinguishes ULLs in different contexts, so that VASCORLL can detect learner contexts in the real world and ULLs in cyber space.
Parameter T (When) shows the seasons (T ) and the time zone (s T ). For example, the most f learners have learned morning glory flowers in the morning. But, a learner has learned a morning glory flower in the daytime. Generally, most people regard morning glories as flowers which bloom in the morning, but there are kinds of morning glories which are in bloom until the daytime actually. Therefore, VASCORLL will detect relationships between knowledge and place in different times. By providing their relationships, learners can grasp information regarding time of other experiences.
Parameter E (How) shows direct experiences (E ) and indirect experiences ( Ei ). Direct d experience (E ) denotes experience gained through sense perception. Indirect experience ( Ei ) denotes d experience gained through others. Learners can save others’ indirect experiences as “Relog” using SCROLL. According to Kolb (1984), he described that it is important to directly experience. By revealing relationships between direct experiences and indirect experiences, VASCORLL can change learners from watcher to doer by using a learning system based on task-based learning (Mouri et al., 2013).
To reveal the distance between learners and ULLs, this paper measures distance of edges using cosine similarity. This paper defines the following vectors V (1) based on the parameters of LKPTE i model.
Vi={L ,g L , a L , n L , l K , l K , t P , l P , n T , s T , f E , Eid } (1) Table 1: LKPTE parameters
Parameter details
L (Who)g Gender of learners L (Who)a Age of learners
L (Who)n Native language of learners (e.g. Japanese, English and Chinese) L (Who)l Level of learners (e.g. Japanese Language Proficiency Test)
K (What)l Level of knowledge (e.g. a word level based on Japanese Language Proficiency Test)
K (What)t Types of knowledge (e.g. Noun, verb, adverb and adjective) P (Where)l Location of place (e.g. latitude and longitude)
P (Where)n Name of place (e.g. University, museum and supermarket) T (When)s Seasons (e.g. Spring, summer, fall, winter)
T (When)f Time of the day (e.g. Morning, daytime, night) E (How) d Direct experience
Ei (How) Indirect experience
3.3 Recommendation Algorithm based on Social Network Analysis
VASCORLL analyzes using social network analysis as shown in Table 2 in order to reveal the most central relationships among ULLs that are accumulated in the cyber space.
Table 2: Social network analysis Network algorithm Details
Degree (D ) i The number of edges a node has in a network Closeness (C ) i The distance of a node to all other in the network
Betweenness (B ) i The number of shortest paths between any two nodes that pass via a given node
However, there is a possibility that too many ULLs might be detected in all network algorithms. To avoid having learners get confused, it is necessary to establish some criteria. In order to recommend an efficient and appropriate amount of learning information, this paper defines the following algorithm.
n
i
i i i i
i P B C D
R
1
)
( (2)
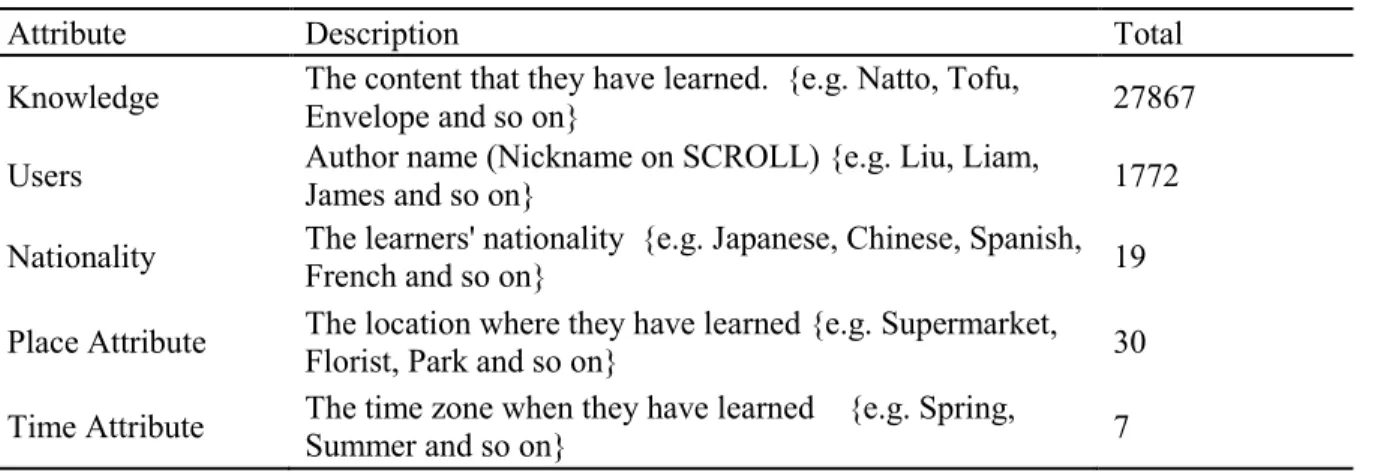
In this formula (2), B shows Betweenness centrality, i C shows Closeness centrality and i D i shows Degree centrality. Recommendation candidate R shows the sum of output results of each i algorithm. N shows the number of ULLs that are accumulated in cyber space. To date as shown in Table 3, there are 27,867 ULLs, 1772 users, 19 native language and 30 place attributes. By using the algorithm, learners can obtain recommendation candidate averagely including characteristics of three network analysis algorithms.
Table 3 Learning data in SCROLL
Attribute Description Total
Knowledge The content that they have learned. {e.g. Natto, Tofu,
Envelope and so on} 27867
Users Author name (Nickname on SCROLL) {e.g. Liu, Liam,
James and so on} 1772
Nationality The learners' nationality {e.g. Japanese, Chinese, Spanish,
French and so on} 19
Place Attribute The location where they have learned {e.g. Supermarket,
Florist, Park and so on} 30
Time Attribute The time zone when they have learned {e.g. Spring,
Summer and so on} 7
4. Implementation
This section describes ways of the implementation of VASCORLL. VASCORLL is divided to visualization and analysis interface.
4.1 Visualization system
4.1.1 The layout types of the network graph
Figure 3. The layout of network graph
The network graph layout consists of using three basic layouts and an original layout we developed.
The first layout consists of using the random network as shown in Figure 3(1). It is a simple algorism generating them randomly on the graph after filtering some nodes, and then VASCORLL will link related node and node.
The second layout consists of using force-directed layout as shown in Figure 3(2). It is a force vector algorithm proposed in the Gephi software, appreciated for its simplicity and for the readability of the network it helps to visualize (Mathieu et al., 2014).
The third layout consists of using Yifan Hu multilevel layout as shown in Figure 3(3). It is a very fast algorithm to reduce the complexity. The repulsive forces on one node from cluster of distant nodes are approximated by Barners-Hut calculation, which treats them as one super-node (Hu, 2005).
The final layout consists of using the original layout we have developed as shown in Figure 3(4a). Based on learner’s target word, the original layout will be categorized four areas as shown in Figure 3(4b). By using the original layout, learners can grasp relationships regarding the target word that they want to know.
4.1.2 System interface for visualizing ULLs
The interface combining network graph and time-map for visualizing complex relationships among ULLs is shown in Figure 4 (left). It contains of the following components:
Search & layout form: Learners will input target word they want to know and will choose one layout in select form (e.g. Random layout, Force-directed layout, Yifan layout and original layout).
Network graph: The network graph shows the layout calculated by LKPTE model, and the layout in Figure 4 (left) shows a sample of the original layout. Figure 4 (right) shows the enlarged network graph. In the case of this figure, learners can grasp that the target word (natto) is the most similar to tofu by calculating based on LKPTE model and cosine similarity as described section 2.2. Similarly, learners can grasp that the natto is the most similar to some contexts such as Supermarket (the place where they frequently learns about natto) and night (the time zone when they frequently learns about natto).
Time-Map: Learners might forget their learning logs when and where they have learned before. Therefore, the system will remind them of their learning logs recorded during the specified period of time by showing them on the timeline (default: two month before and after the setting time). Also, the network graph and time map functions are linked each other. For example, if a learner clicks a certain node on the network graph, the time map will show the location and time corresponding to it. Therefore, learners can obtain its location and time information.
Figure 4. Visualization interface
4.2 Analysis interface
Figure 5 shows the analysis interface of VASCORLL.
Figure 5. Analysis interface
Firstly, learners will conduct some filtering works in Figure 5(1) in order to find relationships between themselves and other learners. For example, if learners want to find relationships among learners whose native language is Japanese, they will check "Japanese" in checkbox on Filtering item. Hereby, VASCORLL will be set to find ULLs of learners whose native language is Japanese. Similarly, VASCORLL allows them to set filtering according to such parameters as gender, age, knowledge (e.g. noun, verb, adverb and adjective) and learning place (e.g. University and Supermarket).
After filtering, VASCORLL provides relationships among ULLs to learners as shown in Figure 5(2). Figure 5(2) shows relationships among international students whose native language is Chinese.
knowledge in different contexts as shown in Figure 5(3). For example, there is a ULL where an international student learned "fan" at the university in the past. It means “扇風機” (mechanical fan) in Japanese. There is another ULL where another international student learned the same word, "fan" in a different context in the past. In this case it means “うちわ” (Uchiwa is a round, flat paper fan with a wooden or plastic handle.)" in Japanese. Even if the English word is the same, the meaning might be different if the context is different. By using VASCORLL, they can learn such relationships that they cannot obtain from textbook-learning.
5. Evaluation
5.1 Method
This study group consisted of 12 international students who were studying at the University of Tokushima and Kyushu University participated in the evaluation experiments. They were from China and Mongolia aged between 21 and 34. Their length of stay is from 1 month to 5 years.
The students were divided into two groups; Group A (experimental group) and Group B (control group). Each group consisted of 3 Chinese students and 3 Mongolian students. Group A learned vocabularies in their daily lives using SCROLL with VASCORLL system for one week. Group B learned vocabularies in their daily lives using SCROLL without VASCORLL for one week. Both groups used their own smart phones (iPhone or Android device) by which they recorded their ULLs in formal and informal settings anytime and anywhere. The mobile devices used in the evaluation experiment were four iPhone 4s, five iPhone 5s, and three Samsung Galaxy Note 3s. The objective of this evaluation was to examine whether VASCORLL can increase students’ learning opportunities and whether learners can apply their own experiences to different contexts.
After the evaluation, the participants were asked to complete a five-point-scale questionnaire, in which they evaluated its performance, and usability, as well as the ease of understanding and discovery of ULL by using VASCORLL system.
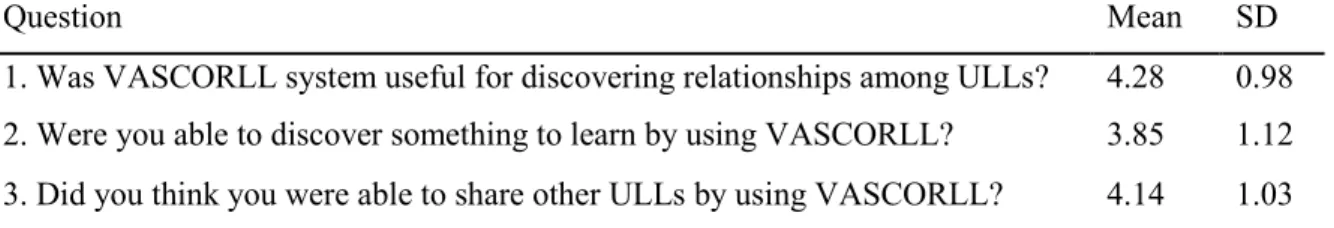
5.2 Result and discussion
The questionnaire result is shown in Table 4. The highest mean score was 4.28 when the subjects were asked whether VASCORLL was useful for discovering relationships among ULLs. The response to Q1 indicates that they were able to discover relationships among ULLs. Also, some students commented that VASCORLL was helpful to find relationships among some words in different contexts. The response to Q2 to Q3 indicate that students were able to share them and discovering something to learn by using VASCORLL.
Table 4: Result of the five-point-scale questionnaire for Group A
Question Mean SD
1. Was VASCORLL system useful for discovering relationships among ULLs? 4.28 0.98 2. Were you able to discover something to learn by using VASCORLL? 3.85 1.12 3. Did you think you were able to share other ULLs by using VASCORLL? 4.14 1.03
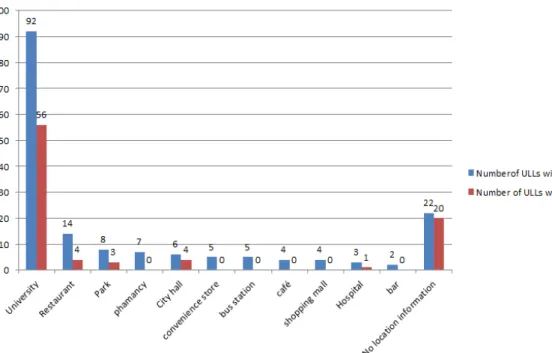
Figure 6 shows the number of ULLs saved in different learning place during the evaluation experiment. In total, students of Group A saved 176 ULLs and students of Group B saved 88 ULLs. This means that students' learning opportunities are increased by using VASCORLL. Compared with Group B without VASCORLL, students of Group A were able to apply their own ULLs into different learning place by using VASCORLL. Especially, they were able to apply their own knowledge in the university as shown in Figure 6. The rate of the learning opportunities in the university compared with Group B is increased 1.64 percent. In addition, students of Group A compared with group B were able to apply their own knowledge at various learning places such as pharmacy, convenience store and shopping mall.
Figure 6. Number of ULLs saved in different learning place
Figure 7 shows the number of ULLs saved in different time zones during the evaluation experiment. The rate of the learning opportunities of Group A is 2.68 percent higher than that of Group B during the daytime. Similarly, the rate of the learning opportunities was 1.77 percent higher during the night. Though we had expected that providing recommendations based on what they have learned in the morning would increase their learning opportunities, it did not. It was found that most students preferred learning in the daytime or night. Therefore, it is necessary to attract their interest in the morning learning. As our future work, we will consider this issue.
Figure 7. Number of ULLs saved in different time zones 6. Conclusion
In order to link learners in the real world and learning logs accumulated in cyber space by a ubiquitous learning system called SCROLL, this paper proposes a visualization and analysis system called
contexts to learners in the real world. According to the initial experiment,VASCORLL was effective for finding other contexts which can be applied to their own learning experiences. Consequently, VASCORLL succeeded in increasing learners’ learning opportunities.
In the future, the use and evaluation of VASCORLL will continue. Our next consideration is to support international students who aim to take JLPT (Japanese Language Proficiency Test) and to enhance their Japanese language skills by using VASCORLL. Also, we will apply not only life-long learning but also other mobile learning domains, e.g. CSCL (Computer Supported Collaborative Learning) and Seamless learning.
Acknowledgements
This part of this research work was supported by the Grant-in-Aid for Scientific Research No.25282059, No.26560122, No.25540091 and No.26350319 from the Ministry of Education, Culture, Sports, Science and Technology (MEXT) in Japan. The research results have been partly achieved by
“Research and Development on Fundamental and Utilization Technologies for Social Big Data” (178A03), the Commissioned Research of National Institute of Information and Communications Technology (NICT), Japan.
References
Hwang, G. J., Tsai, C. C. & Yang, S. J. H. (2008). Criteria, strategies and research issues of context-aware ubiquitous Learning, Educational Technology and Society, 11(2), 81-91.
Kolb, D. A. (1984). Experiential learning: Experience as the source of learning and development, vol. 1. Englewood Cliffs, NJ: Prentice-Hall.
Li, M., Ogata, H., Hou, B., Uosaki, N., & Yano, Y (2012). Personalization in Context-aware Ubiquitous Learning-Log System, Mobile and Ubiquitous Technology in Education, 41-48.
Ogata, H. & Yano, Y. (2004). Context-aware support for computer-supported ubiquitous learning, IEEE International Workshop on Wireless and Mobile Technologies in Education, 27-34.
Ogata, H., Li, M., Bin, H., Uosaki, N., El-Bishoutly, M., & Yano, Y. (2011). SCROLL: Supporting to share and reuse ubiquitous learning logs in the context of language learning, Research and Practice on Technology Enhanced Learning, 6(3), 69-82.
Ogata, H., Hou, B., Li, M., Uosaki, N., Mouri, K & Liu, S. (2014). Ubiquitous Learning Project Using Life-logging Technology in Japan, Educational Technology and Society Journal, 17(2), 85-100.
Williams, G. (1998). Collocational Networks: Interlocking Pattern of Lexis in a Corpus of Plant Biology Research Articles, International Journal of Corpus Linguistics 3, 151-171.
Magnusson, C. & Vanharanta, H. (2003). Visualizing sequences of texts using collocational networks, In Proceedings of the 3rd international conference on Machine learning and data mining in pattern recognition, Leipzig, Germany: Springer-Verlag, 276-283.
Johnson I. and Wilson A (2009). The TimeMap Project: Developing Time-Based GIS Display for Cultural data, Journal of GIS in Archaeology 1, 123-135.
Shane, D., Dragon, G., George, S. and Srecko, J. (2014). Current State and Future Trends: A Citation Network Analysis of the Learning Analytics Field, International conference on Learning Analytics and Knowledge (LAK 2014) ACM, pp.231-240.
Mouri, K., Ogata, H., Li, M., Hou, B., Uosaki, N., & Liu, S.(2013). Learning Log Navigator: Supporting Task-based Learning Using Ubiquitous Learning Logs, Journal of Research and Practice on Technology Enhanced Learning (RPTEL), 8(1), pp.117-128.
Mouri, K., Ogata, H., Uosaki, N. and Liu, S. (2014). Visualizaiton for analyzing Ubiquitous Learning Logs, Proceedings of the 22nd International Conference on Computers in Education (ICCE 2014), 461-470. Mouri, K., Ogata, H. and Uosaki, N. (2015). Ubiquitous Learning Analytics in the Context of Real-world
Language Learning, International conference on Learning Analytics and Knowledge (LAK 2015) ACM, 378-382.
Mathieu, J., Tommaso, V., Sebastien, H and Mathieu, B. (2014). ForeceAtlas2, a Continuous Graph Layout Algorithm for Handy Network Visualization Designed for the Gephi Software, in PLOS One 9(6):e98679. doi: 10.1371/ journal. pone. 0098679, Jun 10.
Hu, Y.F. (2005). Efficient and high quality force-directed graph drawing, The Mathematica Journal, 10(1), 37–71.