Correlation between strategies use and English
proficiency in the context of Japanese senior high school
高校生の学習ストラテジーと学力との相関関係
Kazuya Sawada
本稿では、Strategy Inventory for Language Learning(SILL)〔日本語版〕による高校生の 学習ストラテジーと全国規模の模擬試験による学力との相関関係を調査した。この模擬試験 は高校2年生対象の大学入試に必要となる基礎的、あるいは応用的な、学力を見るものであ る。SILLのスコアを独立変数に、模擬試験のスコアを従属変数に用いた。主成分分析でどの ようなストラテジーを被験者が持つかが明らかになった。重回帰分析により、主成分分析で 抽出したいくつかのストラテジーの組み合わせと、模擬試験成績との間の有意な相関関係が 検出された。SILLのパート別ではPart Cと学力の相関が顕著に見られた。続けて行われた判 別分析で成績の上位、下位の判別に大きく貢献しているSILLの項目が明らかになった。
Literature Review
According to Hsiao and Oxford (2002, p. 368), “Since the 1970s, considerable research attention in second or foreign language (L2) learning has been devoted to studying individual differences in language learners. One individual difference variable — L2 learning strategies, has gained increasing popularity among researchers and teachers interested in understanding how languages are learned.” They explain learning strategies as follows:
Weinstein and Mayer (1986) stated that learning strategies are “behaviors or thoughts that a learner engages in during learning that are intended to influence the learner’s encoding processes” (p. 315). According to Oxford, they are “operations employed by the learner to aid the acquisition, storage, retrieval, and the use of information…: specific actions taken by the learner to make learning easier, faster, more enjoyable, more self-directed, more effective, and more transferable to new situations” (Oxford, 1990, p.8).
Referring to Chamot et al. (1999), Hsiao and Oxford claimed learning strategies can be taught to L2 learners. They also claimed, “Such instruction has proved to be most successful when it is tied to the language tasks that students are normally expected to accomplish and when
strategies are explicitly taught” (Hsiao & Oxford, p. 369).
Research on the good learner has led to research on strategic differences between competent and less competent language learners.
Green and Oxford (1995, p. 261) related strategy use to gender as well as to L2 proficiency level and included analysis of variation on the use of individual strategies on the Strategy Inventory of Language Learning (SILL), (Oxford, 1990). They found greater use of learning strategies among more successful learners and higher levels of strategy use by women than by men.
Green and Oxford explored the relationships between the SILL, L2 proficiency, and gender based on a sample of 374 students in Puerto Rico. They stated (p. 262), “Language learning strategies are specific actions or techniques that students use, often intentionally, to improve their progress in developing L2 skills.” They went on to say, “Language learning strategies enable students to gain a large measure of responsibility for their own progress, and there is considerable evidence that effective strategy use can be taught.”
Strategy use in L2 is related to proficiency or achievement. Early research on good language learners (Naiman, Frohlich, & Todesco, 1975) suggested this link. More recently, many quantitative studies have underscored the significant relationship between L2 learning strategies and language proficiency (Cohen, 1998). Dreyer and Oxford (1996) showed that Part C and Part D of SILL correlated with the TOEFL scores of their participants.
According to Green and Oxford, MacIntyre (as cited in Green and Oxford, 1995, p. 263) highlighted the importance of affective factors and links the use of a given language learning strategy with task demands, proficiency, aptitude, situation, attitude, motivation, previous success, anxiety, self-confidence, sanctions against strategy use, goals, and criteria for success.
O’Malley (1987, p. 133) discussed the importance of teaching strategies as follows:
By implication, less competent learners should be able to improve their skills in a second language through training on strategies evidenced among more successful language learners. With successful training, less competent learners should be able to apply strategies to the acquisition of a variety of different language skills and transfer the strategies to similar language tasks.
Few studies have examined what factors are seen in proficient learners’ strategies and what distinguishes successful learners and not successful learners. My interest here is in the prediction of what kind of learner strategy use will lead to great improvement in proficiency in an EFL environment. I would like to consider learner strategies, especially ones toward classroom tasks in learning that might better predict successful learners.
Research Questions
1 What are some factors of EFL learner strategies possessed by a sample of Japanese EFL learners?
2 What are the strategies that best explain achievement in language learning?
Method
Participants
A total of 80 EFL students (27 girls, 53 boys) of the second year at a private high school participated in this research. Their academic standard is one of the nation’s highest. Our statistics have shown that most students at this level have passed Japan’s most prestigious universities. Their average TOEIC score for the September, 2004 test was approximately 577, which is very high for this age group. My earlier research showed that most of the participants were intrinsically motivated and enthusiastic about studying English because it could satisfy their intellectual curiosity. Throughout the entire reading course of the school year 2004, the students were encouraged to guess the meaning of new words from the context before they consulted a dictionary and also they were encouraged to write their own ideas about a passage they read or listened to approximately once a week. Unlike in a traditional Japanese high school English class, they were always told to answer English questions in English. They were advised to listen to English outside class using whatever was available. In their regular classes, they were given basic information about word formation, especially regarding prefixes and suffixes.
Materials
The investigation used a Japanese translation of the ESL/EFL version of Oxford’s SILL to measure the students’ use of L2 learning strategies. (See Appendix.) It specifies that there are six strategy factors, each of which is represented by a specific set of strategy items: (a) memory strategies (items 1 to 9), (b) cognitive strategies (items 10 to 23), (c) compensation strategies (items 24 to 29), (d) metacognitive strategies (items 30 to 38), (e) affective strategies (items 39 to 44), and (f) social strategies (items 45 to 50).
According to Brown, Robson, and Rosenkjar (2001), “the SILL is the most reliable of the available strategy questionnaires,” though they admit there is criticism about the SILL’s theoretical background.
Using Cronbach alpha, the reliability of the SILL for this sample was found to be .886,
which is a little lower than usual, but I think this is because of the relatively small variation in proficiency or attitude toward learning English itself among the students who participated in this research.
Theorists expect the use of L2 learning strategies to be associated with proficiency. According to Hsiao and Oxford (2002), this association has been obtained in numerous SILL investigations. For instance, in Green and Oxford’s (2000) study, 78% of the variance in subtest scores on a standardized English proficiency test was explained by the SILL, indicating that the SILL can provide a powerful predictor of success in language learning.
The participants sat for a nation-wide mock examination in October 2004, which is similar to the typical university entrance examination and requires reading and listening comprehension of long passages and English translation of Japanese sentences. This test was used to divide the group into two levels, higher and lower, in terms of proficiency.
Procedure
In order to obtain data for this study, the Z scores of the nation wide mock examination which the participants sat for in October, 2004 were gathered. The SILL was administered in Japanese in January 2005 under the supervision of the participants’ English teacher. It took approximately 30 minutes to administer it. Firstly, a principal component analysis (PCA) was performed to describe the underlying characteristics of language learning strategies of this sample. Secondly, by using the Z scores on the proficiency test as dependent variable and the factor scores extracted in the PCA as independent variables, multiple regression analysis was conducted to examine the correlation between the proficiency and the factors of learners’ strategies exemplified in the principal components. Also the correlation between proficiency and the scores of some items on the SILL was computed to examine which items or parts were more highly correlated with proficiency. Finally in an attempt to find the strategies that divide the students into two groups, higher and lower, on the mock examination, a discriminant function analysis was conducted.
Statistical analysis
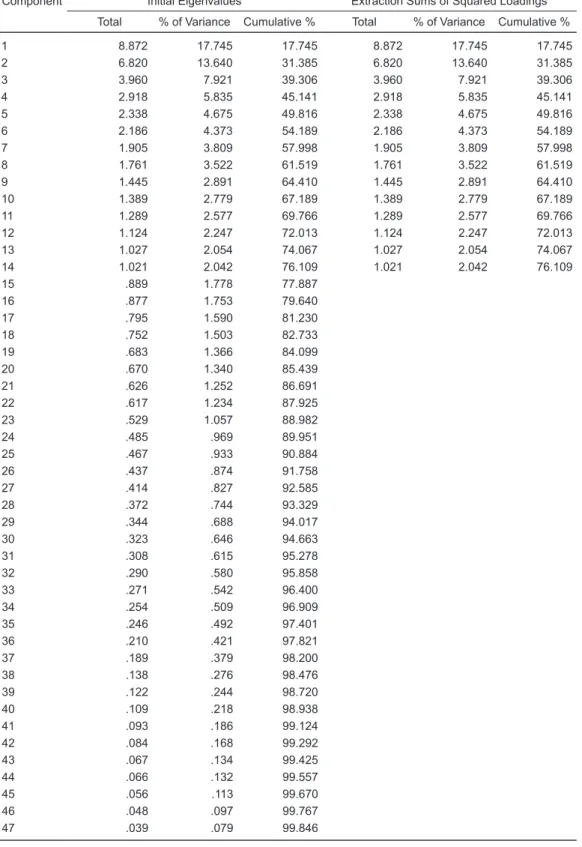
As shown in Table 1, in the principal component analysis, 14 principal components were extracted. Of the fourteen, the first three principal components were examined.
Table 1 shows that 14 principle components are extracted.
Table 1: Total Variance Explained
Component Initial Eigenvalues Extraction Sums of Squared Loadings Total % of Variance Cumulative % Total % of Variance Cumulative %
1 8.872 17.745 17.745 8.872 17.745 17.745
2 6.820 13.640 31.385 6.820 13.640 31.385
3 3.960 7.921 39.306 3.960 7.921 39.306
4 2.918 5.835 45.141 2.918 5.835 45.141
5 2.338 4.675 49.816 2.338 4.675 49.816
6 2.186 4.373 54.189 2.186 4.373 54.189
7 1.905 3.809 57.998 1.905 3.809 57.998
8 1.761 3.522 61.519 1.761 3.522 61.519
9 1.445 2.891 64.410 1.445 2.891 64.410
10 1.389 2.779 67.189 1.389 2.779 67.189
11 1.289 2.577 69.766 1.289 2.577 69.766
12 1.124 2.247 72.013 1.124 2.247 72.013
13 1.027 2.054 74.067 1.027 2.054 74.067
14 1.021 2.042 76.109 1.021 2.042 76.109
15 .889 1.778 77.887
16 .877 1.753 79.640
17 .795 1.590 81.230
18 .752 1.503 82.733
19 .683 1.366 84.099
20 .670 1.340 85.439
21 .626 1.252 86.691
22 .617 1.234 87.925
23 .529 1.057 88.982
24 .485 .969 89.951
25 .467 .933 90.884
26 .437 .874 91.758
27 .414 .827 92.585
28 .372 .744 93.329
29 .344 .688 94.017
30 .323 .646 94.663
31 .308 .615 95.278
32 .290 .580 95.858
33 .271 .542 96.400
34 .254 .509 96.909
35 .246 .492 97.401
36 .210 .421 97.821
37 .189 .379 98.200
38 .138 .276 98.476
39 .122 .244 98.720
40 .109 .218 98.938
41 .093 .186 99.124
42 .084 .168 99.292
43 .067 .134 99.425
44 .066 .132 99.557
45 .056 .113 99.670
46 .048 .097 99.767
47 .039 .079 99.846
Component Initial Eigenvalues Extraction Sums of Squared Loadings Total % of Variance Cumulative % Total % of Variance Cumulative %
48 .030 .061 99.907
49 .029 .058 99.965
50 .018 .035 100.000
Extraction Method: Principal Component Analysis.
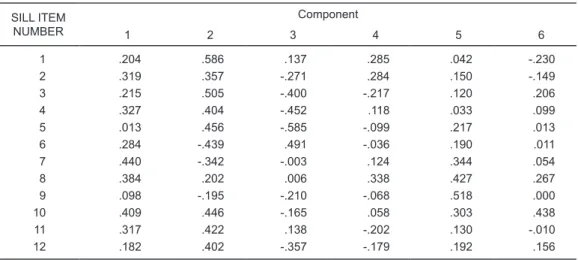
As can be seen in Table 2, Component 1 received good loadings of more than 0.500 from items 14,15,16,17,25,26,28,30,36,39, and 41. This factor is the largest component of language learning strategies for this sample. This is basically about their positive attitude in using the English language in a meaningful way, which includes trying to find time to read English and making a habit of writing English.
The second main component was about general cognitive strategy, such as reasoning and analyzing, where learners try to fill the gap with the knowledge they have or by inference. This factor received good loadings from items 1,3,22,23,24,27,29, and 31. This factor includes effective communication strategies, such as trying to guess what the other person is going to say.
The third main component indicated analytical thinking for vocabulary learning and planning for language learning in general. This factor received good loadings from items 6,19,21,33,34, and 42. However, the scores on each one of the three factors did not significantly correlate with the mock examination scores.
Therefore 6 principal components, which had Eigenvalues of more than 2 were analyzed as a follow-up analysis.
Table 2 shows six major components and loadings from 50 variables.
Table 2: Component Matrix(a) SILL ITEM
NUMBER
Component
1 2 3 4 5 6
1 .204 .586 .137 .285 .042 -.230
2 .319 .357 -.271 .284 .150 -.149
3 .215 .505 -.400 -.217 .120 .206
4 .327 .404 -.452 .118 .033 .099
5 .013 .456 -.585 -.099 .217 .013
6 .284 -.439 .491 -.036 .190 .011
7 .440 -.342 -.003 .124 .344 .054
8 .384 .202 .006 .338 .427 .267
9 .098 -.195 -.210 -.068 .518 .000
10 .409 .446 -.165 .058 .303 .438
11 .317 .422 .138 -.202 .130 -.010
12 .182 .402 -.357 -.179 .192 .156
SILL ITEM NUMBER
Component
1 2 3 4 5 6
13 .301 .489 .355 .151 .185 -.121
14 .708 -.291 -.002 .211 .068 .027
15 .456 .247 .072 -.116 -.426 .119
16 .617 -.494 -.015 .386 -.068 -.150
17 .549 -.685 -.005 .117 -.016 .038
18 .301 .377 -.189 .160 .014 .095
19 .173 .210 .437 -.193 .378 -.213
20 .342 .252 .367 .047 .209 -.290
21 -.026 .310 .572 .207 -.118 -.073
22 .066 .510 .099 .322 -.112 -.390
23 .038 .528 .304 .231 -.181 -.391
24 .038 .602 -.204 .354 .113 .216
25 .639 -.017 -.173 -.047 -.305 .135
26 .578 -.301 -.117 .062 .247 .002
27 .153 .674 .014 .373 .055 .007
28 .499 .116 .056 .198 -.075 -.326
29 .355 .518 -.163 -.238 -.235 .167
30 .609 .161 -.269 -.221 -.359 -.011
31 .343 .501 .494 -.154 -.008 -.040
32 .467 .433 .084 -.390 -.210 .128
33 .327 .136 .585 -.115 -.082 .307
34 .143 -4.143E-06 .472 .371 -.064 .539
35 .760 -.347 -.034 .102 -.257 .105
36 .657 -.322 -.041 .305 -.249 -.119
37 .234 .358 .398 .076 -.172 .241
38 .495 -.249 -.028 .276 .088 .221
39 .659 .065 -.082 -.013 -.003 -.379
40 .326 .239 -.293 -.197 .047 -.393
41 .509 .102 -.052 -.279 .210 -.262
42 .020 -.128 .486 -.242 .315 -.036
43 .510 -.674 -.032 .147 .235 -.110
44 .506 -.203 -.091 -.370 -.052 -.216
45 .474 -.332 .034 -.063 -.152 .141
46 .466 .099 .257 -.467 .136 .082
47 .426 -.118 -.075 -.534 -.054 -.154
48 .392 .029 .383 -.429 .239 .216
49 .654 -.094 -.235 .115 .126 -.016
50 .558 -.009 .010 -.004 -.356 .092
Extraction Method : Principal Component Analysis a 14 components extracted.
As a follow-up analysis, a multiple regression was conducted by using the factor scores of the 6 principal components as independent variables and the mock exam score as a dependent variable. As seen in Table 3, the result showed that the combination of the 6 did correlate with the proficiency scores represented by the examination. The correlation coefficient was computed to be at a significant level. This result indicaties those who tend to use the strategies that showed
good loading on the 6 components are likely to get higher scores on the proficiency test.
Table 3: Model Summary Correlation between Principal Components 1-6 and proficiency
Model R R Square Adjusted R Square Std. Error of the Estimate
1 .453(a) .205 .135 21.64911
a Predictors: (Constant), REGR factor score 6 for analysis 1, REGR factor score 5 for analysis 1, REGR factor score 4 for analysis 1, REGR factor score 3 for analysis 1, REGR factor score 2 for analysis 1, REGR factor score 1 for analysis 1
b Dependent Variable: MOCKZ c Statistically significant at .013
The correlation between Part C and Part D scores on the survey of the SILL and the scores on the mock examination was also computed because the two parts include strategies I often refer to in class. Table 4 shows that in this research Part C correlated with the same dependent variable—mock examination results with a significant level at .027, although the correlation between Part D and the mock examination was statistically insignificant. However, the correlation between the 11 strategies I have been teaching and the result of the mock examination was significant at 0.01level. The 11 strategies are as follows:
6 I use flashcards with the new word on one side and the definition or other information on the other.
15 I watch TV shows or movies or listen to the radio in the new language.
21 I find the meaning of a word by dividing the word into parts which I understand. 22 I read without looking up every unfamiliar word.
23 I skim the reading passage first to get the main idea, then I go back and read it more carefully.
24 I try to understand what I have heard or read without translating it into my own language.
27 When I do not understand all the words I read or hear, I guess the general meaning by using any clue I can find, for example, clues from the context or situation.
28 I try to guess what the speaker is going to say next.
30 I try to find out all I can about how to be a better language learner by reading books or articles, or by talking with others about how to learn.
32 When someone is speaking the new language, I try to concentrate on what the person is saying and put unrelated topics out of my mind.
40 I try to use the language without fearing making mistakes.
Table 4: Correlation between Part C of the SILL and proficiency
Model R R Square Adjusted R Square Std. Error of the Estimate
1 .573 .328 .210 24.55483
a. Predictors: (Constant), VAR00029, VAR00026, VAR00024, VAR00028, VAR00025, VAR00027 b. Dependent Variable MOCK Z scores
Statistically significant at 0.027
Further in order to investigate the link between strategies use and success in learning English at high school, a discriminant function analysis was followed to predict group membership, high or low. Before using the SPSS DISCRIM, univariate outliers were checked using the SPSS EXPLORE. No extreme values were found. The remaining data were then checked for multivariate outliers using Mahalanobis distance in the SPSS REGRESSION. None were found. Homogeneity of variance-covariance matrices was tested using the Box M statistics in the SPSS MANOVA. The Box M statistic was not significant, indicating that there was no serious problem in this study with homogeneity of variance-covariance matrices.
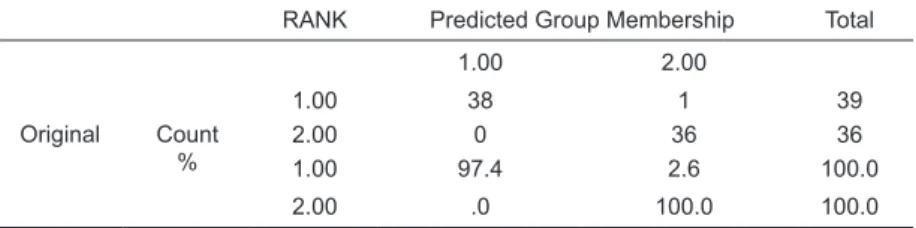
Table 5,6, and 7 shows the Eigenvalues, Wilks’ Lambda, and classification results from DISCRIM respectively. The classification was impressive because the prediction failed only in one case.
Table 5: Eigenvalues
Function Eigenvaluee % of Variance Cumulative % Canonical Correlation
1 4.882(a) 100.0 100.0 .911
a First 1 canonical discriminant functions were used in the analysis.
Table 6: Wilks’ Lambda
Test of Function(s) Wilks’ Lambda Chi-square df Sig.
1 .170 85.050 50 .001
The p value being .001< .05, there is a significant difference between the two groups.
Table 7: Classification Results(a)
RANK Predicted Group Membership Total
Original Count
%
1.00 2.00
1.00 38 1 39
2.00 0 36 36
1.00 97.4 2.6 100.0
2.00 .0 100.0 100.0
a 98.7% of original grouped cases correctly classified.
Table 7 indicates some items on the SILL are very powerful predictors for grouping the levels of learners.
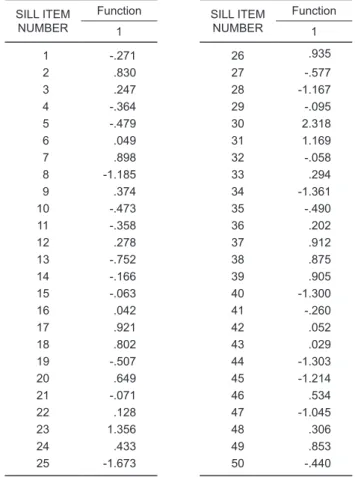
In the Discriminant Function Analysis, the items whose absolute values are great contribute a great deal in dividing the two groups. Some items in the next table are important in distinguishing the two groups. As Table 8 illustrates, the loadings for predictor variables on discriminant function showed that items 17(taking notes in English), 23(trying to capture outline when reading), 30(trying to increase opportunities to use English), and 31 (trying to learn from my own mistakes) are important strategies that contribute to proficiency. These strategies are about using English as often as possible and learning from mistakes, which is closely related to what I taught explicitly in class.
Table 8: Standardized Canonical Discriminant Function Coefficients SILL ITEM
NUMBER
Function SILL ITEM
NUMBER
Function
1 1
1 -.271 26 .935
2 .830 27 -.577
3 .247 28 -1.167
4 -.364 29 -.095
5 -.479 30 2.318
6 .049 31 1.169
7 .898 32 -.058
8 -1.185 33 .294
9 .374 34 -1.361
10 -.473 35 -.490
11 -.358 36 .202
12 .278 37 .912
13 -.752 38 .875
14 -.166 39 .905
15 -.063 40 -1.300
16 .042 41 -.260
17 .921 42 .052
18 .802 43 .029
19 -.507 44 -1.303
20 .649 45 -1.214
21 -.071 46 .534
22 .128 47 -1.045
23 1.356 48 .306
24 .433 49 .853
25 -1.673 50 -.440
Discussion
Although the correlation between each of the six factors extracted in the PCA and
proficiency was non-significant, the combination of the 3 main principal components have a correlation with achievement with statistical significance. This implies as earlier studies have shown that students classified as higher level learners in the mock examination use the combination of various strategies to achieve language proficiency. Descriptive statistics show that the items describing the strategies which I taught explicitly were used and most of them contributed to the division of the two levels, high and low, as the DISCRIMINANT FUNCTION ANALYSIS in this research showed. There was a significant correlation between strategies I taught, which are basically about using and taking in a large amount of English, and the mock examination result. It may sound a matter of course but regrettably instruction using English is not often practiced in the current Japanese education system.
The teacher’s job is to encourage learners to use such strategies which are effective for attainting proficiency. Part C of the SILL has a high correlation with the mock examination. Part of the reason should be that I emphasize using strategies described in items 24 and 27. Twenty four is ‘guess the meaning of new words from the context’ and 27 is ‘continue reading when they see new words without consulting a dictionary.’
An important issue here is that systematic training of strategy use could enhance motivation to study more and play a role as a springboard to make more efforts. Chamot, Barnhardt, and Robbins (1996, p. 178) suggest that having access to appropriate strategies should lead students to higher expectations of learning success, a crucial component of motivation. Self-control over strategies should lead to enhancement of motivation in classroom activity too. As Chamot, Barnhardt, and Robbins claim, this type of self-control may be enhanced if strategy instruction is combined with metacognitive awareness of the relationship between strategy use and achievement in learning.
Conclusion
The findings of this study support a few suggestions that have been made about language learning strategy use. The data extracted by factor analysis indicate that the largest strategy factor in English learning among the Japanese EFL students is basically their positive attitude in using the English language in a meaningful way, which includes trying to find time to read English and making a habit of writing English. The second factor is about general cognitive strategy, such as reasoning, where learners try to fill the gap with the knowledge they have or by inference. Factor 3 indicates the learners analytical thinking about vocabulary and figuring out a way to learn English more efficiently. The discriminant function analysis that followed showed that some
items that appeared in the first factor and a combined use of some items on the SILL can predict learners’ success in a proficiency test. The strategy of using context in guessing the meaning of words or sentences was most highly correlated with the achievement shown in the mock examination.
The limitation of this study is a relatively small sample size. Also the data were gathered only in one school where the motivation is rather high because of the entrance examinations that all of them will take in the near future. The results obtained in this research are not necessarily true of other Japanese EFL contexts. And the study should be followed by a long term, introspective method to further understand the construct of language learning strategy and reach a more useful classroom intervention.
Considering the characteristics that each group of learners have, the teacher must think of strategies to enhance language learning and study the nature of learners’ strategies that lead to unabated motivation to keep making an effort. The strategies which enhance learners’ motivation should be empirically studied over time.
One strategy does not always work for everyone. Researchers on strategies should also take individual differences in learning styles or perceptual preferences or motivation orientation into consideration. To make strategy study more relevant to the classroom, further study should also consider the combination of strategies that works best for each individual learner.
References
Brown, J.D., Robson, G., & Rosenkjar, P. (2001). The development and validation of a Portuguese version of the motivated strategies for learning questionnaire. In Z. Dornyei & R. Schmidt (Eds.), Motivation and second language acquisition (pp. 361-398). Honolulu: Second language Teaching & Curriculum Center University of Hawai‘i.
Chamot, A. et al. (1999). The learning strategies handbook. White Plains, NY: Addison Wesley Longman.
Chamot, A., Barnhardt, S., & Robbins, J. (1996). Methods for teaching learning strategies in the foreign language classroom. In R. Oxford (Ed.), Language learning strategies around the world: Cross- cultural perspectives (pp.167-173). Honolulu: Second language Teaching & Curriculum Center University of Hawai‘i.
Cohen, A. (1998). Strategies in learning and using a second language. New York: Addison Wesley Longman.
Dreyer, C. & Oxford, R. (1996). Learning strategies and other predictors of ESL proficiency among Afrikaans speakers in South Africa. In R. Oxford (Ed.), Language learning strategies around the world: cross-cultural perspectives (Tec. Rep. No. 13, pp. 61-74). Honolulu: Second language Teaching
& Curriculum Center University of Hawai‘i.
Green, J., & Oxford, R. (1995). A closer look at learning strategies, L2 proficiency, and gender. TESOL
Quarterly, 29, 261-297.
Green, J., & Oxford, R. (2000). At the theoretical crossroads between ESL and EFL: Predicting English proficiency and exploring learning strategies in Puerto Rico. Manuscript submitted for publication.
Hsiao, T.-Y. & Oxford, R. (2002). Comparing theories of language learning strategies: a confirmatory factor analysis. Modern Language Journal, 86, 368-382.
LoCastro, V. (1994). Learning strategies and learning environments. TESOL Quarterly, 28, 409-414. MacIntyre, P. (1994). Toward a social psychological model of strategy use. Foreign Language Annuals,
27, 185-195.
Naiman, N., Froehlich M., Stern, D., & Todesco, A. (1987). The good language learner. Toronto, Canada: Ontario Institute for Studies in Education.
O’Malley, J. (1987). The effects of training in the use of learning strategies on learning English as a second language. In A. Wenden and J. Rubin (Eds.), Learner strategies in language learning (pp.133-144). Cambridge: Cambridge University Press.
Oxford, R. (1990). Language learning strategies: What every teacher should know. Boston: Heinle. Oxford & Nyikos (1989). Variables affecting choice of language learning strategies by university students.
Modern Language Journal, 73, 291-300.
Oxford, R., & Shearin, J. (1994). Language learning motivation: Expanding the theoretical framework. Modern Language Journal, 78 (1), 12-28.
Weinstein, C. & Mayer, R. (1986). The teaching of learning strategies. In M. Wittrock (Ed.), Handbook of research on reaching (3rd ed., pp. 315-327). New York: Macmillan.
APPENDIX
THE STRATEGY INVENTORY FOR LANGUAGE LEARNING (SILL) Part A
₁ 新しく学んだ英語の知識を、すでに知っている知識と関連付けて覚えようとしている。
₂ 記憶を促進するために、新しい単語は文章の中にいれ、その文章ごと覚えようとしてい る。
₃ 記憶を促進するために、単語を覚えるときには、その単語の発音とその単語のイメージ
(心の中でその単語に対して抱く気持ち)を結び付けようとしている。
₄ 単語を覚えるときには、その単語が使われている周囲の状況、前後の文脈を一緒に覚える ようにしている。
₅ 単語を覚えるときには、その単語が持つリズム、アクセントを利用して覚えるようにして いる。
₆ 単語を覚えるときには、単語カードの様なものを作り、これを利用して覚えるようにして いる。
₇ 単語を覚えるときには、体全体を動かしながら覚える。(例えば、手や足でアクセントを 付けたり、その語の意味を体で表したりする。)
₈ 覚えた単語をよく復習する。
₉ 単語を覚えるとき、その単語がテキストや単語帳のどの辺りに出ていたとか、などの情報 を利用して覚える。
Part B
10 新しい単語に出会ったときは、その単語を何度も声に出して読んだり、書いたりする。 11 英語を話すときや音読するときは出来るだけネイティブスピーカーの発音、イントネーシ
ョン、話し方をまねるようにしている。 12 英語の発音を練習する。
13 知っている単語をいろいろな場面、文脈、組み合わせ、あるいは用法で使おうとしている。 14 自ら進んで英語で会話をスタートするようにしている。
15 英語の映画やテレビ・ラジオ番組を見たり、聞いたりするようにしている。 16 趣味で英語の読書をしている。
17 英語でメモを取ったり、日記、手紙、レポートを書いたりするようにしている。
18 英語の本などを読むときに、まずさっと目を通し、大雑把な意味を捉えた後で、もう一度 元に戻って丁寧に読むようにしている。
19 新しい単語に出会ったときには、その単語によく似た発音、形を持った、日本語の単語を 思い浮かべて記憶するようにしている。
20 英語の中に見られる「規則性」、「決まり事」などを自分で見つけようとしている。 21 知らない単語は、いくつかの部分に分解し、その部分ごとの意味から全体の意味を類推す
るようにしている(例:lovelyという単語を「愛」と「副詞を作る語尾」のように分けて意 味を類推する)
22 英語を読んだり、聞いたりするときには、一語一語の理解よりも、大きな意味のかたま り」ごとの理解を優先させるようにしている。
23 英語を読んだり、聞いたりするときには、「あらすじ」、要点を把握するようにしている。
Part C
24 知らない単語に出会ったら、すぐに辞書を引かずその単語の意味を類推するようにしてい る。
25 英語で話している最中に適当な語句、表現が浮かんでこないときはジェスチャーを使って 相手に意志を伝えるようにしている。
26 英語でコミュニケーションするときに適当な語句、表現が浮かんでこないときには、単語 を自分で作って意志を伝えるようにしている。
27 英語を読むとき、知らない単語をすべて辞書で調べたりせず、文脈より類推して続けるよ うにしている。
28 相手が次に何を言うか、発言内容を予想しながら英語を聞くようにしている。
29 英語でコミュニケーションをする際に、適当な語句、表現が浮かんでこないときには、別 のよく似た知っている語句、表現に置き換えて意志を伝えるようにしている。
Part D
30 英語を使う機会を出来るだけ増やそうとしている。
31 自分の英語の誤りに注目し、その誤りから学ぼうとしている。
32 周囲で英語が聞こえたらそちらに自分の注意を向けて話の内容を聞き取ろうとしている。 33 どうすれば英語がよりよく学べるか、その方法を考えたり見つけようとしたりしている。 34 英語学習の時間を出来るだけ増やせるように、自分の時間をやりくり、調整している。 35 英語で話す相手を積極的に探そうとしている。
36 英語で読書する機会を出来るだけ多く持とうとしている。 37 英語学習の明確な目標を持ち、その目標に向けて努力している。
38 自分の英語学習の進み具合、到達度をチェックする機会を持つようにしている。
Part E
39 英語を使う際には、出来るだけリラックスするよう心がけている。 40 間違いを恐れずに英語を使うようにしている。
41 うまく英語が使えたときや英語の成績が向上した時には、自分自身を「ほめたり」、自分 に褒美を与えたりしている。
42 英語を使う際に、自分が緊張していることに気がつく。
43 英語学習の際に生じた自分の気持ちや感情を日記やメモなどに書き留めるようにしてい る。
44 英語学習の際に感じる喜びやフラストレーションを他の学習者や友人と話し合うようにし ている。
Part F
45 英語を使った授業、英会話、英語の聞き取りなどの際に発言内容がわかりにくいときは、 発話のスピードを落としてくれるよう頼んだり、もう一度繰り返してくれるように頼んだり する。
46 自分の英語の誤りをネイティブスピーカー、英語の先生、英語の上手な友人らにチェック してもらうようにしている。
47 他の学習者と一緒に英語の学習をしたり、学習を助け合ったりしている。
48 ネイティブスピーカー、英語の先生、英語の上手な友人らに、英語学習の手助け、助言を
求めるようにしている。
49 英語の授業や英語に関する質問は、日本語でなく英語でするように心がけている。 50 英米人の文化的背景、英語圏の文化・歴史・制度などを学ぶように心がけている。