Introduction
Globalization faces some difficulties now. Because the economic disparity between the super rich and the poor has widen. Immigrants from poor country to rich country have expanded. Refugees from conflict areas to safe countries have continued. Confl icts and crisis on some geopolitical borders have happened. The movement of appealing populism and nationalism has covered over the world. And the destroy of international laws and economic theory has developed for a quarter of century. The crisis National Security is threatening Globalization. The increase of Nationalism also is threating Globalization. Russia and China invades other country and territory though they are members of Security Council of the United Nations. Even the US acts on basis of President s emotion, Brexit of the UK and Re-negotiation of NAFTA of the US seems to oppose Globlization. Needless to say, National Security is basis on Globalization. Globalization is cracking now. At the view of these angles, I research on Globalization from three section. Section one is on Rise and Flourish of Globalization. Section 2 is on Japan. Section 3 is on Globalizations facing diffi culties. I would like to consider all over the world from the last quarter to the present.
1. Globalization Brings Benefits to the World:
population doubled, economy four times
Globalization Expands Population of the World
Globalization benefi ts the world s economy. Firstly population of the world has increased about 1.5 times from 5.3 billion 1990 to 7.3 billion 20151. In other words, Graph 1 indicates that the world population of 1987 reached 5 billion. The population of 1987 reached 6 billion. The population of 1998 reached 7 billion. Globalization has prompted to liberalize the movement of people, goods, service and capital. At the result of Globalization, people of the world become middle class and are able to give a birth to children with confi dence. Therefore, the world population is increasing sharply each year.
Globalization Dramatically Increased the World Economy
The GDP of the world, indicating by Graph 2, tripled from USD 23,472 billion in 1990 to USD 74,199 billion in 20152. Because Globalization, needless to say, removed barriers of boarders, and gradually benefited by the movement of people, goods, services and capital. Globalization used educated cheap waged workers from ex-Socialism countries. The game has changed. Companies in advanced countries use a Outsourcing". Outsourcing means that companies entrust a job out of all processing to cheap waged ex-Socialism countries like China, India, and Poland etc. Companies in advanced countries has also been able to use Supply Chain Management3". By a measure of a Supply Cain Management, companies have no inventory and can Introduction
1 . Globalization Brings Benefi ts to the World: population doubled, economy four times 2 . Recession and Recovery of Japan: Heisei recession
3 . Globalization Faces Diffi culties: facing the present and danger Conclusion
Haruo N
AKATSUKACracking Globalization:
rise, fl ourish, and diffi culties
1 United Nations Statistic Data Base web, , accessed in 13 August 2017. 2 IMF Database web, , accessed in 13 August 2017.
make everything on demand, example for personal computer of Dell. Furthermore, companies also do not have own factory, and use EMS; Electronics Manufacturing Supervise4. For example, it is a relationship between Apple in the USA and Hon Hai Precision Industry in Chinese Taipei.
The End of Cold War
Originally Globalization come from peace and security
in 1989. The collapse of the Berlin wall was the beginning of Globalization. After the Cold War ended, people thought peace and security come to the world. The war crisis which had continued from the end of WW2 had passed away. Socialism countries which were the Union Social Soviet Republics, Eastern European countries, and China turned into Capitalism countries at that time. Economically, COMECON5 disbanded in 1991. Militarily, Warsaw Treaty Organization6 was abolished in 1991. Therefore, the world
Graph 1 World Population 1987, 1998 and 2011
Population: billion
Data Source: UNFAA Tokyo Offi ce, http://www.unfpa.or.jp, accessed in 17 August 2017.
Drawn by myself ( IMF Data Base, , accessed in 17 August).
Graph 2 GDP of the World 1990-2015
Unit: USD billion
4 Electronics Manufacturing Service; EMS does not mean subcontract manufacturing industry. EMS means to take over production on a mass scale on a contract basis, not for an affi liate, but for each company equally. Fabless company which concentrate on design and planning uses EMS.
5 Council for Mutual Economic Assistance was established in 1949 against Marshall. The member countries are The USSR, Poland, Czechoslovakia, Hungary, Romania, Bulgaria, Albania (withdrew in 1961), East Germany, Mongol, Cuba and Vietnam.
has become one.
The Unifi cation of Germany
The economic trade preceded Globalization from 1990 to 2010. East Germany joined West Germany in 1990. East Germany accepted the economic framework of West Germany. Graph 3, however, indicates that New Unifi ed Germany had suff ered low ratio of GDP, what is called unification costs" over 15 years since 1990. Finally the ratio of GDP returned to 1991 in 2006.
Transforming the USSR to Russia
The Russian Federation emerged as following the dissolution of the USSR; The United Soviet Socialism Republic in 1991. The Russian Federation under the president Mr. Boris Yeltsin strongly proceeded the market economy. Though of confusion and depression of transforming Socialism planned economy to Market economy, Graph 4 indicates that Russian had recovered after about 10 years from collapse of the USSR. Mr. Vladimir Putin was President of fi rst regime during 2000 and 20087. Putin leaded a market economy of Russia in
Graph 3 The Constant Growth Ratio of GDP in Germany 1990-2007
Unit: %
Drawn by myself (Data Source: IMF Data Base Web, , accessed in 16 August 2017).
Graph 4 The Growth Ratio of Russia 1993-2008
Unit: %
Drawn by myself (Data Source: IMF Data Base, , accessed in 17 August 2017).
his fi rst regime. And Russia entered WTO in 2012 when Vladimir Putin was President of second regime.
Free Trade Area: NAFTA
While ex-socialism countries changed the market economy at amazing speed. Original market economy countries removed barriers of people, goods, services and capital. The advanced countries signed free trade agreements in each region. The USA established NAFTA; The North American Free Trade Agreement with Canada and Mexico in 1994. The NAFTA aimed at creating a trilateral free trade bloc in three countries of North American region by measures of the movement
of people, goods, services and capital. The USA and Canada have used low waged worker in Mexico. Canada and Mexico entered into huge consumer market in the USA without tariff s.
Graph 5 indicates that the NAFTA has tripled the GDP in Canada, the US, and Mexico since 1994. The cause of tripling the GDP is the economic power of the US from 5,980 billion in 1995 to 18,037 billion in 2015. More importantly, the growth of Mexican economy it is. During 1995 and 2015, amazingly Mexican economy has caught up with Canadian economy.
Graph 5 also indicates that Mexican GDP was USD 1,151 billion in 2015 while Canadian GDP was USD 1,553
Graph 5 GDP of the NATA
USD billion
Drawn by myself (IMF Data Base Web, , accessed by 21 August 2017).
Graph 6 The ratio of GDP in NAFTA
Unit: %
billion in this year, although in 1995 Mexican economy was a half of Canadian economy. This is evident from Graph 6 showing the growth rate of the GDP. Graph 6 indicates that there have been 67 times over Mexican growth rate of the GDP 5.0%. The two out of 7 exceeded 6.0%.
Despite the fact that the economic downturn from the Lehman crisis was lower than in the USA and Canada, Mexico recovered more than the USA and Canada in the following year s recovery. NAFTA has given Mexico benefi ciaries more than the US and Canada. However I may think that Mexico has robbed cheap waged workers in the USA of low waged jobs as like assemble of electronic goods and cheap cars, and sewing cloths, shoes, and bags.
EU advanced Globalization
The EU was the center of the end of the Cold War. The EU advanced Globalization movement of the world. Graph 7 indicates that the GDP of the EU had doubled from 1990 to 19978. Because West European countries of the EC signed Maastricht treaty in 1992 and established the European Union. At last Economic and Monetary Union of the EU introduced a single currency Euro" and the European Central Bank in 1999. As the wall of each country's currency was removed, the movement of people, goods, service and capital de facto guaranteed. As if membership
countries of the EU become one country, the EU anticipated Globalization at the moment.
EU used its Integration and its Enlargement
Although the EU has several recessions in reality, the EU had made a good use of integration and enlargement by a measure of rising EU's economy. Graph 8 indicates that the EC which was a predecessor of the EU had been in recession just before the conclusion of Maastricht treaty in 1992. Maastricht treaty created the European Union. At the result of Maastricht treaty, I think that the EC pulled up its economy from minus rate in 1993 to about 3 % in 1994 by a measure of creating EU9.
The EU s economy had stagnated during 1995 and 1999. At this time, the introduction of Euro currency and European Central Bank caused Europhoria" in the EU's economy. The single currency Euro" removed the cost and complexity of exchanging membership own currency to other membership own currency. As the EU removed the cost and complexity of the EU memberships currencies, the EU's economy had raised up from 3 % to 4 % of GDP growth rate during 1999 and 2000.
The last resort of economy recovery of the EU was the 5th enlargement which included East European countries; Cyprus, Czech, Hungary, Estonia, Latvia,
Graph 7 The GDP of the EU
USD: billion
Drawn by myself (IMF Data Base Web, , accessed by 23 August 2017).
Lithuania, Malta, Poland, Slovakia and Slovenia in 2006. Especially, entering Poland into the EU expand the its economic scale. The GDP growth rate of the EU had increased from about 2.5 % to 3.5 % during 1998 and 1999. It noted that Poland entered the EU at that moment. Companies in the advanced EU membership countries like French and Germany transferred their factories to Poland. They have used the low waged Polish people. They have lowered their personnel expenses. The result of this process, they have
increased more profi ts. They also have sold their goods in Cyprus, Czech, Hungary, Estonia, Latvia, Lithuania, Malta, Poland, Slovakia and Slovenia in 2006.
Therefore, I analyze that integration and enlargement coincide economic growth.
Amazing China
The world amazed the development of Chinese market economy since 2000. Graph 9 indicates that Chinese economic scale had tripled or more from CNY
Graph 8 The Growth Ratio of the EU GDP
Unit: %
Drawn by myself (IMF Data Base Web, , accessed by 21 August 2017).
Graph 9 The GDP of China: National Currency
Unit: CNY billion
Drawn by myself (Data Source: IMF Data Base Web, , accessed in 24 August 2017).
17,635 billion in 2000 to CNY 56,539 billion in 201210. To be surprised, indicating by Graph 10, Chinese economic scale in USD had explored 7 times or more since USD 1,215 billion in 2000 to USD 8,570 billion in 2012. The world has been surprised that China had realized high economic growth more than 20 years.
Beijing Olympic and Shanghai Exhibition
The world was surprised that China developed own scale more than the USA and the EU. China has begun to accelerate the increase of economic scale by the market economy since 1992. Approximate curve
indicates that China's GDP growth rate amazingly has continued high rate of about 10 % for 10 years during 2000 and 2012.
Especially, indicating by Graph 11, Chinese economic scale had grown for 5 years from 2003 to 2007 just before Beijing Olympic in 2008 (10% in 2003: 10.1% in 2004: 11.3% in 2005: 12.7% in 2006: 14% in 2007). Preparation of Beijing Olympic caused Building Boom around the capital city, Beijing. That would be called “Capital remodel". Airports, Railway, Commuter train, Underground, highways and roads were prepared to be welcome to Olympic players, heads of states,
Graph 10 The GDP of China: US dollar
Unit: USD Billion
Drawn by myself (Data Source: IMF Data Base Web, , accessed in 24 August 2017).
Graph 11 The Growth Ratio of GDP in China
Unit: %
tourists at home and abroad. The construction of hotels were rushed. Before Beijing Olympic, any and all preparations raised Chinese economy.
Graph 11 also indicates that the high rate of China's GDP growth rate has maintained until 2010 when Expo 2010 Shanghai China was exhibited (9.6% in 2008: 9,2% in 2009: 10.6% in 2010)11. Although Chinese economic growth power temporally fall under about 9 % after Beijing Olympic, China boosted economic growth power by the measure of preparation of Shanghai exhibition in similar way of Beijing Olympic again. Therefore, China had maintained 10 % during 2000s despite Lehman crisis at New York money and fi nancial markets in 2008.
The Factory of the World
China has become “the factory of the world” for twenty years since 1992. Chinese population is 1.4 billion who are well educated, want to increase want to middle class, and was able to be hired with cheap wage. In those days, a Japanese company was able to hire a Chinese university graduate with one-tenth wage of a Japanese university graduate12. Companies all over the world transferred domestic factories into China.
Development of Chinese Technology
Advanced countries transferred low technology into China at an early stage. For example these were CRT TV, electric shaver, Vacuum cleaner, refrigerator, apparel, shoes, bags, cheap quartz watch etc13. Now, advanced countries transferred high technology into China. These were Cars, High speed trains, LCD TV, Personal computer, smart phones, high brand apparel & shoes & bags, high class watch, etc. According to the development of Information Technology, companies in advanced countries incorporated China into their own supply chains14.
CNY Depreciation against USD
As CNY had weakened against USD from CNY 6.77 in 2010 to CNY 6.14 in 2014 during 2010 and 2014,
the GDP of China had increased (Graph 12). On the other hand, as CNY had appreciated against USD from CNY 6.23 in 2014 to CNY 6.64 in 2015, the GDP of China had raised.
Why had the GDP of China grown with the appreciation of CNY in previous term? On the other hand, why had the GDP of China with depreciation of CNY in later term? This suggested that the reason for the growth of GDP in previous term was diff erent from the reason in later term. In other words, the reason for the growth of GDP in later term was diff erent from the reason in previous term.
I analyze that economic boom of Beijing Olympic led the GDP of China in previous term. Infrastructure construction and domestic demand expansion had entered into economic boom. I also analyze that the export for the world, especially for the USA had increased the GDP of China in later term, as the technology of China has proceeded and has been able to make advanced goods, LED television, personal computer, laptop computer and smart phone, etc. As CNY depreciated against USD, China expanded the GDP. Because CNY depreciation against USD increased export from China to the USA. The reason is why imports from China can be bought at one dollar increases. In fact CNY depreciation against USD is a price cut attractive products from China for the USA. Although the CNY is a currency basket system, it is under the control of the Chinese financial authority, so it can be thought that the Chinese government has invited the currency depreciation against USD and encouraged the economy to rise15.
The economy of the US increased
The advanced country which received the most dividend for the end of the Cold War is the US. The US has taken an advantage of globalization after the end of the Cold War. The US has the largest consumer market all over the world. The individual consumption occupies 75% of the GDP. The export countries sold own productions to the US. China exported low technology goods to the US. Russia exported Oil and
11 GDP Data from IMF accessed in 12th August 2017. 12 Freedman, , revised edition.
13 Kan Shiyu, , Toyokeizai Shinpou Sya, Tokyo, Japan
2005.
14 Friedman , revised edition.
Liquid Natural Gas. Japan and Germany exported cars & vehicles to the US. Japan and South Korea exported electronic goods & equipment to the US. France and Italy exported to high brand goods.
The GDP of the USA doubled from USD 8,995 billion in 1990 to USD 16,397 in 2015. The GDP per capita had also doubled more from USD 23,914 in 1990 to USD 52,742 in 2015. And the population of the US has 367 million persons in 2013.
The beginning of Globalization after the end of the Cold War was taken effect by monetary easing of financial policy of FRB. The chairman of FRB is Mr. Greenspan. He had controlled economy of the US as a central banker from 1987 to 2006. He worked so good during his commission. His method sounded a warning on the boom, sometimes patiently waited for the economic recovery. The most famous warning was “Crazy without evidence” when New York Stock Exchange was boom in December 1996.
September attack 9/11
September 11 attacks shocked all over the world. After 9/11, Globalization was threaten by terrorism. The war against Al Qaeda, Taliban, and ISIS began
in advanced countries. The United States attacked Iraqi and Afghanistan as retribution. The one called Iraqi War", the another called War in Afghanistan", Iraqi War began in 2003 and ended in 2011. War in Afghanistan has continued since 2001 to present. September 11 attacks were 4 attacks on NY and Washington D.C. in the United States by terrorist organizations' hijacking civil air crafts. Terrorists who were 19 persons boldly aimed at destroying America's political and economic center which everyone could not think ever about it. They attacked at World Center Buildings in New York fi nancial district by hijacking 2 airplanes. They attacked at Pentagon, Department of Defense in Washington D.C. by hijacking an airplane. They attempted to attack U.S. Capital or White House in Washington D.C. by hijacking an airplane. 4 attacks were at the same time between 8:46 am and 10:28 a.m. in September 11 200116.
The attacks killed 2,977 victims, 12 hijackers committed suicide and 6,000 persons more injuries17. The Twin Towers of the World Trade Center collapsed by hijacked airplanes. The South block in Financial District around collapsed Twin Towers suffered a devastating blow. New York city announced that the total damage
Graph 12 GDP of China (CNY billion) and USD ($1) /CNY Exchange Rate 2010-2016
Drawn by myself (Source: Principal Global Indicators, China"
(http://www.principalglobalindicators.org/regular.aspx?key=60942005) accessed in 25 August 2017 and IMF Data Base, , accessed in 25 August 2017).
16 I watched September 11 attacks in CNN at real time when it was midnight at JST 12:00 a.m. I confused myself. Because I could not understand what happened in New York. No Japanese Television aired September 11 attacks. Japanese TV aired regular programs. I remembered to watch how to cook a Italian pizza with a famous Japanese Comedian on TV show. On the other hand, CNN was airing only World Trade center fi red. Two hours later. The one of Twin Towers collapsed. The second air craft hit the other of Twin Tower from left hand to right hand. For a while the other of Twin Towers collapsed. And there is noting at that point, now we called Ground Zero", in CNN. I was stunned at that scene.
of only New York city was USD 105 billion excluded human victims and injuries18.
New York Stock Exchange had stopped trading for four days. The fl ow of money by way of New York Stock exchange estimated USD 20,000 billion19. Tokyo Stock Exchange Nikkei 225 plunged under JPY 10,000 in 12 September. That was the fi rst event since Augst 1984. The Stock prices in financial centers of the world fulled security. The foreign exchange markets in fi nancial centers of the world fell into turbulent descent against USD like a storm.
The economy of the US, however, was firm and strong. To be surprised, Graph 13 indicated that GDP of the USA in 2001 was more than in 2000. The economy
of the USA got recovery from tragedy of September 11 2001.
Lehman Crisis
The US's economy which had continued to be good since 1992 fallen by Lehman crisis in 2008. Because Lehman Brothers went bankrupt by subprime loan problems20. In New York financial markets credit occurred at that moment. The price of land in New York, California, and Florida fell. The banks and investment banks could not finance companies. Therefore, the economy of the US entered into recession. Moreover, the economy of the US might fall into defl ation as like Japanese economy.
Graph 13 The GDP of the US between the End of the Cold War to 2015
USD Billion
Drawn by myself (Data Source: IMF Data Base, , accessed in 29 August 2017).
18 Tokio Marine Risk Consulting Co, Ltd, Bei Koku Douji Tahatsu Tero ga Ataeta Eikyou" in , vol.20, 2002 (http://www.tokiorisk.co.jp/risk_info/up_fi le/2004020565.pdf) accessed on 2 September 2001.
19
Recession of the EU
The economy of the EU had fallen twice before and after 2010. Firstly, before 2010, the economy of the EU fallen into the bottom during 2009 and 2010 by affection of Lehman crisis in the US in 2008 (Graph 13). Because most commercial banks in the EU which purchased many and many the securities of subprime loans also suffered a big blow when Lehman crisis occurred in 2008.
The securities of subprime loans was originated by Lehman Brothers. Lehman Brothers was a investment bank in NY, the USA. It had sold many and many securities of the subprime loans to most commercial banks in the EU beyond Atlantic Ocean. The subprime loans originally means disqualification loans which commercial banks and loan companies never could fi nance.
But Bush Republic administration and Greenspan, chairman of the FRB eased the criteria of loans to poor citizens. Suddenly, increasing home price in Florida and California backed up subprime loans. So subprime loans potentially included bad loans problem.
During 2007 and 2008 subprime loans became bad loans. The basis of securities of subprime became bad loans and the securities of subprime, of course, became default at the same time. Therefore most commercial banks in the EU suddenly had default securities of
subprime. Commercial banks in the EU became bad own assets. As the most commercial banks in the EU could not finance any European companies, Europe's economic scale had fallen.
Secondary, Greece credit crisis shocked the EU's economy in 2012. The finance of Greece government became too worse to pay principals and interests of their sovereign bonds. As finance of Greece government got worse, indicating Graph 15, the EU's economy fall again in spite of recovery in 2009.
Financial deterioration of a membership country should be helped by the rest of membership countries of the EU. In this case, Greece it was. The rest of membership countries of the EU, especially Germany. But the rest of the membership countries of the EU could not agree the rescue package of Greece. Germany would pose a recommendation of leaving the EU at the meeting of the Council21. As the confusion in the EU which happened by Greece credit crisis had continued, the EU's economy had become stagnant.
Greece Debt Crisis
The EU was shocked by Greece debt crisis in 2010. Because we found that the Budget deficit of Greece Government was over 13% compared Greece's GDP22. Credit rating companies downgraded Greece credit
Graph 14 The Growth Ratio of GDP in the US 1990-2015
Drawn by myself (Data Source: IMF Data Base, ,
(https://www.imf.org/external/pubs/ft/weo/2017/01/weodata/index.aspx)accessed in 17 August 2017.
21 German at last accepted the rescue package of Greece.
rating. The price of Greece sovereign bonds fell by selling. And the price of the EU membership sovereign bonds fell because Greece is a membership country of the EU. The currency Euro" also fell by selling because of the same reason. Graph 16 indicates that the GDP growth rate of the EU had decreased sharply in -4.3% in 2009 and 2.1 in 2010 and 1.74 in 2011 and -0.4 in 2012 0.29 in 2013 and 1.7 in 2014 and 2.35 in 201523. Greece debt crisis, indicated by Graph 16, advanced
the EU recession from 2011 to 2012. In other words, I think that Greece debt crisis triggered short recession of the EU.
Credit Easing “Q1, Q2 and Q3” of FRB in the US The cause of Lehman crisis occurred in Republican Bush administration. Because the policy of Bush administration had promoted subprime loan by which the low wage workers to get their house.
Graph 15 Recession of the EU
USD Billion
Drawn by myself (Data Source: IMF Data Base, , (https://www.imf.org/ external/pubs/ft/weo/2017/01/weodata/index.aspx) accessed in 17 August 2017.
Graph 16 The Growth Ratio of GDP in the EU 2007-2015
Unit: %
Drawn by myself (IMF Data Base, , accessed in 17 August 2017).
The next Democratic Party President Mr. Barack Obama appointed Timothy F. Geithner as Secretary of the Treasury. President Obama make Geithner and Bernanke as a chairman Federal Reserve Board resolve Lehman crisis and U.S. Recession. Geithner, Security of Treasury proceeded Lehman Brother's bankruptcy processing. He also suppressed the credit crunch and falling equity prices in Nev York fi nancial market. But he could not justice bankers who made the cause of
Lehman crisis. And mistrust of bankers and politics has remained.
Bernanke, chairman of FRB, estimating by Graph 8, supplied many and many fund to the market by his financial policy, Q1, Q2 and Q3. Graph 8 indicates that the Q1 dramatically made the economy of the US recovery. The Q2 made the economy of the US maintain recession. The Q3 made the economy of the US prevent from falling defl ation.
Graph 17 FRB Financial Policy Credit Easing, Q1, Q2 and Q3
Unit: USD Billion
Drawn by myself (Data Source: Land Institute of Japan, “Beikoku no Ryouteki Kinnyu Kanwa no Doukou ni tsuite,” in (http://www.lij.jp/news/research_memo/20140106_3. pdf) January 6 2014, accessed in 17 August 2017.
Graph 18 The ratio of GDP of the US after Lehman Crisis and Q1, Q2 and Q3 Unit: %
The economy of the US managed to recover, but the Exit financial policy remained. If FRB does the exit policy, new recession might start again. Therefore nobody could say that financial market and economy have completely normalized.
2 . Recession and Recovery of Japan : Heisei
recession
Recession of Japan
The bubble economy of Japan peaked out on basis of Nikkei 225; Tokyo stock average price at JPY 38,915 in 29th December 198924. Graph 13 indicates that Japanese economy entered into long and long recession what is called Heisei Recession". Japanese recession has continued for about 30 years since the end of 1989. The first cause of Japanese huge recession is bad loans problems from 1990 to 2002. The second cause is deflation from 1998 to 2017. Especially East Japan Huge Earthquake, what is called “3.11.2011” gave a big blow to Japanese Economy. The big accident of nuclear power point in Fukushima has had a bad influence
to Japanese economy, Japanese mind and culture yet. Firstly, indicating by Graph 19, Lehman crisis damaged Japan's economy in 2009. Secondly, Great East Japan Earthquake & Tsunami damaged it in 2010. Thirdly, increasing consumption tax from 5% to 8% damaged it in 2014. At last the economic scale of Japan had dropped down from the 2nd of the world to the third in 2010. China's economic scale overtook Japan. That is China GDP USD 6,066 billion vs Japan GDP USD 5,700 billion in 201025.
JPY against USD and GDP of Japan
In view of JPY exchange rate against USD, Japanese long recession is divided into three periods. The first period is “weaken JPY No1” during 1997 and 2007. The second period is “strong JPY” during 2007 and 2012. The third period is “weaken JPY No2” during 2012-2015. In previous half of fi rst period, JPY depreciation against USD did not relate with the GDP of Japan between 1997 and 2003. Probably bad loan problems destroyed banking asset managements. At the result of destroying banking asset managements,
Graph 19 Recession of Japan Heisei Recession
Unit: %
Drawn by myself (Data Source: IMF Data Base, , accessed in 18 August 2017).
24 The Nikkei 225 Stock Average calculates the average stock price of 225 listed companies on a fi xed formula.The 225 companies are not changing permanently. they are changed at any time according to the transaction situation of the issue. In general, the issues that do not bother with trading are removed, and the issues of companies that fi t the era in which the transactions are placed are incorporated. In other words, since Nikkei 225 index is in accordance with the trading situation of the Tokyo Stock Exchange market, Nikkei 225 index has a diffi culty to fall down in the markets. The Nikkei average removes issues of Hokuetsu Paper Mfg. Co., Ltd. and Meidensha Co., Ltd., and incorporates issues recruitment and Japan Post in 5 September 2017. Nevertheless, the Nikkei 225 index could not show a continuous rise such as suffi ciently exceeding JPY 20,000 in the Heisei recession, Japan.
banks could not fl ow required credit from to companies. Banks at last caused credit crushing to companies and credit withdrawing from companies. Outside of Japan, terrorism in NY, that was attacked NY fi nancial district by Al Quida in 9. 11 2001 decreased the demand of the USA citizens. Export from Japan for the USA decreased and GDP of Japan was fl at both 2001 and 2002. Beyond JPY USD exchange rate, Japanese economy was recession due to negative factors.
In later half of first period, JPY depreciation against USD benefited Japanese economy between 2004 and 2007. JPY depreciation against USD promoted exports from Japan for the USA. The increase of export for the USA raised the GDP of Japan. In strong JPY period, Lehman crisis in 2008 shocked Japanese economy in 2009. Foreign investors sold USD when they faced Lehman crisis. As they bought JPY, JPY appreciated against USD. The JPY appreciation usually gives Japanese export an adverse eff ect. Lehman crisis also was caused by default of low waged workers' home loan. Therefore, the demand power of low waged workers decreased personnel consumption. The import from Japan for the USA temporally declined sharply. So the GDP of Japan was fl at between 2009 and 2010 due to Lehman crisis in 2008. In weaken JPY No2 period between 2012 and 2015, indicated by Graph 20, Japanese financial authority intended to raise appreciation JPY against USD from USD 1= JPY 80 to
USD 1 = JPY 120 to in order to increase of the GDP of Japan. Japanese administration, Prime Minister Abe, and Bank of Japan, Gov. Kuroda accorded cooperation policy with financial policy in 2012. Bank of Japan accepted QQE and supply huge JPY which nobody had ever seen. Japanese QQE aimed to JPY depreciation against USD. The JPY depreciation against USD expanded export from Japan for the USA. At the result of JPY depreciation invited by Japanese administration and Bank of Japan, the GDP of Japan had continued to increase between 2012 and 2015.
CNY Appreciation Created Chinese Purchasing Power The depreciation JPY against USD was accepted as a measure of raising the GDP of Japan by Japanese administration and Bank of Japan, while JPY also depreciated against Chinese Yen between 2012 and 2015. In other words, CNY appreciated against JPY. Because CNY is accepted by currency basket system including USD and JPY. As USD appreciated against JPY, CNY also appreciated against JPY. At the result of CNY appreciation against JPY from CNY 12 to CNY 20, Chinese purchasing power increased about 1,7 times (Graph 21). Therefore, Chinese tourists went sight seeing to buy goods made in Japan. As far as I saw in duty free shop and the airport, Chinese tourists expanded to buy electric rice cooker, jewelry, Japanese original school bag, over-the-counter drugs, and high
Graph 20 The GDP of Japan: JPY Constant Price based JPY = 2011
billion
Drawn by myself (Data Source: Principal Global Indicators, USA",
grade watches etc. This is called Baku Gai" which means exploring goods made in Japan by Chinese tourists. I think that the purchasing power of Chinese tourists contributed to increasing the GDP of Japan between 2012 and 2015.
GDP of Japan Converted in USD
In JPY appreciation against dollar of later period, even if GDP of Japan increases, it is based on yen
conversion. Of course, it may be good for Japanese. But, in other words, under the depreciation of the yen, Japan's GDP has been greatly damaged in dollar terms. Graph 22 indicates that GDP of Japan, when JPY converted in USD, had reduced nearly $ 2,000 billion between 2012 and 2015. Perhaps, in only my opinion, there might be a possibility that Japanese people are reminded that the actual Japanese economy has not recovered and has recovered at the exchange rate.
Graph 21 CNY(1): JPY and GDP JPY
billion
Drawn by myself (Data Source: Principal Global Indicators, China"
(http://www.principalglobalindicators.org/regular.aspx?key=60942005)accessed in 25 August 2017 and IMF Data Base, , accessed in 25 August 2017).
Graph 22 The GDP of Japan (USD)
USD billion
Potential of Japanese Economic Power
The fundamental power of Japanese economy is potential bigger than any other countries. China, which has the strongest economic power of the 21st century, even at its highest economic growth power, China did not match Japan's sealed high economic growth power. Graph 23 indicates that the growth ratio of Korean War special demand and the growth rate of the Izanagi Economy showed more upward 12 % than China's economic growth rate exceeded 10% during the heyday. Both trends in the approximate curve is always upward different from Chinese trend curve. I still think that even if at the same time of high economic growth in Japan and China, the potential of Japan's economic power is higher than China, if technological innovation, economic policy and monetary policy go well.
A Direction of Reviving Japanese Recession
One key to revive Japanese economy is to combine technology and the inherent fineness of Japanese technology. Two key is to avoid competing with international competitive labor costs by escaping from not becoming a commodity. For example, there is a company called Fuji Precision Machinery Co. in
Fukuoka City, Japan26. This company is manufacturing a Japanese food machine, especially Rice Ball" and Sushi". Fuji Precise Machinery Co. makes mass production machine of Rice Balls" and Sushi Rice" with precisely detailed settings and inherent fi neness Japanese technology. At the same time, Fuji Precise Machinery Co. has also developed house-sized rice ball production machines and sushi making machines that can equip the kitchen of a Japanese restaurant, leaving that technology as it is. The customers, Japanese restaurants could not distinguish Rice Balls" & Sushi Rice" made by the food machine and veteran Japanese sushi craftsman with precise and fi ne. Rice Balls" and Sushi" are distinctive foods in Japan and there is no competitor even if it is exported overseas. Sushi craftsmen are short in the expanding Japanese food market overseas. In fact, sushi craftsmen are not Japanese but Chinese and Korean, even Russian. In Japan sushi craftsman is short by long and long training to a sushi craftsman. Therefore, Fuji Precise Machinery Co. has continued to expand its business performance by sequentially developing and improving food machines that can not be defeated by sushi craftsmen. Rice Ball" and Sushi rice" machines' share
Graph 23 The Growth Ration of Japanese during 1953 and 1954, during 1965-1970 While Chinese during 2005-2015
Note:
Ⅰ : Korean War 1953; The Preparation of Tokyo Olympic 1962; Izanami 1966; Chinese 2005 Ⅱ : Korean War 1954, The Preparation of Tokyo Olympic 1963; Izanami 1967; Chinese 2006 Ⅲ : Tokyo Olympic 1964; Izanami 1968; Chinese 2007
Ⅳ : Izanami 1969; Chinese 2008 Ⅴ : Izanami 1970; Chinese 2009 Ⅵ : Chinese 2010
Drawn by myself (Data Source: IMF ) accessed in 29 September 2017 and Matsubara Teruo, KOUDO KEIZAI SEITYOU KI"
http://www.kyoritsu-wu.ac.jp/nichukou/sub/sub_gensya/Economy/J_Economic_History/High_E_ Growth.htm accessed in 29 September 2017.
is 80 % Japan. The success of Fuji Precise Machinery Co. is targeting a niche Japanese food market, but it shows the direction of Japanese companies in the future and how to revive the Japanese recession economy.
3 . Globalization Faces Difficulties: facing the
present and danger
Declining Economic Power of G7
The economic ratio of G7 advanced countries in the world has been decreasing for 25 years (Table 1)27. Because the economy of emerging countries including China and Russia has been increased. The economic growth ratio of G7 in the world decreased from 64% in 1990 to 46% in 2015 (Table 1). The economic power of G7 has relatively fallen. G7 no longer leads the world economy.
Therefore the G7 summit has no longer decide world politics, and G7 fi nancial ministers and governors of central banks have no lodger decide world fi nancial policy though both international conferences have been held. Of course only the US has never decided world
policy and financial policy. G2028 countries including emerging countries have not completely decided world policy and financial policy. The world has become unstable about politics and fi nancial policy. That is the result of Globalization. Declining leadership of G7 has created a break in the order of the global economy.
G7 could not Grip the World
G7 Summit which is the US. the UK, France, Germany, Italy Canada, and Japan could not grip the world's order of economy and security since the 21th century. G7 Central Bankers and Ministers of Finance also could not have been influenced in the field of world's monetary, banking and financial economics. Because G7's economy of 1995 accounted 66 % of the world's economy while G7's economy of 2015 accounted only 46 % of the world (Graph 24). The decrease of G7's influence has accentuated the high economic growth of Brazil, Russia, India and China, that is BRICs since the 21th century. G7's country could no longer make a decision on economic and financial critical issues now. G20 has, however, too
Graph 24 G7 Countries' GDP Percentages in 1995 and 2015
(Inside; 1995 : outside. 2015)
Drawn by myself (Data Source: .)
Table 1 The Economic Ratio of G7 in the World
scale: USD billion
Source: IMF Data Base Web, , accessed in 16 August 2017.
27 G7 countries: Canada, France, Germany, Italy, Japan, United Kingdom, and United States.
many members to put out a strong statement. G20 has also too many member to make a strong statement based on common value. It seems that Globalization starts to drift through the world economy like the sea.
Withdrawing from Iraq War and Afghanistan Confl ict The Democratic Party President Barack Obama needed to end Iraq war and Afghanistan campaign which former Republican President Bush began. Obama officially ended Iraq war by withholding US military in 14 December 2011. Obama also ended Afghanistan campaign by withdrawing US military until the end of 201629.
Resign a Policeman of the World
Obama approved Arab spring (Figure 1) which continued a series of Revolutions; Tunisia's jasmine revolution in 2010, Egypt Revolution in 2011, Libya Revolution in 2011, and Yemen Revolution in 2011. And Obama did not intervene Assad Syrian regime's repression against citizens by chemical weapon, probably Sarin gas in September 2013. Obama told that the USA was not still a policeman of the world in 10 September 2013. Therefore, the hegemony of the USA since the end of the Cold War weakened all over
the world. The security which supports Globalization began to crack at that moment.
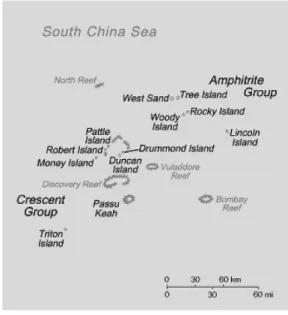
China's Strongly Development toward Ocean and Sea China developed South China Sea when world found that Obama administration never adopted military option against gang-country, especially big country which is more than Syria. China strengthened effective control of Palacel Islands in South China Sea which China has been eff ectively controlled since 1974. China promoted not only military development but also civilian settlement by building kinder-garden, elementary school, cinema theater and port of cruising ship in Woody island (Figure 2).
China also land-filled to build and to expand an artificial at Fiery Cross Reef inside South China Sea which was originally natural small reef, not island (Figure 3). China completed the artifi cial island with 3,300m airport at which Boeing 737-800 and Airbus A310 can land and take off , the port with piers which a large ship can be berthed, and residential facilities. Depending on viewing angle, this islands are military base or an aircraft career never sinking. This is a clear international law violence30. China completed to built the bridge head of West Pacifi c Ocean.
Figure 1 Arab Spring
Source: in English.
29 But President Trump overturned ex President Obama's decision. President Trump decided increase military to 8,000 persons in 21 August 2017.
Chinese Invasion of Japanese territory
On the other hand, China developed East China Sea according to deepening Japanese depression. Chinese Coast Guard ships have entered Japanese territory around the Sen Kaku Islands (Graph 25).
Chinese Coast Guard's entering Japanese territory of Sea around Sen Kaku Islands are 50 times in 201531. Chinese Air Force airplanes also Japanese air territory over the Sen Kaku Islands (Figure 4). Chinese air infringement reached 571 times in 201532.
Figure 2 Palacel Islands
Source: in English, original:
Figure 3 Spratly Islands Military Occupations Map 2009
Source: in English
Graph 25 Number of Invasions of Chinese Public Ships around Japanese Sen Kaku islands in East China Sea
Drawn by myself (Data Source: Ministry of Defense of Japan, , Figure & Table Ⅲ -1-2-2, Web accessed in 16 August 2017).
31 Ministry of Defense Japan, , Nihon Keizai Shinbum Shyuppan, Tokyo Japan.
Russia invaded Ukraine
Russia invaded Ukraine when world knew that the US was not still a policeman of the world. Because President of Federation of Russia, Mr Putin was sure that Obama never attack Russia as if Russia invaded other country. At the Geopolitical point of view, Ukraine has been important from ancient times33. For Ukraine is one way from Russia to West Europe and another way from Russia to Black Sea.
Besides the reasons for the above security, there are economic reasons why Russian invaded Ukraine. Russia feared economic power of the EU. Firstly, Goods of the EU would eliminate Russian products from Ukraine markets. Secondly, Russia was afraid that products of the EU will fl ood in Russian market through Ukraine. Goods of the EU would sweep Russian products in the market34.
Figure 5 indicates that Russia invaded Ukraine in 2014. Russia made east Ukraine de facto independent. At the same time, Russia invaded Sevastopol and Crimea in Ukraine and declared consolidation by the method of Referendum in 2014. Russia won buff er zone
against Western Europe, especially the European Union, and secured bridgehead to the Black Sea and de facto Naval right to Black Sea.
Russia and China Shocked Globalization
Russian and Chinese action shocked the world. Because Russia and China are two of only 5 permanent United Nations security council members. the United Nations aims at maintaining the status quo after WW2. But China tried to develop Ocean expansion with strong military power and done well at Parasail Islands in South China Sea. Russia invaded Ukraine and put East Ukraine de facto under control, and consolidated Sevastopol and Crimea Peninsula completely. Both countries were relatively not aff ected by Lehman crisis. Therefore, the basis of Globalization has been faced crisis by strong powered both countries, China and Russia.
Figure 5 Expansion and Contraction of Insurgent-Controlled Territory in the Ukraine Confl ict
Note: Malaysia air line: MH17 Boeing 777-200ER was said to crash down by Ukraine or Russian Ground to air missile in 17 July 2014. This figure also indicates flight path and crash-point of MH17. 287 passengers and 15 crews were killed. The shooter has still never found in 2016.
Source: Figure from in English.
Figure 4 Example of Flight Patterns of Air Crafts Subject to Scramble by JSDAF
Source: Ministry of Defense of Japan, , Figure & Table Ⅲ -1-2-4, web accessed in 16 August 2017.
33 In old days, Batu, Qipchaq kaan who was crossing Ukraine from East to West battled and overtook German and Polish Knights & army at Wahlstatt, Poland in 1241. Russia against British French Osman Turkey allied army battled at Siege of Sevastopol, Crimea War in 1854. About 75 years ago, Nazis, German SS & army which was crossing Ukraine from West to East invaded the Soviet Union toward Moscow in 1941.
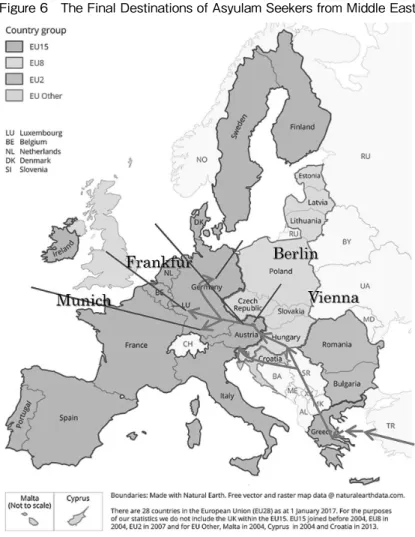
Asylum Seeker from Syria, Afghanistan, and Iraq The EU relative safety existence has become a lifeboat from conflicts, collapse of country and terrorism, especially ISIS in Middle East, Africa, and Afghanistan. Asylum seekers from Syria have dramatically increased by collapse of Syria. They have two ways. One way is Sea route by way of Libya and Mediterranean and Italy. Another way is Land route by way of Turkey, Greece, Macedonia, Serbia, Hungary. The EU and the EFTA 3 countries (Norway, Iceland and Swiss) have Schengen Agreement which guaranteed the movement of people within EU membership countries and EFTA 3 countries. Once an asylum seeker is granted residence permission by one membership country of Schengen Agreement, he or she should be able to move within the EU and EFTA 3
countries of Schengen Area.
Therefore, he and she wants to move toward Germany which is positive to accept asylum. His or her final destinations are Berlin, Frankfurt, and Munich by way of Turkey, Greece, Serbia, Slovenia, Croatia, Hungary or Austria(Figure 6).
His or her movement causes some and heavy problems. Italy, Greece and Hungary burden heavy costs to give asylum seekers safety shelter, water and foods. Via countries of Croatia, Austria, Slovenia burden heavy costs to give them guarantee of safe movement. Most EU membership countries burden heavy costs and get little returns. Fiscal costs for accepting asylum seekers could not endure national finance. European People's minds of accepting Islamic asylum seekers have divided by welcome and hatred.
Figure 6 The Final Destinations of Asyulam Seekers from Middle East
Drawn by myself(Source: Delsio, Christopher [2017]
, Praeger, an Import of ABC-CLIO, LLC, p. Ix, Figure 2015 Migration Crisis The Turkish -Balcan -Central Europe Corridor(Based Map, Offi ce for National Statics Web, the UK accessed in 20 August 2017).
The Merkel plan was proposed by European Stability Institute (ESI) in October 2015. ESI is a think tank which is based in Berlin, Germany. The Merkel plan involves that Germany should give asylum 500,000 persons in Turkey from Syria seeker registers. In return Turkey should take back new immigrants to Greece. Germany would also help Turkey to get visa-free travel by 201635. But Municipalities at the reception site in Germany have been screaming for the sudden increase of Asylum seekers. To be regret, there is no solution to accept Asylum seekers from Syria. Asylum seekers threatens the economic foundation of Germany which is a center of the EU economy now.
The EU Asylum Seekers Crisis
The EU Asylum seekers Crisis has still continued since 2015. This crisis was created by Asylum seeker from conflicts zone. Originally, European countries have accepted asylum seekers for 30 years. The EU Asylum seekers Crisis is diff erent from its history. This diff erence is unprecedented and large quantities36. Graph 26 indicates that the EU membership countries accepted 3,021 thousand people of Asylum
seekers applicants for the past three years. It is surprised that the number of asylum seekers of 2015 (1,255,640) doubled in 2014 (562,680) and the tide of
2015 continued in 2016 (1.124.280).
Graph 27 indicates that the cause of the EU Asylum Seekers Crisis is the military policy of the US. Because asylum seekers have come from Syria (334,820 persons: 28%), Afghanistan (182,985 persons: 15%), and Iraq (12,955 persons: 11%) towards freedom and safety in the EU in 201637. Syrians, Afghans and Iraqis have continued top 3 citizenship for last three years. The US aborted to attack Syria AL-Assad regime by cruising missiles and Syria entered Internal Confl ict to be the brink area of power. One of two Syrians died and was missing. The US extinguished Sad-am Hussein Iraq by Iraq War and ex-Iraq entered terrorism war against ISIS. The US attacked Taliban in Afghanistan by retaliation of 9.11 and terrorism war against Taliban has still continued though of killing Osama Bin Laden. The ineff ective military power of the US created huge refugees and asylum seekers and made the EU fall into asylum crisis.
Graph 26 The Asylum Seekers Applicants to the EU 2014-2015
Unit Thousand persons
Source: Eurostat, 1.2 million fi rst time asylum seekers registered in 2016: Asylum in the EU Member States" in 16 March 2017.
36 Delsio, Christopher [2017] , Praeger, an Import of
ABC-CLIO, LLC, p.1.
Brexit and Immigration
The United Kingdom is the second economic area after Germany in the European Union and has enjoyed prosperity since 1975 when the UK joined the European Community. At that moment, the UK citizens were very positive in EC accession. It is surprising to think from now, voters in the UK backed the accession of the EC by a strong two to one margin in Referendum 197538. I think that the UK determined to switch from depending on American economy to depending on Continental Europe in 197539. Why did the UK change its attitude toward the EU by 180 degrees for 40 years? Now the UK faces Brexit" crisis that means leaving the EU. Because immigration from EU membership countries (Graph 28), especially East European membership countries which are EU8; Estonia, Latvia, Lithuania, Poland, Hungary, Czech, Slovakia and Slovenia and EU2: Romania and Bulgaria, have dramatically increased last years (Graph 29). They have aimed at working in the UK which has relatively higher wage level than their home countries40. Schengen Agreement guaranteed the
movement of people within the EU and EFTA 3 countries. The UK administration has been welcome to immigration from the new EU membership of East European countries,in spite of the fact that the UK could restrict their immigration by transitional measures,when Eastern countries newly joined the EU in 2004 and 2007.
Therefore, British middle class and lower class in the UK has been deprived of jobs by immigration of the Eastern Europe membership countries, especially Poland and Romania (Figure 7). Graph 30 indicates that EU8 immigrants, mainly Polish rushed to increase from 53 thousands in 2004 to 112 thousands in 2007 after EU enlargement of EU8. EU2, mainly Romanian, also, suddenly increase from in 11 thousands 2012 to 65 thousands in 2015. This made British middle lower class to frictions against immigration.
Polish immigrants mainly employed large farms as a worker. Polish immigrants are unfamiliar to the UK. Polish immigrants can work because it is a single task. Agricultural manager who mainly belongs to the aristocracy of the UK can use lower waged labor forces41.
Graph 27 Asylum Seeker Applicants by Country Citizenship in 2016
Unit: person
Source: Eurostat, 1.2 million fi rst time asylum seekers registered in 2016: Asylum in the EU Member States" in 16 March 2017.
38 Clarke, Harold D, Goodwin Matthew and Whiteley Paul,k Cambridge
University Press 2017, p.146.
39 Haruo Nakatsuka [1994] , Master paper unpublished.
This settlement from Polish immigrants has applied most Eastern European immigrants.
So the problems of Eastern European immigrants took place in rural regions where large scale agriculture can be worked. Because in rural region most citizens are British origin. They have made a community. They have fostered their British culture. The rapid increase of immigration from Eastern Europe into rural areas has destroyed British communities and cultures.
For example, 74% citizens of Boston voted Leave the EU". Boston is in middle east of England. Immigrants from Poland, Latvia and Lithuania had increased to 460% from 2011 to 2014. Most of immigrants have been employed by large scale farms in Boston. Immigrants took away employment opportunity from Boston citizen. Immigrants a lso pushed down t he wage level in B oston. Any immigrants did not interact with Boston's community. Citizen in Boston told that immigrants
caused quarrels, robberies and murders42.
The frictions in the UK turned towards Brexit" that is Leaving the EU. The EU referendum won narrow majority of Leaving the EU on 23 June 2016. Graph 31 indicates that England and Wales voted Leave" while Scotland and Northern Ireland voted Remain". The UK chose Leave" as a whole by narrow majority.
The UK Prime Minister Theresa Mary May offi cially declared the EU President Donald Franciszek Tusk that the UK decided to leave on base of Lisbon Treaty section 50 in 29 March 2017. After two years later, the UK will leave the EU. The UK is the second largest economic scale country next to Germany and has London International Financial Center. During two years of negotiating period, the UK's politics and economy will become unstable. Because of economy and financial market, Brexit might expand instability to Globalization.
Graph 28 Immigration from the EU Citizens
Unit: thousands
Drawn by myself (Data Source: Offi ce for National Statics Web, the UK accessed in 20 August 2017).
Graph 29 Immigration from EU 12 (original states) and EU8 + EU2 (newly joined East European countries)
Unit: Thousands
Drawn by myself (Data Source: Offi ce for National Statics Web, the UK accessed in 20 August 2017).
Graph 30 Immigration from EU8 and EU2
Thousand persons
Drawn by myself (Source: Migration Watch UK
Graph 31 Percentages Voting Leave in 23 June 2016 UK Referendum ON Continued EU Membership
Source: Clarke, Harold D, Goodwin Matthew and Whiteley Paul
Cambridge University Press, 2017, p.151 (Original data: Electoral Commission).
Drawn by myself (Based Map: Offi ce for National Statics Web, the UK accessed in 20 August 2017).
North Eastern Asian Crisis
North Korea has nuclear weapons and has tried to launch the Nuclear head ICBM) North Korea has obliviously nuclear weapons and makes North East Asia unstable by National security.
Because fi rstly North Korea has succeeded tests of nuclear weapon in 2006, 2009, 2013 and 2016 while the US of Bush administration and Obama administration could not stop nuclear development of North Korea. Secondly North Korea has been able to attack South Korea, Japan, China, Russia and the US by nuclear weapon being put on a bomber from the beginning of nuclear weapon program.
Thirdly North Korea tried to launch the nuclear head ICBM at 9 September 2016 though the world saw its test fail. If North Korea tries to launch the nuclear head ICBM again and again, the world thinks that North Korea will succeed in launching the nuclear head ICBM in near future by measures of more improvements.
Fourthly North Korea was thought to buy ex-USSR ICBM SS18 rocket booster from Ukraine by way of weapons black market43 and ex-USSR technology has been able to launch long range towards mainland of the US, for example not only Alaska and Hawaii but also San Francisco and Los Angeles and dramatically increase reliability. Now, North Korea can put its missile, if possible the nuclear head, on the range of Beijing, China; Seoul, South Korea; Tokyo, Japan; Vladivostok, Russia; East Coast, the US.
Fifthly tension between North Korea and the US is rising when North Korea repealed the plan to launch ICBM towards Guam, territory of the US by way of Shimane, Hiroshima, Ehime and Kouch Prefecture, Japan in 15 August 2017.
Therefore North Korea which has nuclear weapons and ICBM improved ex USSR SS18 makes it unstable that North East Asia which is China, South Korea and Japan accounts 70 percent of the world's industries44.
Clear and Present Danger
North Korea forced nuclear test in 3rd September 2017. This nuclear test astonished the world while Trump administration of the US has cautioned North Korea. North Korea has declared that it succeeded in the hydrogen bomb experiment. Although this hydrogen bomb is doubtful whether it is true or not, it was no doubt that this nuclear bomb is the strongest in North Korean history of nuclear test.
ICBM Crisis
North Korea could also certificate that it can launch ICBM to Guam in the US from Pyongyang to land in the North Pacifi c Ocean by way of Erimo Cape in Hokkaido, Japan in 15 September 2017. Because this range of ICBN was estimated 3.500 km. Its range of 3,500 km equals to the distance from Pyongyang to Guam 3,599 km. Its ICBM due to ICBM fl ying distance. Even if it does not face Guam and it faces the North Pacifi c Ocean, I said that its missile had made its Guam attack of ICBM practically successful due to ICBM fl ying distance.
Re Starting Six Party Talks
The US, China, South Korea, Russia and Japan which have been members of Six Party Talks about North Korea are more nervous. They also do not have any eff ective means. Because North Korea has broken some international agreements. Security Council resolutions of the United Nations, including economic sanctions, could not crush the regime of North Korea.
Chicken Race" between North Korea and the US I would analyze this situation whether there really is a crisis. This situations around North Korean nuclear bomb & ICBM is called Chicken Race" between North Korean regime and Trump administration of the US. Trump said, North Korea is a rogue nation which has become a great threat and embarrassment to China, which is trying to help but with little success"45.
43 Sam Jones and Katrina Manson, North Korea missile parts linked to Ukraine: Pyongyang said to have used modifi ed version of Russian-designed missile engine", in 15 August 2017 https://www.ft.com/content/546d01ae-80fc-11e7-94e2-c5b903247afd accessed in 21 August 2017.
44 If Donald Trump orders to attack North Korea regardless of sacrifi ce of Seoul, a capital city of South Korea, North Korea probably will be destroyed like Iraq and Syria by tactical nuclear weapons of the US.The blank area of power will born like Iraq and Syria with nuclear contamination. The result of Blank area with nuclear contamination, a tremendous confusion will occur in North East Asia. The global industries will suff er a devastating blow.
45 Donald J. Trump twittered in 3 September 2017.
Defense Secretary, Retired Marine Corps General Mattis said, many military options" for dealing with the North Korean nuclear threat. Our commitment among the allies are ironclad," Any threat to the United States or its territories, including Guam, or our allies will be met with a massive military response, a response both eff ective and overwhelming."46
Framework of Ceasefi re Agreement
The core of this situations lies in the following points. Firstly, North Korea aims at negotiating only with Trump administration of the US as an equal position in order to make peace treaty of Korean War during 1950 and 1953. Secondly, Trump administration of the US requires to abandon nuclear weapons and ICBM. Thirdly, North Korea puts Soul, capital city of South Korea, at the range of cannons while the USA is far and far from North Korea across the Pacifi c Ocean.
Japan out of North Korea, the US, China and Russia At the result of these three points, North Korea never listens to South Korea and Japan warnings, negotiations, even pleas. South Korea is the same ethnic group as North Korea. Japan was a suzerain state of North Korea before WW2. The US has hated to kill American soldiers in order to abandon nuclear weapons and ICBM because of the far-off North Korea. North Korea also never will abandon nuclear weapons and ICBM because nuclear weapons and ICBM were the measure of bringing President Trump to the seat of negotiation. Furthermore North Korea takes 10 million people in Seoul as a hostage. Considering the sacrifi ce 10 million people in Soul by North Korean cannons, the US would not attack North Korea.
Guarantee of Japan, that is, the US Military Base If Trump administration of the US does preemptive strike, North Korea will attack the US military base in Japan, for example the US Fleet Activities Yokosuka, 7th Fleet Base and Kadena US Air Force Base and US Marine Corps Air Station Iwakuni by medium range ballistic missiles. This situation will lead to a full retaliatory attack of the US against North Korea.
Because the US regards an attack on the American base in Japan as an attack on the US territory. If North Korean missile should kill only a civilian, for example a family of solders, sailors and airmen, in American Military Base, Trump administration will not hesitate to attack North Korea with all military power including nuclear attack. These attacks of the US will destroy North Korea like Iraq. Therefore North Korea could not attack the military base in Japan though North Korea often refers to it47.
China is Party of Sino North Friendship Treaty China has been another main party on North Korean nuclear weapons and ICBM. China strongly backed up North Korea during Korean war. After Koean War, China and North Korea signed the Sino-North Korean Mutual Aid and Cooperation Friendship Treaty in 11th July 1961. China is still within the framework of collective self-defense rights with North Korea. Because Article 2 of this treaty declares the two nations undertake all necessary measures to oppose any country or coalition of countries that might attack either nation. Therefore China obviously could never attack North Korea.
This treaty remains in effect and automatically renews every 20 years. This treaty updated in 1981 and 2001. The updated treaty in 2001 will remain in eff ect until 2021.
President Trump Persuades China
Even if President Trump of the US requests China to persuade North Korea, China could not perfectly persuade North Korea because of this treaty. If China completely persuades North Korea to abandon nuclear weapons and ICBM, China might discard this treaty. Discarding this treaty means that China will become an enemy against North Korea and North Korea will turn its aim of ICBM to Beijing, Shanghai and so on48. Therefore, China also could not attack North Korea like the US.
The Solution on North Korean Issues
The resolution of this situation about North
46 CNN Politics WEB, “Mattis warned massive Military response to NK nuclear Threat” in 3 September 2017, (http://edition.cnn.com/2017/09/03/politics/trump-north-korea-nuclear/index.html ) accessed in 4 September 2017.
47 Josef Nye who is a famous professor majored in International Relations, Harvard University often referred it. I often listened to his speech about it in the ISIS/NIKKEI Symposiums on Security in Japan.
Korean nuclear weapons and ICBM concludes that the US, China, Russia, South Korea and Japan will resume Six Party talks, and they will make North Korea sit the table of negotiations, and they will have to persuade North Korea persistently. The other hand, negotiations between the US and North Korea in the United Nations, New York, the US will continue. I think that the deadline of negotiations would be four years later until 2021 when Sino-North Korean Mutual Aid and Cooperation Friendship Treaty will be terminated. At that moment, the aspect surrounding North Korea will change. To be regret, however, North Korea might complete nuclear head ICBM. Now that they could not attack North Korea, it is critical and tolerable moment.
Market Unstable in Japan
Nikkei 225 plunged by about JPY 200 margin by North Korean nuclear test in 3rd September 2017. Investors sell equities to avoid losses. Next day Nikkei 225 continued to plunge to from 19,508 in 4th September to 19,386 in 5th September(Graph 32). Nikkei 225 has reflected by Country Risk" or War Risk" has refl ected Nikkei 225. The crisis which North Korea caused certainly has made Japanese economy unstable.
Disasters of Japan
The series of disasters, indicating by Table 2, has been casting a dark shadow on Japanese psychology in quarter century when Japanese economy fell into recession Heisei recession. Because a series of disasters has killed about 30 thousands people which equals population of a small city. For 25 years, huge earthquakes were two and big earthquakes were 5. Tsunami disaster occurred one. Volcano eruptions were 2. Heavy rains and mudslides were 2.
Especially, Hanshin Awaji Huge Earthquake disaster led 2nd largest economy of Kansai area including Kobe city and Osaka city. Hanshin Awaji Huge Earthquake lost total damage of JPY 1,000 billion (about USD 10 billion:USD1=JPY 100), and killed 6,438 people. To be surprised, after 6 years of Hanshin Awaji Huge Earthquake, East Japan Huge Earthquake occurred including a capital city of Tokyo. East Japan Huge Earthquake killed 21,969 persons including unknown persons 2553 and related kill 3,523 persons as if a conflict in Middle East or Asia. The war against terrorism kills solders, sailors, and pilots & airmen of advanced participated countries. This Huge Earthquake brought JPY 25,000 billion damage of loss (about USD 250 billion/ USD1=JPY100) and destroyed
some supply chains of Global industry.
Graph 32 Nikkei 225 from 31 August 2017 to 5 September 2017
JPY
Drawn by myself (Source: Nikkei 225 Profi le Web:
This Huge Earthquake caused a Big waves which has caused a fatal accident at the First Nuclear Plant in Fukushima prefecture (what is called Fuku-ichi"). A series of disasters eliminate Japanese to buy goods and services. Most Japanese have bought only cheap goods and services. Therefore, Japan has lost demand power
and Japan has remained defl ation still now.
As if Japan is always warning with natural disasters49, human damage and total damage are war itself. The economy of Japan may be more unstable than we think.
Table 2 Disasters of Japan 1991-2017
Month
-Year Name of Disaster Type (person)Killed (person)unknown Related Killed Jun-91 Mt.Unzen Fugen Volcano eruption Volcano 43
Jul-93 Hokkaido Nansei Oki Earthquake Earthquake 202 28
Jan-95 Hsnshin Awaji Huge Earthquake Earthquake 6,435 3
Oct-04 Niigata Tyuetsu Earthquake Earthquake 68
Jul-07 Niigata Tyuetsu Oki Earthquake Earthquake 15
Jun-08 Iwate Miyagi Nairiku Earthquake Earthquake 17 6
Mar-11 East Japan Huge Earthquake EarthquakeTsunami 15,893 2,553 3,523
Sep-11 Heavy Rain in Kii peninsula Heavy Rain 70 15
Aug-14 Hiroshima heavy Rain & Mudslide Heavy Rain 77
Sep-14 Mt. Ontake Volcano eruption Volcano 58 5
Apr-16 Kumamoto Earthquake Earthquake 45
Jul-17 Northern Kyusyu Heavy rain &Mudslide Heavy rain 36
sum 22,966 2,610 3,523
Month
-Year Name of Disaster (person)evacuation (JPY 100million)Total damage Jun-91 Mt.UnzenFugen Volcano eruption
Jul-93 Hokkaido Nansei Oki Earthquake 1,243
Jan-95 Hsnshin Awaji Huge Earthquake 100,000
Oct-04 Niigata Tyuetsu Earthquake 30,000
Jul-07 Niigata Tyuetsu Oki Earthquake 15,000
Jun-08 Iwate Miyagi Nairiku Earthquake 1,519
Mar-11 East Japan Huge Earthquake 347,000 250,000
Sep-11 Heavy rain in Kii peninsula 1,236
Aug-14 Hiroshima heavy Rain & Mudslide 2,354 Sep-14 Mt. Ontake Volcano eruption
Apr-16 Kumamoto Earthquake 183,882 46,000
Jul-17 Northern Kyusyu Heavy rain &Mudslide 1,400
sum 186,236 446,398
made by myself