Contents
TOTO was established as a sanitary ware manufacturer and retailer in 1917, during an era in which Japan still lacked a sewagesys-tem infrastructure, emerging from its founders’ vision to disseminate new hygienic living customs throughout the country. Today, TOTO’s business reaches beyond the realm of toilets to encompass a wide range of plumbing-related fields and products for bath-rooms, kitchens and lavatories. Furthermore, TOTO now operates in leading technological fields, developing advanced ceramics and super-hydrophilic photocatalyst technologies. Not unlike its founding vision, TOTO continues to offer increasingly higher quality products and services with the aim of creating plumbing fixtures for enriched and more comfortable lifestyles.
TOTO aims to add value to lifestyles both in Japan and around the world by taking on active overseas business development.
TOTO LTD. and consolidated subsidiaries Years ended March 31, 2005, 2006 and 2007
Scope of this report: TOTO LTD. and Group Companies Applicable period:
Fiscal 2006 (April 1, 2006 to March 31, 2007)
Note: This report also contains some information outside the applicable period.
2005 2006 2007 2007
Millions of yen Millions of yen Thousands of U.S. dollars
For the year:
Net sales ¥484,192 ¥494,785 ¥512,200 $4,338,840
Operating income 30,419 25,164 26,188 221,838
Net income 13,059 12,997 13,544 114,731
At the year-end:
Total assets ¥460,950 ¥474,824 ¥466,736 $3,953,715
Net assets 199,372 233,552 233,242 1,975,790
Yen Yen U.S. dollars
Basic net income per share ¥37.29 ¥37.12 ¥39.07 $0.33
Cash dividends per share 11.50 12.00 13.00 0.11
Forward-Looking Statements
This annual report contains forward-looking statements, including information about business plans, earnings forecasts and strategies. Such statements reflect TOTO management’s estimates and assumptions based on information available at the time of writing. The accuracy of such statements is inherently uncertain because it is affected by future macroeconomic trends and business environment developments, including consumption trends and competitive challenges.
Profile
Financial Highlights
3
6
9
11
13
34
35
36
A Message from the President
An Interview with the President
Review of Operations
Corporate Governance
Financial Section
International Network
Board of Directors
Corporate Data
The luxurious NEOREST Series tankless toilet with Washlet was designed to add both function and comfort to bathroom environments and prevails as a core TOTO product.
Notes 1: U.S. dollar amounts are stated for convenience only, using the exchange rate prevailing on March 31, 2007: ¥118.05 = US$1.00.
TOTO is making every effort to alleviate its reliance on new housing demand by bolstering its remodeling and overseas businesses.
In fiscal 2006, ended March 31, 2007, TOTO’s consoli-dated net sales climbed 3.5% compared to the previous fiscal year to ¥512.2 billion, marking the fifth consecutive year of revenue growth. Operating income also increased in fiscal 2006, rising 4.1% year on year to ¥26.2 billion. Despite the severity of a fluctuating operating environ-ment, in which raw material prices peaked and the impact of lower-priced general products increased, earnings expanded. This growth was attributed to well-planned cost-cutting measures, a rise in remodeling and new housing business sales, and surging sales overseas, mainly in the United States and China.
Moving ahead, TOTO will work to sustain this continu-ous growth of revenues and earnings in order to fulfill stakeholder expectations. To this end, we are striving to achieve the targets of our new Medium-Term Management Plan, which is being carried out over the three-year period from April 2007 to March 2010. Our tar-gets for the final year of the Plan are net sales of ¥590.0 billion, operating income of ¥45.0 billion and ROE of 10%.
On May 15, 2007, TOTO welcomed its 90th anniversary by changing its Japanese corporate name, retiring Toto Kiki Kabushiki Gaisha and inaugurating TOTO Kabushiki Gaisha. Symbolic of a deeper transition ahead, TOTO is implementing a shift away from its position as a house-hold fixtures manufacturer toward becoming a creator
Overview of Fiscal 2006:
Expansion in Revenues and Earnings
Preserving Our Status as a Company
Indispensable to Customers,
Shareholders and Society
Take pride in your work,
and strive to do your best
High-quality and homogeneous products
Service and trust
Cooperation and progress
and provider of new lifestyle value. Looking back on the 30-year generation spans in TOTO’s history, each has been characterized by a major shift in the Company’s business activities. In keeping with this tradition, fiscal 2007, the initial year of our fourth generation, will be duly marked as a year of transition.
Through the creation and provision of new lifestyle value, the TOTO Group intends to exceed all previous performance results as it works to continue being a company indispensable to customers, shareholders and society.
Teruo Kise, President
Toyo Toki Kabushiki Gaisha Changed name to Toto Kiki Kabushiki Gaisha
1st
Generation30 years Establishment May 1917
2nd
Generation30 years 30th Anniversary May 1947
3rd
Generation30 years
4th
Generation30 years 60th Anniversary
May 1977
90th Anniversary May 2007
1970
Changed name to TOTO Kabushiki Gaisha May 2007
Missions
UNIVERSAL DESIGN
in Everyday Living
Living and Ecology
Bonds that Exceed
Service
TOTO works towards the development of plumbing-related products and spaces that can be utilized safely and comfortably regardless of age or physical mobility
TOTO works towards the development of ecologically friendly products and technologies that contribute to environmental consciousness in everyday living
TOTO considers the viewpoints of customers as it works towards strengthening everlasting relationships of trust Company Motto----Steadfast Throughout Time
In 1962, TOTO created its company motto to distinguish the tone of its future business activities while continuing to respect its origins and traditions.
“Take pride in your work, and strive to do your best” embodies our determination to contribute to the advance-ment of society and improve the lifestyles of customers with a strong service mentality.
TOTO Group Corporate Philosophy
The TOTO Group strives to create a great company, trusted by people all around the world,
and contribute to the betterment of society.
To achieve our philosophy, TOTO will:
●Create an enriched and more comfortable lifestyle and culture built on plumbing products. ●Pursue customer satisfaction by exceeding
expectations with our products and services. ●Provide high-quality products and services
through ongoing research and development. ●Protect the global environment by conserving
finite natural resources and energy.
●Create an employee-friendly work environment that respects the individuality of each employee.
A Message from the President
Q2: What are the aims of TOTO’s new Medium-Term Management Plan? A: On May 15, 2007, we celebrated TOTO’s 90th anniversary. We also wel-comed a new era in TOTO history with a change in our Japanese corporate name, from Toto Kiki Kabushiki
Gaisha to TOTO Kabushiki Gaisha. In 2017, TOTO will reach its 100th year. Until we reach this historic mile-stone, we have committed ourselves to further expanding our global reach. By 2017, TOTO will have established a five-polar global structure, adding Europe to our existing markets of Japan, the United States, China, and Asia and Oceania. With this view, the aim of our new Medium-Term Management Plan over the next three years is to achieve everything necessary to facilitate our long-term corporate vision for 2017.
Q3: What performance targets does the Company aim to achieve under the new Medium-Term Management Plan?
Q1: Before discussing TOTO’s new plan, would you please give us a brief overview of the last medium-term management plan?
A: The medium-term management plan that we undertook between fiscal 2004 and fiscal 2006 was characterized by a three-point growth strategy, which included the Remodel 21 Plan, Global 21 Plan and Only One 21 Plan, as well as a two-part strategy to strengthen the corporate foundation consisting of the Challenge 21 Plan and Revolution 21 Plan. These strategies provided the basis for our efforts to create markets for our products and take another huge step forward in our evolution. As a result, net sales for fiscal 2006, the final year of the plan, had grown 9.5% com-pared to fiscal 2003. We are particularly proud of the remarkable progress we made in terms of overseas sales results: they soared 67% over that same time frame. Unfortunately, the impact of severe price competition and high material prices held back growth in recurring profit, which increased 2.3% compared to fiscal 2003. As we move forward with our efforts to expand sales, we also recognize the need to further reduce costs and improve productivity.
A: For fiscal 2008, we are targeting net sales of ¥560.0 billion and a record-breaking ¥35.0 billion in recurring profit. In fiscal 2009, the final year of the plan, we aim to achieve ¥590.0 billion in net sales, a 15% increase compared to fis-cal 2006, and ¥42.0 billion in recurring profit, a 66% increase. Our ROE target is 10%.
In terms of projected net sales by business field over the course of the plan to fiscal 2009, we foresee a 10% decrease in new housing sales, owing to a decrease in the number of new housing starts, a 30% increase in remodeling sales, a 35% expansion in new business sales due to ceramic business growth, and 40% growth in overseas sales.
Q4: Please tell us about TOTO’s main approach toward achieving these goals.
A: The new plan’s two major policies are to strengthen CSR management and promote the Six-Point Plan.
By strengthening CSR management, we hope to become more deeply aware of our social responsibilities as a corpo-rate entity. Specifically, this entails tak-ing a more aggressive approach to environmental conservation, compli-ance, corporate ethics, social contribu-tion, employee rights and risk
TOTO Group Corporate Code of Conduct
The TOTO Group is committed to working for the benefit of global society at large while pursuing profits through fair competition. The TOTO Group Corporate Code of Conduct is the basis for the activities of all TOTO employees who endeavor to satisfy all of its stakeholders.
1. In pursuing customer satisfaction, TOTO shall provide products and services that preserve the global environment and are user friendly. 2. TOTO shall engage in all corporate activities in good faith,
respecting human rights, and complying with all laws and regulations regarding transparent and open behavior. 3. TOTO shall proactively disclose the appropriate corporate
information as necessary to facilitate communications with society. 4. TOTO shall strive to provide comfortable lifestyles in each society
by ensuring a safe and pleasant working environment and respecting individuality and diversity among all its employees. 5. TOTO shall effectively use global resources and conserve limited
resources.
6. TOTO shall contribute to local communities as a responsible corporate citizen.
7. TOTO shall discourage anti-social behavior.
8. TOTO shall contribute to the development of diverse worldwide cultures and customs by respecting the diversity of each country’s business customs as TOTO respects international rules and regulations.
9. TOTO’s top management aims to thoroughly instill its corporate ethics while performing their roles and responsibilities as leaders. 10. TOTO’s top management shall strive to resolve, as they arise, all
issues that conflict with the Code of Conduct.
Vision
Dynamic
TOTO aims to create a dynamic company with a globally competitive business structure and a brand name that is recognized and
supported by customers around the world
Vibrant
TOTO aims to create a more vibrant company by facilitating communication with customers and motivating employees
Excellent
TOTO aims to create an excellent company that is highly transparent, has strong ethical standards and gains the trust of society
Toward a Dynamic, Vibrant, and Excellent TOTO
Customers
Customer satisfaction is the guiding principle for all our endeavors
Employees
* Becoming an innovativecompany that employees enjoy
Society
Creating trust we can be proud of as a member
of society
Shareholders
Meeting the expectations of shareholders
Business
Partners
Beneficial coexistence with business partners
Remaining
a company
indispensable
to society
* TOTO defines all the people who work for the TOTO Group as employees. Company
Motto
TOTO Group Corporate Philosophy
TOTO Group Corporate Code of Conduct
Vision
Mission
Medium-Term Management Plan
Sharing TOTO Values Across the Group
Fulfilling TOTO’s Mission as a Group
More specific guidelines are set forth in the TOTO Group Corporate Code of Conduct.
Toward a Dynamic, Vibrant, and Excellent TOTO
TOTO Group Management Philosophy System
Common Group Philosophy— Future Vision and Ethics
The common Group philosophy represents the inherited values of TOTO that are shared among employees and will be carried forward into the future.
Business Vision— Ability to Take Action Our business vision is positioned as the vision and mission of our business activities that change in accordance with the demands of the times.
UNIVERSAL DESIGN in Everyday Living
Living and Ecology Bonds that Exceed Service
An Interview with the President
April 1, 2007, marked the start of TOTO’s new fiscal 2007 – 2009 Medium-Term Management
Plan. As the Company prepares to leap ahead and onto a broader global stage, President
Teruo Kise responded to our queries about the goals and strategies of this new plan.
100 150 200 250 300 350 400 450 500 550 600
’91 ’92 ’93 ’94 ’95 ’96 ’97 ’98 ’99 ’00 ’01 ’02 ’03 ’04 ’05 ’06 ’07 ’08 ’09
25.2
512.2530.0 560.0
590.0
Consolidated net sales Consolidated r
ecurring pr
ofit
Net sales (Billions of yen) Recurring profit (Billions of yen)
management issues. Because our ulti-mate aim is to take on greater social responsibilities globally, we will work to address these social issues not only in Japan, but also in every country and region where we operate around the world.
The six strategic plans of our Six-Point Plan are Remodeling, Global, Only One, Challenge, Revolution and Quality. As we carry out each of these strate-gies, we will simultaneously endeavor to deliver products and services that exceed customer expectations. Specifically, the purpose of the Global Plan is to facilitate our next big step for-ward as a global company, while the Remodeling Plan will serve as a means to fortify the basic foundation of the Company structure. We will work espe-cially hard in both of these areas.
tact. As of the end of the fiscal 2006, we had showrooms in Beijing,
Shanghai, Guangzhou, and Honk Kong, China; in the U.S., in New York City, Los Angeles, and Florida State; as well as in Bangkok, Dubai and Abu Dhabi. Showrooms in other major cities of our target markets are being planned.
Turning to Washlet sales, which grow steadily every year in overseas markets, we are targeting a 90% increase over the next three-year period. We are par-ticularly striving to expand sales in the United States and China.
Finally, we will implement supply strategies that allow for the creation of a risk-resistant supply structure.
Furthermore, by jostling to secure a formidable position in the European market, which is saturated with high-end plumbing-related product brands, we intend to achieve our goal of estab-lishing a five-polar structure and becom-ing a company with a true global reach.
Q6: Please tell us about the Remodeling Plan.
A: Over the next three years, the num-ber of aging residential structures, con-dominiums and nonresidential buildings will rise. These structures will have been built 13 or more years ago, which means a surge in plumbing-related product replacement and remodeling demand.
This is the impetus for further strengthening the remodeling business in the Japanese market. With the goal of thoroughly providing new lifestyle value to customers, we have divided this plan into three specific parts. The first part is improving the quality of con-sulting at showrooms by adding to the number of advisers at each of our showrooms. This will increase customer contacts, and accordingly, our consul-tation execution ratio and consulconsul-tation quality, and thereby raise the number of orders we receive.
Second is enhancing the quality of Remodel Club Stores, which is our net-work of local construction companies, by implementing a variety of supportive measures to help bolster management practices and proposal capabilities. Our goal here is to have Remodel Club Stores become community-based builders that can create demand through skillful construction and earn the trust of customers.
Third is facilitating optimal solution proposals to customers by offering
products that meet the specific demands of each type of remodeling project, whether single-house, condo-minium or non-residential.
Q7: In what ways is TOTO working to fulfill its Only One Plan? A: Our Only One Plan encourages the use of proprietary technologies to cre-ate universal design and eco products that convey TOTO’s unique sense of product design.
TOTO Universal Design (UD) Research Center is the largest universal design research facility in Japan. This is where we carefully study people’s movements to create easy-to-use prod-ucts so that as many people as possible can benefit from our UD-conscious designs.
Also, as part of our eco-product development efforts to meet anticipated high demand for water-efficient toilets, we are using simulation technologies to promptly develop a toilet that flushes
like no other toilet does.
Q8: Please tell us how TOTO’s strategy to strengthen the corpo-rate foundation sup-ports its growth strategy.
A: First, the goals of our Challenge Plan are to create a high-spirited work environment in which each and every
TOTO employee is able to fulfill his or her potential; cultivate a workforce able to work autonomously; and improve communication between employees.
The Quality Plan aims to create a business structure that provides prod-ucts and services revered around the world. In order to accomplish this, we will work to improve product quality, fortify activities that effectively prevent the emergence of complaints and claims against the Company, and raise customer satisfaction at customer points of contact.
The Revolution Plan aims to realize a corporate structure able to continually produce high-quality products at opti-mal cost and a safe work environment. Through innovative activities in each of our operating divisions from manufac-turing, sales and back offices, we will move forward toward restructuring TOTO’s profit generation and business structures.
Q9: In closing, what is TOTO’s policy on providing shareholder returns?
A: TOTO considers the return of profit to shareholders as priority management issue. We adopt a basic policy of paying stable dividends to shareholders and enhancing retained earnings while tak-ing into consideration business struc-ture reinforcement and fustruc-ture business development. Accordingly, we aim for a dividend payout ratio of over 30% of consolidated net income.
Strengthen CSR management from a global perspective
Major Policies
Growth Strategies
Strategies to Strengthen Corporate Foundation Remodeling Global Only One Challenge Quality Revolution Strengthen CSR management
Promote Six-Point Plan
Six-Point Plan 0 20 40 60 80 100 120 FY2006 Net sales (Billions of yen)
*Gross = Net sales including intra-group transactions
FY2009 ASEAN and others China North and Central America (35%) (41%) (23%) 81.7 108.0 (36%) (40%) (24%) +35% +27% +38% +32% Sales distribution ratio Growth rate compared with FY2006
Target Growth Rate and Distribution Ratio of Gross* Overseas Sales
FY2003 FY2004 FY2005 FY2006 FY2007 FY2008 FY2009
0 100 200 300 400 500 600 Net sales (Billions of yen)
FY2006→FY2009 Growth Rate
Net Sales by Business Field
467.9 484.2 494.8 512.2 530.0
560.0 590.0 New housing New business Overseas Remodeling -10% +30% +35% +40% +15%
FY2007 — FY2009 Plan
Q5: One of the pillars of TOTO’s growth strategy is its Global Plan. Can you elaborate on this aspect?
A: As I mentioned before, TOTO is aiming to estab-lish a five-polar structure by the year 2017. Part of this includes our aim to
elevate TOTO’s brand image in various regions as global luxury brand by raising a greater awareness of the success TOTO has had as a high-end bathroom-related products brand in the U.S. and China.
In order to achieve this goal, we will promote three specific strategies. The first are merchandise strategies for introducing our flagship and high-perfor-mance products. For example, in the case of our top-of-the-line toilet model NEOREST, we will introduce the NEOR-EST Suite, which will include bathtubs, faucets and other bathroom and toilet hardware, in addition to toilets. We will also place emphasis on marketing our automatic faucets and ultra-water-sav-ing 4.8-liter toilet, based on improved TOTO water-saving technologies. With an emphasis on U.S. and Chinese mar-kets, we plan to continuously and suc-cessively release these
high-performance products. Secondly, we will implement sales and communication strategies that rein-force our structure of customer points of contact and increase market
dissemi-nation of the Washlet. As such, by setting up showrooms in major cities in target markets, with an eye to attaining market dominance as a luxury brand, we will be able to demonstrate the value appeal of our products. The key to doing this is increasing customer points of
con-The Bangkok showroom opened in August 2006 exhibits the appeal of TOTO restrooms as living spaces in a spacious atmosphere
TOTO showroom advisor in Japan offers ideal remodeling solu-tions to customer
Review of Operations
Restroom Products
Product enhancements to TOTO’s popular toilets with easy-to-clean rim-less basins and thoroughly cleaning Tornado flushing systems resulted in an increase in the number of units sold in the fiscal year under review. In August 2006, TOTO improved its most luxurious one-piece tankless toilet with Washlet, the NEOREST Series, with the release of the new NEOREST. This toilet features greater water efficiency with a six-liter per flush, down from eight liters, and an enhanced Washlet nozzle designed for greater cleanliness and an overall streamlined look.
In November 2006, TOTO also completed development of new six-liter per flush, water efficient models for each of its PureRest compact tank-style toilet and Z Series tank-tank-style toilet with Washlet.
Amid increasing demand for Washlet replacements, TOTO has stepped up its efforts to meet customer needs for a variety of new lineup models, releasing the NEW Apricot with an easier-to-clean design in February 2007.
In addition, in February 2006, TOTO introduced the Restpal SX Series, an easy-to-install toilet compatible with unique condominium plumbing systems. Building on product lineups for single-house remodeling pro-jects, TOTO is now working to strengthen its lineup geared specifically for condominium remodeling.
As a result of these efforts, restroom product net sales climbed 2.1% to ¥209.9 billion. Operating income, meanwhile, slid 2.8% year on year to ¥31.2 billion, owing to the expansion of general products and lower overall selling prices, attributable to a changing demand structure in this product field.
Bath, Kitchen and Wash Products
Sales in the bath product category steadily increased owing to the addi-tion of a condominium installaaddi-tion lineup of TOTO’s widely acclaimed ther-mal pot Mahobin Bath to augment its mainstay single-housing unit bath lineup. Also, in February 2007, TOTO demonstrated efforts to further enhance its product power by introducing Sukkiri Kabe, a type of shower wall that effectively resists mold and grime buildup.
In kitchen products, sales were favorable for the modular kitchen CUISIA Series, which realizes a harmonized living and dining space envi-ronment. In August 2006, TOTO released CUISIA A-shape plan modular kitchen with a workspace designed for increased efficiency in food preparation.
In washbasin/vanity products, in April 2006, TOTO released its New Component J washbasin/vanity unit that features an aesthetically pleasing streamlined design, followed by the February 2007 launch of Remodea, a washbasin/vanity ideal for condominium bathroom remodeling projects.
As a result, compared to the previous fiscal year, net sales of bath, kitchen and wash products increased 5.3% to ¥262.1 billion, while operat-ing income dropped 16.0% to ¥5.6 billion, mainly impacted by high material prices.
Commitment to Continuous Product Perfection
Equipment for Construction
Other Products
TOTO’s efforts to improve its customer response capabilities and enhance product lineups resulted in sales growth of Sankanou bathroom ventila-tion, heater and drying equipment and the Clean Dry lavatory hand dryers. On the other hand, sales of welfare equipment and counter-type dish-washers and dryers waned due to increasingly intense competition. As a result, net sales of other products fell 6.1% year on year to ¥27.4 billion. Operating loss improved to ¥0.1 billion compared to ¥0.5 billion in the pre-vious fiscal year.
The luxurious NEOREST one-piece tankless toilet with Washlet features a rimless basin, Tornado flushing system and greater water efficiency using a six-liter flush.
The Washlet Apricot Series with an enhanced nozzle design provides a streamlined look and added cleanliness.
The space-saving Restpal SX compact toilet system features storage cabinets, Washlet toilet and more. Compatibility with unique condominium plumbing systems allows for easy installation.
The heat-retaining Flowpia Mahobin Bath KG Series and easy-to-clean Sukkiri Kabe wall material provide newly combined comfort and cleanliness.
The CUISIA A-shape plan modular kitchen realizes maximum workspace efficiency.
The warm-air Clean Dry lavatory hand dryer dries hands thoroughly.
TOTO’s electrostatic chucks for semiconductor manufacturing equipment have gained high recogni-tion in the market.
Notes 1: Net sales by segment include intra-group sales and transfers. 2: Figures are rounded down.
Other 4%
Equipment for Construction 96%
Restroom Products 40%
Other Products 5%
Bath, Kitchen and Wash Products 51%
Net sales in the Equipment for Construction segment rose 3.2% year on year to ¥499.5 billion, while operating income fell 4.2% to ¥36.6 billion.
Net sales in the Other segment increased 8.0% to ¥23.0 billion. In addition, the segment returned to profitability, recording ¥1.5 billion in operating income compared to an operating loss of ¥0.5 billion in the previous fiscal year.
This sales and income growth is attributed to TOTO’s continued enhancement of household goods with photocatalyst decomposi-tion capabilities and hydrophilic properties, compounded by a steady recovery in demand for electrostatic chucks, optical ferules, large precision ceramic components and other advanced ceramic products.
Composition of Net Sales by Product Category
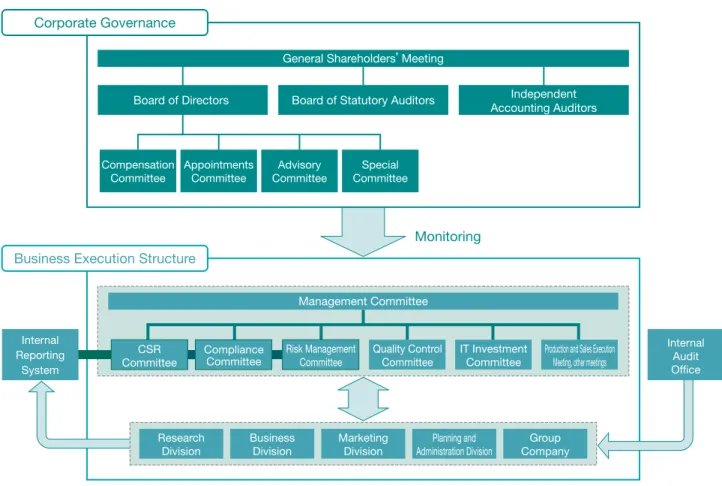
(Year ended March 31, 2007)objectivity and transparency regarding the appointment and dismissal of directors.
●TOTO’s Compliance Committee and Risk Management
Committee, both chaired by the President, were established to reinforce compliance measures and promote risk man-agement─equally essential management issues. Enhancements implemented in fiscal 2006 to the functions of these committees resulted in Groupwide improvements to the corporate governance structure.
●To enhance objectivity in its management stance, TOTO
chooses to appoint two external directors. Drawing on the judgment of these external directors, who are able to offer fresh, broad viewpoints irrespective of constricted, industry-specific perspectives, allows TOTO to conduct a more
equi-Management Structure
●TOTO’s Board of Directors, Board of Statutory Auditors and
independent accounting auditors comprise the main com-ponents of the Group’s management structure. Maintenance of this structure assures appropriate conduct of decision-making and the execution of operations in con-formity with relevant laws and the Company’s Articles of Incorporation. The adoption of an executive officer system ensures prompt decision-making and transparent manage-ment accountability.
●TOTO’s Advisory Committee receives management-related
advice from outside experts. The Company’s Compensation Committee, which consists of outside experts and internal directors, maintains objectivity and transparency in deter-mining directors’ compensation. The Appointments Committee, comprised of representative directors, ensures
table corporate management with greater transparency.
●Aiming to reduce the risk of damage to corporate value,
TOTO introduced a policy to respond to large-scale pur-chases of the Company’s shares (anti-takeover measures). Under this policy, TOTO established certain rules that stipu-late the provision of sufficient and appropriate information regarding the occurrence of large-scale purchases to share-holders in order to protect shareshare-holders’ interests. TOTO will seek consultation from the Special Committee, which is set up on an as-needed basis, independent of the Board of Directors, to handle and guarantee the rational, fair, and objective determination of the necessity for countermeasure actions.
Internal Control System
●With the aim of establishing a more valuable internal control
system, TOTO set up the Internal Audit Office as a supervi-sory entity independent of its executive divisions. The Internal Audit Office evaluates and verifies TOTO’s various business activities to ensure they are conducted efficiently and effectively and in compliance with relevant laws and regulations, the TOTO corporate philosophy, and the Company’s policies and rules.
Furthermore, the establishment and operation of an inter-nal reporting system, which comprises TOTO’s own interinter-nal compliance-related division and an external third-party organization, serves as a direct line of contact for employ-ees, clients and other relevant parties to report violations of law and other compliance issues.
Corporate Governance
Management Committee
Risk Management Committee
Business Division
Marketing Division Research
Division
Group Company Planning and
Administration Division IT Investment
Committee Quality Control
Committee
Production and Sales Execution Meeting, other meetings CSR
Committee Internal
Reporting System
Internal Audit Office
Business Execution Structure
Board of Statutory Auditors
Monitoring
Independent Accounting Auditors Board of Directors
Advisory Committee Compensation
Committee
Appointments Committee
Special Committee
Compliance Committee
Corporate Governance
TOTO Group Management Structure(
As of April 2007)General Shareholders’Meeting
The TOTO Group strives to continually enhance
the impartiality and transparency of its
management structure
Function
Conducts management decision-making and supervision of directors’ management operations
Receives reports, discusses and decides on important auditing-related matters
Outside experts of the committee provide advice on overall company management
Deliberates and reports regarding basic executive compensation policies and systems, and
individual compensation
Ensures objectivity and transparency regarding the appointment and dismissal of directors
Provides advice for the fair determination of the necessity for countermeasure implementation in the event of a large-scale purchase proposal
Members
Directors
Statutory auditors
Outside experts and internal
directors
Outside experts and internal
directors
Representative directors
Outside experts
Number of Members
16
4
9
5
4
3
Frequency of Meetings
1/month
1/month
3/year
1/year or more
1/year or more
As needed Board of
Directors
Board of Statutory Auditors
Advisory Committee
Compensation Committee
Appointments Committee
Financial Section
Financial Section
Management’s Discussion and Analysis of Operations
Six-Year Summary of Selected Financial Data
TOTO LTD. and Consolidated Subsidiaries
Years ended March 31
2002 2003 2004 2005 2006 2007 2007
Millions of yen Thousands of Millions of yen (except per share amounts) (except per share U.S. dollars (Note 3)
amounts) (except per share amounts)
Net sales ¥ 424,097 ¥ 439,683 ¥ 467,925 ¥ 484,192 ¥ 494,785 ¥ 512,200 $4,338,840
Cost of sales 277,910 285,154 300,355 308,067 321,214 337,735 2,860,949
Cost of sales ratio 65.5% 64.9% 64.2% 63.6% 64.9% 65.9% —
Gross profit 146,187 154,529 167,570 176,125 173,571 174,465 1,477,891
Selling, general and
administrative (SG&A) expenses 134,565 136,909 140,136 145,706 148,407 148,277 1,256,053
SG&A ratio 31.7% 31.1% 29.9% 30.1% 30.0% 28.9% —
Operating income 11,622 17,620 27,434 30,419 25,164 26,188 221,838
Operating margin 2.7% 4.0% 5.9% 6.3% 5.1% 5.1% —
Income before income taxes
and minority interests 3,691 10,807 24,463 23,455 21,972 21,829 184,913
Net income 1,139 4,073 11,732 13,059 12,997 13,544 114,731
Capital investment 19,700 14,500 20,600 20,100 22,400 22,300 188,903
R&D expenses 12,259 11,298 11,366 11,786 11,722 11,752 99,551
R&D expenses ratio 2.9% 2.6% 2.4% 2.4% 2.4% 2.3% —
Cash flow (14,597) 9,164 18,613 (15,448) 4,292 (7,250) (61,415)
Basic net income per share
(yen and U.S. dollars) ¥ 3.08 ¥ 11.05 ¥ 33.63 ¥ 37.29 ¥ 37.12 ¥ 39.07 $ 0.33
Cash dividends per share applicable
to the year (yen and U.S. dollars) 10.00 10.00 11.00 11.50 12.00 13.00 0.11
Total assets ¥ 488,207 ¥ 471,482 ¥ 462,622 ¥ 460,950 ¥ 474,824 ¥ 466,736 $3,953,715
ROA 0.2% 0.8% 2.5% 2.8% 2.8% 2.9% —
Total current assets 215,729 219,919 224,075 218,598 214,130 217,780 1,844,812
Fixed assets 272,478 251,563 238,547 242,352 260,694 248,956 2,108,903
Net property, plant and equipment 183,199 172,994 164,492 163,126 166,757 161,045 1,364,210
Total investments and other assets 89,279 78,569 74,055 79,226 93,937 87,911 744,693
Total liabilities ¥ 287,158 ¥ 283,980 ¥ 263,098 ¥ 250,684 ¥ 241,272 ¥ 233,494 $1,977,925
Total current liabilities 155,347 172,331 168,367 158,870 154,249 181,951 1,541,305
Total long-term liabilities 131,811 111,649 94,731 91,814 87,023 51,543 436,620
Net assets 191,946 178,312 189,857 199,372 233,552 233,242 1,975,790
ROE 0.6% 2.2% 6.4% 6.7% 6.2% 6.0% —
Notes 1: Cash flow = Net increase (decrease) in cash and cash equivalents.
2: Effective the fiscal year ended March 31, 2007, the Company has adopted a new accounting standard for the presentation of net assets in the balance sheet and the related implementation guidance. Consequently, total shareholders’ equity for the fiscal year ended March 31, 2006 has been restated as net assets to conform to the new accounting standard. Net assets from the fiscal years ended March 31, 2002 to 2005 are equivalent to total shareholders’ equity based on the previous accounting standard.
494.8 512.2
467.9
439.7
484.2
Net Sales
Billions of yen
2007
2003 2004 2005 2006
0 25 50 75 100 321.2 337.7
300.4
285.2
308.1
Cost of Sales and Cost of Sales Ratio
Billions of yen
2007
2003 2004 2005 2006
%
0 2 4 6 8
25.2 26.2
27.4
17.6
30.4
Operating Income and Operating Margin
Billions of yen
2007
2003 2004 2005 2006
%
Scope of Consolidation
The TOTO Group’s consolidated financial statements reflect the
performance of TOTO LTD., 56 consolidated subsidiaries (37
domestic, 19 overseas) and seven affiliated companies (two
domestic, five overseas) accounted for under the equity method.
A sanitary ware manufacturing subsidiary established in Mexico last
year was newly added to the scope of consolidation. Furthermore,
two domestic subsidiaries were excluded due to a merger.
Market Environment
In the fiscal year ended March 31, 2007, the domestic economy
exhibited a modest recovery spurred on by improvements in
employment conditions and personal income on the back of
healthy corporate earnings. In the housing equipment industry,
the number of new housing starts of both single-unit housing and
condominiums expanded to 1,280,000 units, an increase of
34,000 units compared to the previous fiscal year. Likewise,
demand for remodeling was strong. Despite this growth, the
operating environment remained harsh on the earnings front due to
intensified price competition and sharp rises in raw material prices.
Revenues and Earnings
In the fiscal year under review, TOTO LTD. and its consolidated
subsidiaries saw a modest 3.5% increase in net sales, year on
year, to ¥512.2 billion. Sales by business field were strong all
around with healthy new housing and remodeling sales and a
substantial increase in overseas sales.
Cost of sales climbed 5.1% year on year to ¥337.7 billion. The
cost of sales ratio rose 1.0 percentage point, from 64.9% in the
previous fiscal year to 65.9%. Gross profit rose slightly to ¥174.5
billion, while the gross profit ratio slipped 1.0 percentage point,
from 35.1% to 34.1%, owing mainly to high raw material prices
and the increased quantity of lower-priced general products in
the market.
Selling, general and administrative (SG&A) expenses remained
on par with the previous fiscal year, amounting to ¥148.3 billion.
The ratio of SG&A expense to net sales dropped 1.1 percentage
points, from 30.0% to 28.9%.
Accounting for the above factors, operating income in the fiscal
year ended March 31, 2007 increased 4.1%, year on year, to
¥26.2 billion. The operating margin remained unchanged at 5.1%.
In other income and expenses, an expenditure excess of ¥3.2
billion in the previous fiscal year increased to ¥4.4 billion. Primary
expense components were a ¥3.1 billion loss on inspection and
repair of products, mainly related to toilets with warm bidet
Washlet seats, and a ¥1.7 billion loss on impairment of fixed
assets. Major income items were gain on sale and disposal of
Financial Section
As a result of the above, income before income taxes and
minority interests in the fiscal year under review dipped 0.7%
compared to the previous fiscal year to ¥21.8 billion. Net income
rose 4.2% to ¥13.5 billion, while return on sales remained
unchanged at 2.6%. Basic net income per share improved from
¥37.12 to ¥39.07, while diluted net income per share also
increased, from ¥36.13 to ¥37.96.
Dividends
The Company considers the return of profits to shareholders as
an essential part of its management stance, and adopts a basic
policy of paying stable dividends to shareholders and enhancing
retained earnings while taking into consideration business
founda-tion reinforcement and future business development. Accordingly,
with a view to establishing a sound long-term business
founda-tion, the Company applies retained earnings to raising product
competitiveness, enhancing and strengthening production and
sales structures, and developing new and overseas businesses.
Furthermore, the Company aims for a dividend payout ratio of
30% of consolidated net income.
In the fiscal year under review, the Company’s annual cash
dividends per share increased ¥1.0 per share to ¥13.00 per share
(including a ¥6.50 per share interim dividend). This resulted in a
dividend payout ratio of 33.3%.
Financial Position
As of March 31, 2007, consolidated total assets amounted to
¥466.7 billion, a decrease of ¥8.1 billion from the previous fiscal
year end.
Total current assets increased by ¥3.7 billion to ¥217.8 billion.
Trade notes and accounts receivable rose ¥2.0 billion and
inventories increased by ¥6.0 billion. Cash and cash equivalents,
however, declined ¥7.3 billion.
Net property, plant and equipment decreased ¥5.7 billion to
¥161.0 billion. Total investments and other assets declined ¥6.0
billion to ¥87.9 billion, primarily owing to a decrease in investment
securities of ¥4.4 billion.
Total current liabilities grew ¥27.7 billion from the end of the
previous fiscal year to ¥182.0 billion. Major factors underlying this
increase were the transfer of long-term liabilities to convertible
bonds due within one year, increasing the current portion of
long-term debt to ¥30.4 billion, as well as ¥3.1 billion in accrual for loss
on inspection and repair of products. Short-term bank loans
decreased ¥4.1 billion from the end of the previous fiscal year.
Total long-term liabilities decreased ¥35.5 billion from the
previous fiscal year-end to ¥51.5 billion, mainly due to the
afore-mentioned transfer of convertible bonds due in 2008 to current
liabilities. In addition, accrued retirement benefits for employees
declined ¥5.0 billion.
Interest-bearing debt (the total of short-term bank loans,
current portion of term debt, commercial paper and
long-term debt) declined ¥5.1 billion to ¥70.7 billion.
Working capital at the fiscal year-end totaled ¥35.8 billion, a
¥24.1 billion decline from the prior fiscal year-end. The current
ratio declined from 1.39 times to 1.20 times.
From the fiscal year ended March 31, 2007, the Company
adopted a new accounting standard regarding the presentation of
net assets in the balance sheet whereby minority interests are
included in net assets, which replaces shareholders’ equity. Total
net assets at the fiscal year-end stood at ¥233.2 billion. The equity
ratio (net assets minus minority interests divided by total assets)
improved 2.4 percentage points, from 46.6% to 49.0%. Return
on equity dipped 0.2 of a percentage point, from 6.2 % to 6.0%.
Net assets per share, based on the weighted-average number of
shares outstanding during the fiscal year under review, increased
from ¥638.38 to ¥659.68.
R&D Expenses
The TOTO Group undertakes R&D activities in line with its mission
to create lifestyle value, while at the same time pursuing only-one
technologies and the realization of products imbued with TOTO’s
unique qualities.
While aiming to create products that provide customers with
daily ease and comfort, TOTO also strives to develop water- and
energy-efficient environmentally sound products. These efforts are
typified by enhancements to product lineups that help to reduce
plumbing-related CO2emissions, such as our energy-saving,
six-/five-liter per flush (big and small flushing options, respectively)
toilets and the highly acclaimed, revolutionary thermal pot
Mahobin bath that maintains bathwater temperatures.
TOTO also promotes the development of universal design (UD)
products that provide ease-of-use for everyone as well as offer
safety and comfort in everyday living. At the core of this effort is
the Company’s UD Research Center.
In addition, the Company aggressively pursues new
techno-logical developments in photocatalyst technology and solid oxide
fuel cells.
Research and development expenses (included in SG&A
expenses) remained relatively even with the previous fiscal year,
amounting to ¥11.8 billion. The ratio of R&D expenses to net
sales was 2.3%. By segment, R&D expenses totaled ¥8.5 billion
in Equipment for Construction and ¥0.9 billion in the Other
segment. A further ¥2.4 billion in R&D expenses were unallocated
to specific business.
13.0 13.5
11.7
4.1
13.1
Net Income
Billions of yen
2007
2003 2004 2005 2006
37.12 39.07
33.63
11.05
37.29
Basic Net Income per Share
Yen
2007
2003 2004 2005 2006
0 1 2 3 4 474.8 466.7
462.6
471.5 461.0
Total Assets and ROA
Billions of yen
2007
2003 2004 2005 2006
%
0 0.5 1.0 1.5 2.0 Current Ratio
2007
2003 2004 2005 2006
Times
0 2 4 6 8 233.6 233.2
189.9
178.3
199.4
Net Assets and ROE
Billions of yen
2007
2003 2004 2005 2006
%
11.7 11.8
11.4
11.3 11.8 R&D Expenses
Billions of yen
2007
Financial Section
Capital Investment and Depreciation
In the fiscal year under review, the Group’s capital investment
totaled ¥22.3 billion, down slightly by ¥0.1 billion from the
previ-ous fiscal year. Accounting for a major portion of this total were
the construction of a sanitary ware manufacturing factory in
Mexico, installation of manufacturing equipment at a plant in
Vietnam, the purchase of molds and manufacturing equipment for
domestic Group companies, and enhancements to showrooms in
Japan.
Depreciation and amortization increased ¥1.1 billion, year on
year, to ¥22.0 billion. For the fiscal year ending March 31, 2008,
the Company anticipates capital investment of ¥25.0 billion and
depreciation and amortization of ¥22.0 billion.
Cash Flows
Net cash provided by operating activities increased ¥1.7 billion
from the previous fiscal year to ¥28.6 billion. In the fiscal year
under review, the main sources of cash included ¥21.8 billion
from income before income taxes and minority interests, and
¥22.0 billion from depreciation and amortization. Items that
reduced cash were ¥5.6 billion in inventories, and ¥5.0 billion in
employees’ retirement benefits paid, net of provision.
Net cash used in investing activities totaled ¥25.3 billion, up
¥18.1 billion from the previous fiscal year. The primary components
were ¥17.7 billion for purchases of property, plant and equipment,
¥7.9 billion for the acquisition of investments in subsidiaries, and ¥4.6
billion from proceeds from sales of property, plant and equipment.
Net cash used in financing activities decreased ¥5.7 billion from
the previous fiscal year to ¥10.8 billion. Although TOTO procured
capital through proceeds from issuance of commercial paper, this
was offset by the redemption of commercial paper, cash dividends
paid, and repayment of bank loans.
As a result, cash and cash equivalents at end of year declined
¥7.3 billion, from ¥47.8 billion at the end of the previous fiscal
year to ¥40.6 billion.
Business Risk
1. Risk of Change in Operating Environment
The TOTO Group’s main business activities are the production
and sale of facilities and equipment for buildings. As a result,
sudden changes in the operating environment from a decline in
the number of housing starts and construction of large-scale
buildings, intensified market competition, as well as consumer
spending trends that affect demand for new housing and
remodeling, may have an adverse impact on the financial position
and business performance of the TOTO Group.
2. Risk Related to Product and Service Quality Guarantees
The TOTO Group recognizes the importance of ensuring the quality
of its products and services, and bases its quality assurance
efforts on internal standards and national standards such as
Japanese Industrial Standards (JIS) for engineering, development,
production, sales and services. However, in the event that a problem
should occur with the quality of its products and services, such as
an accident or poor service, the TOTO Group’s financial position
and business performance may be adversely affected.
3. Risk of Personal Information Leak
The TOTO Group discloses on its Web site its policies for acquiring
and using personal information, and clearly identifies the purpose
of using personal information prior to receiving permission from
the individual concerned to use their personal information. The
TOTO Group has taken steps to strengthen security measures
such as through user access rights management with IDs and
passwords on information management systems, and by preventing
the output of large volumes of data. For our employees, we have
formulated guidelines for the protection of personal information,
and broadened awareness of related issues through e-Learning,
our system for individual study on PCs. Despite these measures,
in the event that personal information possessed by the TOTO
Group is externally leaked as a result of criminal intent or negligence
on behalf of a party associated with the TOTO Group, or obtained
through unauthorized access by a third party, the brand image of
the TOTO Group may deteriorate and adversely affect the TOTO
Group’s financial position and business performance.
4. Risk of Natural Disasters
To indemnify against damage from fire and typhoons, the TOTO
Group takes out property insurance to cover products, buildings
and other assets that are management resources. We are making
concerted efforts to improve problem areas at all of our
manu-facturing facilities, and use external institutions to periodically
analyze the risk of natural disasters. As a precaution against
earthquakes, we have created a manual of earthquake
counter-measures for each manufacturing facility, and make every effort to
ensure the safety of employees, protect assets such as products
and buildings, resume operations and prevent damage to
surrounding areas in the event of an earthquake. However, in the
event of a major natural disaster of unforeseen scale, the TOTO
Group’s financial position and business performance may be
adversely affected.
5. Risk of War, Civil Unrest and Terrorism
The TOTO Group engages in business in many countries around
the world, primarily in the United States and Asian countries.
Accordingly, as a precaution against public instability in these
countries, we have created the TOTO Global Crisis Management
Manual, and are appointing headquarters risk managers and local
base risk managers in charge of crisis management, in an effort
to ensure the safety of employees and protect products, buildings
and other assets. However, in the event of a major war, civil
unrest or terrorism in these regions, the TOTO Group’s financial
position and business performance may be adversely affected.
Capital Investment
Billions of yen
2007
2003 2004 2005 2006
Cash Flow
Billions of yen
2007
Financial Section
Consolidated Balance Sheets
TOTO LTD. and Consolidated Subsidiaries
March 31, 2006 and 2007
ASSETS 2006 2007 2007
Thousands of Millions of yen Millions of yen
U.S. dollars (Note 3)
Current assets:
Cash and cash equivalents ¥ 47,829 ¥ 40,579 $ 343,744
Short-term investments (Note 14) 75 527 4,464
Notes and accounts receivable:
Trade 89,528 91,543 775,460
Allowance for doubtful receivables (1,019) (799) (6,768)
88,509 90,744 768,692
Inventories (Note 4) 61,251 67,205 569,293
Deferred tax assets (Note 8) 4,500 5,778 48,945
Other current assets 11,966 12,947 109,674
Total current assets 214,130 217,780 1,844,812
Property, plant and equipment(Note 6):
Land 47,995 47,182 399,678
Buildings and structures 166,461 166,568 1,410,995
Machinery and equipment 142,275 145,093 1,229,081
Construction in progress 5,982 3,479 29,471
Other 58,384 61,535 521,262
421,097 423,857 3,590,487
Accumulated depreciation (254,340) (262,812) (2,226,277)
Property, plant and equipment, net 166,757 161,045 1,364,210
Investments and other assets:
Investment securities (Notes 6 and 14) 50,571 46,206 391,410
Investments in and loans to unconsolidated subsidiaries and affiliates 5,712 6,299 53,359
Long-term loans receivable 571 487 4,125
Guaranty money deposited 5,951 5,979 50,648
Deferred tax assets (Note 8) 12,690 11,915 100,932
Goodwill 192 26 220
Other 18,250 16,999 143,999
Total investments and other assets 93,937 87,911 744,693
Total assets ¥ 474,824 ¥ 466,736 $ 3,953,715
See notes to consolidated financial statements.
LIABILITIES AND NET ASSETS 2006 2007 2007
Thousands of Millions of yen Millions of yen
U.S. dollars (Note 3)
Current liabilities:
Notes and accounts payable:
Trade ¥ 59,588 ¥ 61,919 $ 524,515
Property and equipment 5,547 3,516 29,784
65,135 65,435 554,299
Short-term bank loans (Note 5) 32,711 28,606 242,321
Current portion of long-term debt (Notes 5 and 6) 871 30,372 257,281
Commercial paper (Note 5) 10,000 10,000 84,710
Other accounts payable 7,250 6,855 58,069
Accrued income taxes (Note 8) 4,416 3,960 33,545
Accrued expenses 19,011 19,948 168,979
Accrued directors’ bonuses — 86 729
Accrual for loss on inspection and repair of products — 3,079 26,082
Other current liabilities (Note 8) 14,855 13,610 115,290
Total current liabilities 154,249 181,951 1,541,305
Long-term liabilities:
Long-term debt (Notes 5 and 6) 32,159 1,693 14,341
Accrued retirement benefits for employees (Note 9) 53,432 48,383 409,852
Accrued retirement benefits for directors 595 490 4,151
Other (Note 8) 837 977 8,276
Total long-term liabilities 87,023 51,543 436,620
Contingent liabilities(Note 13)
Net assets:
Shareholders’ equity(Notes 7 and 16): Common stock without par value
Authorized—700,000,000 shares in 2006 and 1,400,000,000 shares in 2007 Issued—371,662,595 shares in 2006, and
371,662,595 shares in 2007 35,579 35,579 301,389
Capital surplus 29,370 29,380 248,878
Retained earnings 157,222 166,309 1,408,801
Less treasury stock, at cost; 24,935,482 shares in 2006
and 25,114,108 shares in 2007 (13,996) (14,217) (120,432)
Total shareholders’ equity 208,175 217,051 1,838,636
Valuation and translation adjustments:
Net unrealized holding gains on securities 15,347 12,417 105,185
Translation adjustments (2,056) (859) (7,277)
Total valuation and translation adjustments 13,291 11,558 97,908
Minority interests 12,086 4,633 39,246
Total net assets 233,552 233,242 1,975,790
Financial Section
Consolidated Statements of Income
TOTO LTD. and Consolidated Subsidiaries
Years ended March 31, 2006 and 2007
Consolidated Statements of Changes in Net Assets
TOTO LTD. and Consolidated Subsidiaries
Years ended March 31, 2006 and 2007
2006 2007 2007
Thousands of Millions of yen Millions of yen
U.S. dollars (Note 3)
Net sales ¥494,785 ¥512,200 $4,338,840
Cost of sales 321,214 337,735 2,860,949
Gross profit 173,571 174,465 1,477,891
Selling, general and administrative expenses(Note 10) 148,407 148,277 1,256,053
Operating income 25,164 26,188 221,838
Other income (expenses):
Interest and dividend income 826 1,090 9,233
Interest expense (1,395) (1,675) (14,189)
(Loss) gain on sales and disposal of property, plant and equipment, net (1,072) 2,073 17,560
Gain on sales of investment securities, net 573 13 110
Loss on sales of investment in affiliates (47) — —
Loss on devaluation of securities (21) (99) (839)
Loss on disposal of inventories (1,416) (596) (5,048)
Foreign exchange gain, net 463 49 415
Sales discounts (1,013) (1,100) (9,318)
Loss on impairment of fixed assets — (1,709) (14,477)
Loss on devaluation of investments in unconsolidated subsidiaries — (590) (4,998)
Loss on devaluation of memberships (18) (7) (59)
Equity in earning of unconsolidated subsidiaries and affiliates 1,067 1,155 9,784
Costs related to disposal and demolition of plant facilities (627) — —
Costs related to environmental measures (1,149) (284) (2,406)
Loss on overseas operations — (750) (6,353)
Loss on inspection and repair of products — (3,096) (26,226)
Other, net 637 1,167 9,886
Income before income taxes and minority interests 21,972 21,829 184,913
Income taxes(Note 8):
Current 6,821 5,571 47,192
Deferred 671 1,557 13,189
7,492 7,128 60,381
Minority interests (1,483) (1,157) (9,801)
Net income (Note 11) ¥ 12,997 ¥ 13,544 $ 114,731
See notes to consolidated financial statements.
Treasury Net unrealized Number of Common Capital Retained
stock, holding gains Translation Minority Total shares in issue stock surplus earnings
at cost on securities adjustments interests net assets
Millions of yen
Balance at March 31, 2005 371,662,595 ¥35,579 ¥29,364 ¥148,516 ¥ (13,868) ¥ 4,505 ¥(4,724) ¥10,894 ¥210,266
Net income — — — 12,997 — — — — 12,997
Cash dividends paid — — — (4,164) — — — — (4,164)
Bonuses to directors and
statutory auditors — — — (127) — — — — (127)
Purchases of treasury stock — — — — (137) — — — (137)
Disposition of treasury stock — — 6 — 9 — — — 15
Net changes in items other
than shareholders’ equity — — — — — 10,842 2,668 1,192 14,702
Balance at March 31, 2006 371,662,595 35,579 29,370 157,222 (13,996) 15,347 (2,056) 12,086 233,552
Net income — — — 13,544 — — — — 13,544
Cash dividends paid — — — (4,335) — — — — (4,335)
Bonuses to directors and
statutory auditors — — — (122) — — — — (122)
Purchases of treasury stock — — — — (230) — — — (230)
Disposition of treasury stock — — 10 — 9 — — — 19
Net changes in items other
than shareholders’ equity — — — — — (2,930) 1,197 (7,453) (9,186)
Balance at March 31, 2007 371,662,595 ¥35,579 ¥29,380 ¥166,309 ¥ (14,217) ¥12,417 ¥ (859) ¥ 4,633 ¥233,242
Treasury Net unrealized Common Capital Retained
stock, holding gains Translation Minority Total stock surplus earnings
at cost on securities adjustments interests net assets
Thousands of U.S. dollars (Note 3)
Balance at March 31, 2006 $ 301,389 $ 248,793 $1,331,825 $ (118,560) $ 130,005 $ (17,416) $ 102,380 $1,978,416
Net income — — 114,731 — — — — 114,731
Cash dividends paid — — (36,722) — — — — (36,722)
Bonuses to directors and
statutory auditors — — (1,033) — — — — (1,033)
Purchases of treasury stock — — — (1,948) — — — (1,948)
Disposition of treasury stock — 85 — 76 — — — 161
Net changes in items other
than shareholders’ equity — — — — (24,820) 10,139 (63,134) (77,815)
Balance at March 31, 2007 $ 301,389 $ 248,878 $1,408,801 $ (120,432) $ 105,185 $ (7,277) $ 39,246 $1,975,790
Financial Section
Consolidated Statements of Cash Flows
TOTO LTD. and Consolidated Subsidiaries
Years ended March 31, 2006 and 2007
Notes to Consolidated Financial Statements
TOTO LTD. and Consolidated Subsidiaries
March 31, 2007
2006 2007 2007
Thousands of Millions of yen Millions of yen
U.S. dollars (Note 3)
Operating activities:
Income before income taxes and minority interests ¥ 21,972 ¥ 21,829 $ 184,913
Depreciation and amortization 20,971 22,040 186,701
Loss on impairment of fixed assets — 1,709 14,477
Interest and dividend income (826) (1,090) (9,233)
Interest expense 1,395 1,675 14,189
Provision for directors’ bonuses — 86 729
Provision for loss on inspection and repair of products — 3,079 26,082
Employees’ retirement benefits paid, net of provision (4,262) (5,049) (42,770)
Directors’ retirement benefits paid, net of provision 57 (105) (889)
Loss (gain) on sales and disposal of property, plant and equipment, net 1,072 (2,073) (17,560)
Gain on sales of investment securities, net (573) (13) (110)
Loss on sales of investment in affiliates 47 — —
Loss on devaluation of securities 21 99 839
Loss on devaluation of investments in unconsolidated subsidiaries — 590 4,998
Loss on devaluation of memberships 18 7 59
Notes and accounts receivable (2,254) (1,177) (9,971)
Inventories (1,332) (5,615) (47,565)
Notes and accounts payable 2,609 1,989 16,848
Bonuses to directors and statutory auditors (127) (122) (1,033)
Other (4,614) (2,977) (25,219)
Subtotal 34,174 34,882 295,485
Interest and dividend income received 1,135 1,434 12,147
Interest expense paid (1,389) (1,666) (14,113)
Income taxes paid (7,048) (6,075) (51,461)
Net cash provided by operating activities 26,872 28,575 242,058
Investing activities:
Purchases of property, plant and equipment (17,855) (17,745) (150,318)
Proceeds from sales of property, plant and equipment 978 4,569 38,704
Increase in marketable and investment securities (1,293) (1,026) (8,691)
Decrease in time deposits 14,757 43 364
Acquisition of subsidiaries’ stock resulting in changes
in the scope of consolidation 153 — —
Acquisition of investments in subsidiaries (13) (7,910) (67,006)
Other (3,987) (3,241) (27,454)
Net cash used in investing activities (7,260) (25,310) (214,401)
Financing activities:
Decrease in bank loans (11,334) (5,459) (46,243)
Proceeds from issuance of commercial paper 30,000 50,000 423,549
Redemption of commercial paper (30,000) (50,000) (423,549)
Cash dividends paid (4,161) (4,335) (36,722)
Purchases of treasury stock (137) (230) (1,948)
Other (869) (811) (6,870)
Net cash used in financing activities (16,501) (10,835) (91,783)
Effect of exchange rate changes on cash and cash equivalents 1,181 320 2,711
Net increase (decrease) in cash and cash equivalents 4,292 (7,250) (61,415)
Cash and cash equivalents at beginning of year 43,537 47,829 405,159
Cash and cash equivalents at end of year ¥ 47,829 ¥ 40,579 $ 343,744
See notes to consolidated financial statements.
1. Basis of Preparation
TOTO LTD. (the “Company“) and its domestic subsidiaries maintain
their books of account in conformity with the financial accounting
standards of Japan, and its foreign subsidiaries maintain their books
of account in conformity with those of their countries of domicile.
The accompanying consolidated financial statements have
been compiled from the consolidated financial statements prepared
by the Company as required under the Securities and Exchange
Law of Japan and, therefore, have been prepared in accordance
with accounting principles generally accepted in Japan, which are
different in certain respects as to the application and disclosure
requirements of International Financial Reporting Standards.
Certain amounts in the prior year’s financial statements have
been reclassified to conform to the current year’s presentation.
2. Summary of Significant Accounting Policies
(a) Principles of consolidation and accounting for investments
in unconsolidated subsidiaries and affiliates
The accompanying consolidated financial statements include the
accounts of the Company and significant companies controlled
directly or indirectly by the Company. Significant companies over
which the Company exercises significant influence in terms of
their operating and financial policies have been included in the
consolidated financial statements on an equity basis. All significant
intercompany balances and transactions have been eliminated
in consolidation.
Investments in unconsolidated subsidiaries and affiliates not
accounted for by the equity method are carried at cost.
Certain foreign subsidiaries are consolidated on the basis of
fiscal periods ending December 31, which differ from that of the
Company; however, the significant effect of the difference in fiscal
periods has been properly adjusted in consolidation.
Goodwill, which represents the difference between the cost and
the underlying equity in the net assets at fair value at the date of
acquisition, is being amortized principally over a period of five years.
(b) Cash equivalents
All highly liquid investments with a maturity of three months or
less when purchased are considered to be cash equivalents.
(c) Securities
In general, securities other than those of subsidiaries and affiliates
are classified into three categories: trading, held-to-maturity or other
securities. Securities held by the Company and its consolidated
subsidiaries are all classified as other securities. Marketable
securities classified as other securities are carried at fair value
with changes in unrealized holding gain or loss, net of the applicable
income taxes, included directly in net assets. Non-marketable
securities classified as other securities are carried at cost. Cost of
securities sold is determined by the moving average method.
(d) Inventories
Finished products, semifinished products and work in process are
stated at cost, determined by the first-in, first-out method.
Raw materials are principally stated at the lower of cost (by the
gross average cost method) or market.
Contracts in progress and supplies are stated at cost determined
by the specific identification method and the gross average cost
method, respectively.
(e) Allowance for doubtful receivables
The allowance for doubtful receivables is provided for possible
bad debt at the amount estimated based on the past bad debt
experience for normal receivables plus uncollectible amounts
determined by reference to the collectibility of individual accounts
for doubtful receivables.
(f) Accrued directors’ bonuses
Accrued directors’ bonuses are provided at an estimated amount
of bonuses to be paid to directors and corporate auditors for the
current year’s services subsequent to the balance sheet date.
Effective the year ended March 31, 2007, the Company has
adopted a new accounting standard for directors’ bonuses. This
standard requires that directors’ bonuses be accounted for as an
expense on an accrual basis. The effect of the adoption of this
standard was to decrease operating income, and income before
income taxes and minority interests by ¥86 million ($729 thousand)
from the corresponding amounts which would have been recorded
under the previous method. The effect of this change on segment
information was immaterial.
(g) Accrual for loss on inspection and repair of products
Accrual for loss on inspection and repair of products is provided
at an amount based on the cost estimated to be incurred for
activities related to the inspection and repair of products subsequent
to the balance sheet date.
(h) Depreciation and amortization
Depreciation of property, plant and equipment of the Company
and its domestic consolidated subsidiaries is mainly calculated by
the declining-balance method at rates based on the estimated
useful lives of the respective assets. Depreciation of foreign