Introducing Sonification as
a Tool for Astrophysical Data Analysis
Wanda Diaz-Merced (Office of Astronomy for Development, South Africa / National
Society of Black Physicists, U.S.A. / Laboratory of Visual Learning, U.S.A),Matthew Schneps (Katholieke Universiteit Leuven / University of Antwerp, Belgium),
Katrien Kolenberg (Office of Astronomy for Development, South Africa / National
Society of Black Physicists, U.S.A. / Katholieke Universiteit Leuven, Belgium),Monika Rychtarikova (Katholieke Universiteit Leuven, Belgium),
Bert Roozen (Katholieke Universiteit Leuven, Belgium)
概 要 米 国 マ サ チ ュ ー セ ッ ツ 州 の Center for Astrophysics(CfA) に て 、 天 文 学 者 ・ 天 体
物 理 学 者 が デ ー タ 解 析 の 方 法 に つ い て 評 価 を
行 い ま し た 。 フ ォ ー カ ス グ ル ー プ 研 究 や 、 ユ
ー ザ ビ リ テ ィ 研 究 と い う 手 法 に 基 づ く 結 果 を
報 告 い た し ま す 。 視 覚 に 加 え て 音 を 聞 く と い
う 複 数 の 知 覚 を 使 う と 、 よ り 良 く デ ー タ 解 析
が で き る ( ス ペ ク ト ル 中 に 存 在 す る シ グ ナ ル
を 見 つ け や す く な る ) こ と が わ か り ま し た 。
1. Introduction: Background and Context Many years ago I was sighted and due to long illness I transitioned to visual deprivation. I was an undergraduate student. I was at a stage, where you know you want to do astronomy but you have not decided what you want to study. At that stage in my life I only knew what I learned in the classroom from whatever I could get with my residual vision from the book. I was losing my sight rapidly, experiencing seizures on daily basis. And when I recorded the class, on play back, it would sound like: “if you place this term here and then you substitute down here you will find the result”. To me the only thing that was clear was the sound of the chalk on the
blackboard. I had never had a practical experience; so of the possibilities in astronomy of the numberless amount of satellites, I knew nothing because I had never had other experience than trying to figure out what the professor was trying to convey in the classroom to memorize, and to take a test.
astronomer has if I want to perform at their level.
I began pondering to use sound to hear my data. Others have done the same pondering but have never materialized it. But I would use sound without knowing if it really helps to explore this data that has been displayed on charts for hundreds of years. My mentor and I chose to investigate the hypothesis that sound as an adjunct to data visualisation will increase parti-cipants’ sensitivity to identify the presence of a simulated double-peaked “black hole” pattern in simulated data, when those signals are changing in intensity and visual field angle. We used a task simulating the process which astronomers adopt to search for the characteristic indicators of black holes. The task derives from the idea that a black hole exists in the centre of each galaxy. The molecular gas around the black hole emits symmetric double peak spectra, which are characteristic with the presence of a black hole. This signal was simulated for the experiments to proof my hypothesis. The
experiments determined the signal-to-noise ratio (S/N) thresholds at
which participants could correctly identify the presence of a simulated double-peaked “black hole” pattern which was obscured by Gaussian noise. So the better you would get at identifying signal in the presence of noise, the more we will hide the signal. This paradigm evaluated participants’ performance when they were experiencing audio and visual presentations of that type of simulated double peak data
In the case of this black hole task, the
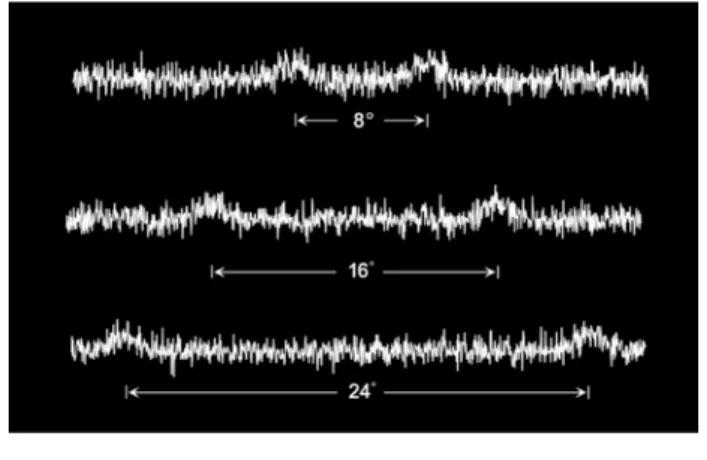
high-spatial frequency noise (overlying the low-spatial frequency “signal”) may act as a cognitive load that triggers mechanisms of attention that inhibit peripheral sensitivity. Though it may be difficult to precisely demarcate a centre to periphery boundary, for the purposes of this discussion, and in accordance with the literature review, with regards to the experiments presented in this research we took centre to periphery boundary to be at ~8° of visual angle, where changes in attention response become pronounced (Figure 1). The references will be available upon request.
Fig. 1 Simulated double-peaked “black hole” pattern signal with the noise. Visual angles of 8°, 16° and 24° were presented to participants.
2. Implementation
Figure 1 shows the different spans used for signal identification.
a very hairy punk with a lots of muse that sometimes raises twice or remains flat. The position of those two lumps in ‘noise-only’ stimuli, that is, the vertical position of the graph at each horizontal pixel position was determined by Gaussian noise. In ‘signal’ stimuli, a signal consisting of two positive, upward peaks was added to the noise. These peaks were modeled by identical Gaussian functions with variable, but equal, peak elevation. The quotient of peak elevation and standard deviation of the Gaussian noise in a given stimulus were operationally defined as its signal-to-noise ratio (S/N). The two peaks always occurred to the left and to the right of the centre at identical eccentricity. The span separating the peaks was 8° for Experiment 1 and 2 and 8°, 16°, or 24°, for Experiment 3. This black hole task signal gets more ambiguous as the task progresses and dynamically changes its intensity. This means that not only the noise level increases but the signal strength changes dynamically.
Participants were instructed to press the ‘S’ button on a computer keyboard if they believed that the current stimulus con-tained a signal and to press ‘N’ if they thought that there was no signal. There was no time limit imposed on participant responses. Immediately after pressing the button, participants were acoustically informed whether their response was correct. We performed 3 experiments. In each experiment participants were screened for normal or corrected-to-normal vision and hearing, accurate colour vision, normal cognitive function, and for any history of neurological disorders. All the
participants were PhD-educated space scientists with post-PhD publications.
3. Analysis of the Results
In all the experiments participants did better when they used two modalities (audio and visual). It means that with two stimuli synchronized they could identify signal better.
Once we had evidence that sound as an adjunct to visual display would increase the sensitivity of a traditional astronomer to signal living in the data especially when the amount of noise and position of the signal varies, I said then it is worth to try to create a prototype of computer application that may help us use these modalities to analyze and explore the data.
In order to create effective sonifications which will be usable, intuitive and useful to space physicists, user studies need to be undertaken to fully understand their needs and requirements and to create a prototype which will not engage the space physicist in data formatting as this will frustrate them. So I carried a focus group and usability evaluation that lead to the development of the xSonify prototype previously described.
As a result of the literature review, the focus group topic set for discussion with the volunteers centred on:
1. Data types used by space scientists. 2. The step-by-step process which space
scientists follow for data analysis, e.g. filtering techniques, and data selection.
During the analysis attention was paid to those issues that were especially problematic for users when they were performing data analysis and interacting with the prototype.
I realized that the datasets contained two main indicators pointing to these problematic situations. For example, the participant reported problems: “I got confused over the formatting of the data”. Also there were utterances of users, who refers to an experience using a prototype from a mission, denoting problems: “When analysing data from mission x, I had to build the prototype then had to find and import some binaries, losing days for getting that done”.
From that we were able to identify some categories of challenges:
Unmet expectation: This refers to data reduction and perceptualization which the user has not been able to perform.
Data formatting strategies: This refers to data formatting that prepares the data as acquired by the spacecrafts, and formatting to make or not, sought signal to be salient in the data.
Information architecture: This cate-gory refers to those elements of the interfaces, which cause users problems.
Perception techniques: This refers to techniques used or proposed by the participant to get more from their data employing their senses.
In the discussion, the focus group participants suggested to each other how to listen to different data sets and ascertained how to find different
parameters being sought at the time. The analysis of the data collected from the focus group confirms that space physicists are frustrated when performing data analysis due to:
1. The forced engagement in data formatting to fit software architectures.
2. The desire to analyse the data to seek for events which may be masked by noise, by the current data analysis techniques available, or by that are away from their direction of gaze. 100% of the participants agreed that there were five main stages of data analysis:
Stage 1: The first stage is visualisation of the data. This visualisation is done to spot apparent signatures that may be of interest.
Stage 2: The second stage is filtering of the data to remove noise.
Stage 3: The third stage is to correct for instrumental effects.
Stage 4: The fourth step is to use mathematical morphology which is a set of filtering and segmenting tools used to visualise digital images.
Stage 5: The fifth stage is to visualise the data again.
So according to them it starts and ends with perception of the data
without investing time in formatting the data.
We were very surprised!!! They were experiencing limitations, not to the extent I do experience limitations. But I thought perhaps I may use this for awareness. They also need user centred design!!!!
Then with all that we built the application, taking back end and front end, different learning styles and the needs of traditional astronomers, into consideration. We ran a usability evaluation where we tested:
1. Understandability: Recognising the tools operability and applicability. 2. Learnability: Attributes that bear on
the users’ effort for learning the application. These can be including but not limited to whether the user is able to use the prototype functionalities unassisted, and if the user is able to perform the exploration of the data without investing further time in data formatting, or writing code. During the participant interaction with the data remote data logging monitored and recorded console output and runtime exceptions to file.
3. Operability: Is the volunteer able to use the sonification and visualisation options in the tool to adjust the data to match their perception?
We also monitored the user interaction remotely, and debriefed participants. Participants also expressed the need to
explore the data in a time effective manner and “the desire to spot signatures that are ambiguous and/or embedded in noise especially in large data sets”. Other comments included “the need to explore the unexpected signal in the data before applying any filtering or mathematics”.
4. Conclusion
By doing user centred studies we then got some evidence that sensorial modalities will help astrophysicist in the data analysis, and more importantly will bring onboard other sensorial modalities and peoples with other coping strategies. That universal access will benefit everyone. Sensorial modalities have so much potential and by applying user centred design we will be able to level the field at all skill levels for professionals, students, people that feel curiosity but have other careers, etc.. I never knew why multimodality or user centered design hasn’t been a real option for scientists before. It does not matter anymore because this meeting has evidenced that user centred design at all levels is an option so the field will not only accommodate but will enhance and support the skills which the person has to perform.
Wanda Diaz-Merced