TA session# 6
Jun Sakamoto
May 31,2016
Contents
1
Testing: concept 1
2
Testing: practice 2
1 Testing: concept
We’ve already studied that √β−βˆ
V [ ˆβ] ∼ t(n − k) and (R ˆβ−r)(y−X ˆ′(R(Xβ)′′X)(y−X ˆ−1Rβ)/(n−k)′)−1(R ˆβ−r)/G ∼ F (G, n − k), these values follow t-distribution and F-distribution, respectively. Sometimes, econometrics want to know whether β is equal to 0 or no. The hypothesis, such as β = 0, is so called the null hypothesis, against the alternative hypothesis. Null hypothesis is denoted as,
H0: β = 0
If we want to check β is nonzero, then alternative hypothesis is denoted as,
H1: β 6= 0.
If we want to check β is larger than 0, then alternative hypothesis is denoted as,
H1: β > 0.
If we want to check β is smaller than 0, then alternative hypothesis is denoted as,
H1: β < 0
A two-tailed test is used for first type of test and a one-tailed test is used for other type of test. How to test the null hypothesis? It’s checked respectively about 3 upper null hypotheses.
Suppose that the test statistic follow t(100) and a alternative hypothesis of β 6= 0 is applied. Then the test statistic is between -1.984 and 1.984 with 95% probability when a null hypothesis is true, so the result, 3, happens so small probability. Thus, we conclude that null hypothesis is not true. Also alternative hypothesis
of β > 0 was applied, then the null hypothesis is rejected.
But sometimes we face complicated case. If test statistic follow t(100) and result is 1.9, then we use 5% sig- nificant level, the null is rejected when alternative hypothesis is H1: β > 0. But the null is not rejected when alternative hypothesis is H1: β 6= 0. This result is caused by a different critical value.
A two-tailed test is used in many cases. We only use a one-tailed test when we know bias of a sample.
2 Testing: practice
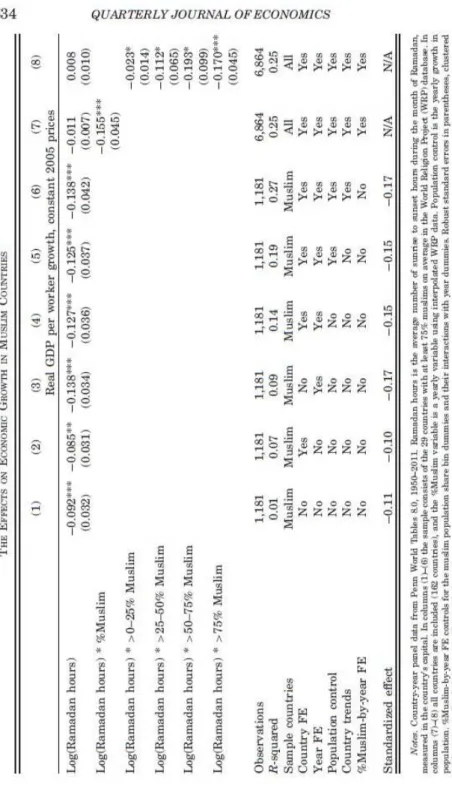
1.Campante. F and Yanagizawa.D(2015) ”Does Religion Affect Economic Growth and Happiness? Evidence from Ramadan”. The Quarterly Journal of Economics. 130(2) pp.615-658.
This study analyzes the economic effects of Ramadan fasting on economic growth and happiness. The length of daily Ramadan fasting depends on latitude and season. For example, when Ramadan falls in the Northern Hemisphere winter, the prescribed length of daily fasting according to the Qur’an will be longer in Bangladesh than Turkey, because Bangladesh is closer to the Equator. However, when Ramadan falls in the summer, fast- ing will be longer in Turkey than in Bangladesh. Since the variation of the length of daily Ramadan fasting is exogenous, the causal effect of Ramadan fasting can be identified.
The following equation is analyzed for identifying the effect of Ramadan fasting on economic growth.
gct= β ∗ RamadanHoursct+ δc+ µt+ εct
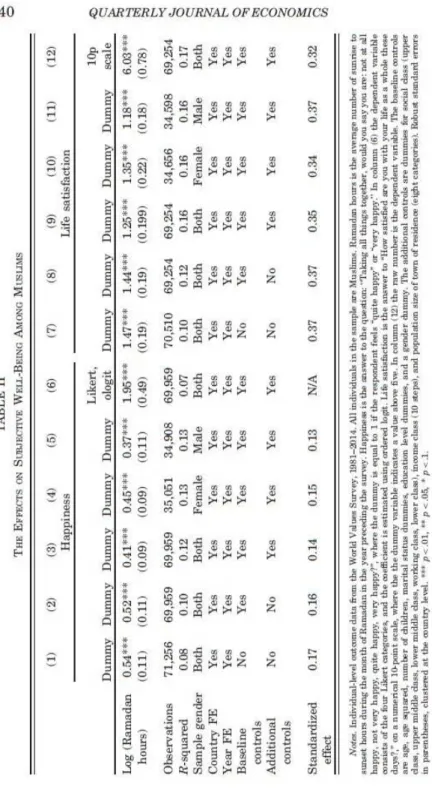
In addition, the following equation is analyzed for identifying the effect of Ramadan fasting on subjective well being.
yict= β ∗ RamadanHoursict+ δict+ µict+ Xictγ′+ εict
Where subscript i denote individual i living in country c surveyed in year t, and Xictis a vector of demographic controls, such as gender dummy, second-order polynominal in age, martial status dummies, number of children, and education. Also, time dummies µt, and country dummies δc are included. They defined RamadanHours as log number of fasting hours during the most recent Ramadan preceding the survey year.
The result is Table 1 and Table 2.
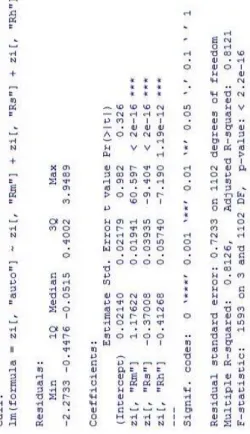
2. CAPM and Fama-French 3factor
Stock return is only explained by Market portfolio return in CAPM theory. On the other hand, Fama and French(1993) shows SMB factor and HML factor has explanation ability as well as Market portfolio return(FF 3factor model). Using F-test, we can test whether additional 2 factor are valid or not.
The following equation are analyzed CAPM and FF 3factor model.
Rit− rf= α + βM P(RM P t− rf) + εt
Rit− rf = α + βM P(RM P t− rf) + βSM BRSM B+ βHM LRHM L+ εt
Since, CAPM can be regarded as a model with a restrictions of FF 3factor model. A null hypothesis is
βSM B = βHM L= 0 We analyze above equation by Japanease auto stock portfolio. Data:2009/7∼ 2013/12
The result is Table 3 and Table 4.
SSR of CAPM is 638.606 and SSR of FF 3factor is 576.571. Thus, F-statistic as follows
F = (638.606−576.571)/2
576.571/1102 = 59.28
F0.01(2, 1102) ≃ 4.61 < 59.28 Then, we reject null hypothesis under the level of significance 0.01.
Figure 1: Table 1
Figure 2: Table 2
Figure 3: Table 3
Figure 4: Table 4