Socioeconomic Evaluation of Transit Oriented Development using a
Detailed Spatial Scale CUE Model in Taiwan
Hiromichi YAMAMOTO a, Jumpei SANO b, Kiyoshi YAMASAKI c, Kazuki YANAGISAWA d, Atsushi KOIKE e, Morito TSUTSUMI f
a, bMitsubishi Heavy Industries, ltd., Kobe, 652-8585, Japan
a E-mail: [email protected]
bE-mail: [email protected]
c, dValue Management Institute, ltd., Tokyo, 100-0004, Japan
c E-mail: [email protected]
d E-mail: [email protected]
eKobe University, Kobe, 657-8501, Japan; E-mail:[email protected]
fUniversity of Tsukuba, Tsukuba, 305-8573, Japan;
E-mail: [email protected]
Abstract: In Asian and ASEAN countries, there are many urban development plans based on
the concept of Transit Oriented Development (TOD). The Computable Urban Economic (CUE) model, which enables simultaneous evaluation of urban and transportation development, is one of the major approaches for estimating the effects of a development plan based on TOD. However, these effects have been difficult to evaluate, especially in Asian and ASEAN countries apart from Japan, owing to the lack of public data on geographic land use by small zone units. We have estimated a detailed spatial scale land use dataset by using satellite images. This enables land use classification on an appropriate scale for the evaluation of TOD. This paper describes the evaluation results of the development plan of Taoyuan City, Taiwan that was carried out by building a detailed spatial scale CUE model based on data and our estimation approach.
Keywords: Computable Urban Economic Model, Transit Oriented Development, Public
Transportation, Taoyuan Aerotropolis, Automated Railway, Asia and ASEAN
1. INTRODUCTION
Owing to the recent remarkable economic growth in Asian and ASEAN countries, metropolises in each country have many urban development plans for land use and transportation. At the same time, heavy traffic congestion and increases in CO2 emissions from the transportation sector are serious urban problems caused by urban development plans centered on cars and motorcycles. To minimize these critical problems while maintaining their urban development, these countries currently pay attention to the concept of Transit Oriented Development (TOD), which aims to simultaneously achieve economic growth and reduce CO2 emissions.
Urban development based on TOD is used to build a public transportation oriented city or community by centralizing the stations. TOD has been widely adopted by private railway companies in Japan, such as Hankyu Corporation and Tokyu Corporation. To estimate the effects of a development plan based on TOD, it is necessary to simultaneously simulate the
impact of land use development and that of transportation development. The Computable Urban Economic (CUE) model has been widely used in Japan to assess the effects of these development plans. Its characteristics are different from those of the traditional Land Use and Transportation Integration Model. The CUE model is characterized by a microeconomic foundation and by a spatial equilibrium based on urban economics. Each economic agent demands or supplies land, building, transportation service, and other goods at a location of their choice (Ueda et al., 2013; Yamasaki et al., 2008, 2013).
However, when we apply the CUE model to urban development plans in Asian and ASEAN countries apart from Japan, one of the main difficulties is to obtain the data on geographic land use at a detailed spatial scale from open resources. Therefore, the land use models in these countries cannot avoid being constructed with large spatial zone units, such as prefecture and city units, which implies that it is not possible to precisely analyze travel behavior at a smaller scale (Tsutsumi et al., 2012). To address this issue, we have estimated a detail spatial scale land use dataset by using satellite images such as those serviced by Google Earth. This enables estimation of the effects of urban development plans in Asian and ASEAN countries by detailed spatial scale CUE models.
In this study, we build a detailed spatial scale CUE model with our estimation approach, using data of Taoyuan City, Taiwan. We present the results and their evaluation.
This paper is organized as follows. Section 2 reviews the status and overview of the land use and transportation development plan in Taoyuan City. Section 3 describes the dataset for building the detailed spatial scale CUE Model with a new classification approach. Section 4 describes the formulation of the CUE Model, and Section 5 describes the simulation parameters. Section 6 describes the simulation results using the detailed spatial scale CUE Model in Taoyuan. The main conclusions and outlook for further applications are summarized in Section 7.
2.DEVELOPMENT PLAN OF TAOYUAN CITY, TAIWAN
2.1 Taoyuan City
Taoyuan City is located approximately 50 km west of Taipei City and was promoted to a government-ruled municipality on 25 December, 2014. Taoyuan City has been flourishing as a gateway to Taiwan through Taiwan Taoyuan International Airport, the largest international airport in Taiwan. It also has an industrial area and is expected to grow as one of the major cities in Taiwan. The population of Taoyuan City is approximately two million, and this city is currently recognized as a bedroom town of Taipei City.
2.2 Transit Oriented Development: TOD
Taoyuan City has a development plan for public railway transportation based on the Taoyuan Aerotropolis, one of Taiwan’s national projects. The Taoyuan city government announced that they would develop their city using TOD. This implies that it will be necessary for the city to integrate its land use development and transportation development plans. Under the urban development plan using TOD, residents
Urban structure using TOD Urban structure NOT using TOD (Diffusion type urban structure)
Railway Transit Bus Low High
Population density Promote the use of
public transportation
Reduction of urban area Station vicinity
advances
and visitors are assumed to use public transportation in their movement and not necessarily to rely on private transportation such as cars and motorcycles. The metropolitan and suburban areas are connected by railway transportation, and urban activities are accumulated around the railway stations (Taniguchi, 2009).
Since TOD theoretically has the potential to control the acceleration of motorization, it has been paid attention as an approach for reduction of CO2 emissions from the transportation sector. This is one of the valuable approaches for economically developing countries, such as Asian and ASEAN countries, when they plan their urban development. The key challenges of TOD are to simultaneously evaluate the effects of the land use development and transportation development plans and to manage and optimize the dual development plan.
2.3 Taoyuan Aerotropolis
Taoyuan Aerotropolis is a Taiwanese national project under which Taoyuan City has been developing as an international gateway, taking advantage of its geographical location in Asia Pacific, the infrastructure of the seaport and the airport (Taoyuan Airport and Taipei Port), and the Free Trade Port Zone. The main objectives of the project are 1) to develop Taoyuan Airport as a hub airport in East Asia, 2) to promote urban development using TOD, 3) to promote and develop the clustering industries, 4) to realize a sustainable and smart Aerotropolis, and 5) to boost the development of the dual ports.
Taoyuan Aerotropolis is a newly developed area around Taoyuan Airport of 4,177 ha (including the Taoyuan Airport site) and is divided into five zones. The development plans of the zones depend on the characteristics and transportation conditions of each zone and will be completed by 2041. The development of Taoyuan Aerotropolis will activate the industrial sectors and realize globalization. According to an economic analysis by the Taoyuan municipality, this project will have an economic effect of 2,300 billion New Taiwan dollars and result in employment opportunities for 300,000 people.
2.4 Public Railway System
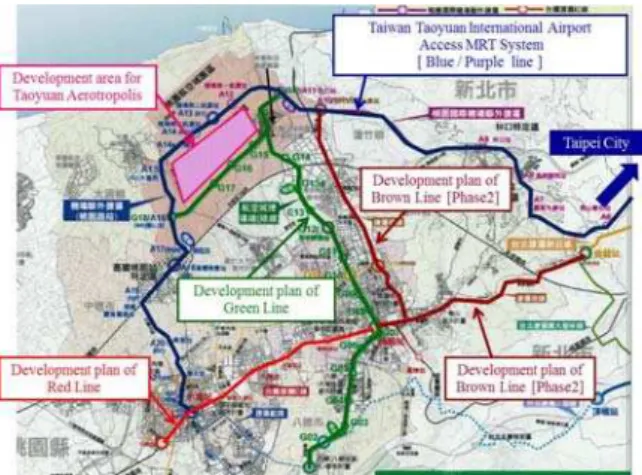
In Taoyuan City, various transportation development projects are being promoted together with Taoyuan Aerotropolis and other urban plans (please refer to Table 1 and Figure 3 for examples). Taiwan’s Taoyuan International Airport Access MRT connects Taipei City to Taoyuan Airport via a one-way, 35 min trip. In addition, the Green Line connects the downtown area of Taoyuan City to Taoyuan Airport. TOD-based urban development is planned for Taoyuan Aerotropolis, whereby activities will be centralized around the main station of Taiwan Taoyuan International Airport Access MRT and the Green Line. This concept will expand to other railway transportation within the city, such as the Brown Line, in the future.
Source: Transportation Bureau of Taoyuan Government 101.11 version
Table 1. Development plan of public railway system in Taoyuan
Railway Length Station
Number
Beginning Year
of Operation Current Status Taiwan Taoyuan International
Airport Access MRT 53.7 km 24 End of 2015 Under Construction
Red Line 17.2 km 7 2017 Under Construction
Green Line 27.8 km 22 2021 Under Planning
Brown Line Phase 1 11.5 km 8 2023 Under Planning
Brown Line Phase 2 12.0 km 8 2023 or later Under Planning
3. DATASET FOR THE COMPUTABLE URBAN ECONOMIC MODEL
3.1 Zoning
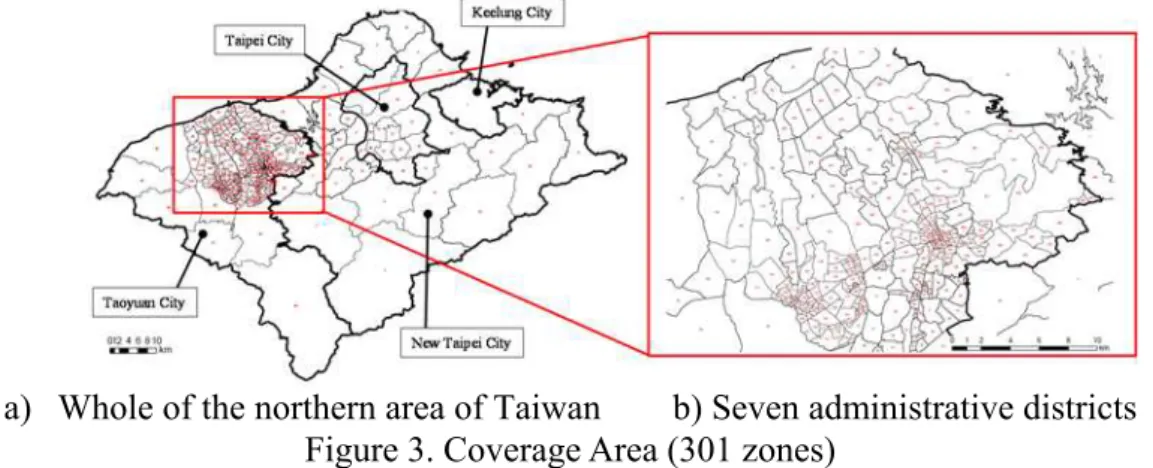
Urban development in Taoyuan City, including transportation and land use development, will have various effects on the surrounding cities. The principal range of travel behavior from Taoyuan City includes commuting trips and private trips to Taipei City and New Taipei City. Therefore, the target area in this simulation study includes the northern area of Taiwan, which consists of Taoyuan City, Taipei City, New Taipei City, and Keelung City. However, we do not consider the interaction between the northern area of Taiwan and other regions, because the travel behavior of Taoyuan City consists of residential trips and employee trips within the coverage area. However, trips from the airport will have a significant impact on travel behavior involving urban transportation. Therefore, we have considered visitor trips from other regions to the airport in this study.
It is necessary to set up a zone in which at the most one station or terminal for railway transportation exists to evaluate the effects of TOD using the CUE model. In this paper, the word “terminal” represents a transportation node, which consists of a few stations of different lines. We have set only one station or one terminal in each zone, because we need to clarify the travel behavior in each railway station in order to evaluate the TOD. If there are multiple stations or terminals within a zone, travel behavior cannot be divided by station or terminal within the zone. We divide the area that includes the Green Line into tiny zones in order to evaluate the effects of TOD around it. The total number of zones is 301. The steps for determining the zones are as follows:
1) The entire northern area of Taiwan is divided into 55 zones at the prefecture or city level.
2) Seven administrative districts where transportation development has been planned are a) Whole of the northern area of Taiwan b) Seven administrative districts
divided into smaller zones. To divide these districts, we applied public information of polygon data from Taoyuan City. This polygon data is prepared in the detailed spatial scale. The seven administrative districts are Taoyuan city Dayuan district, Zhongli district, Taoyuan district, Bade district, Luzhu district, Guishan district, and New Taipei city Xinzhuang district.
3) In case a zone has more than one station for railway transportation, the zone is spatially equally divided into two or more zones, each of which has only a station or a terminal.
3.2 Land Use Data
3.2.1 Dataset method for land use data
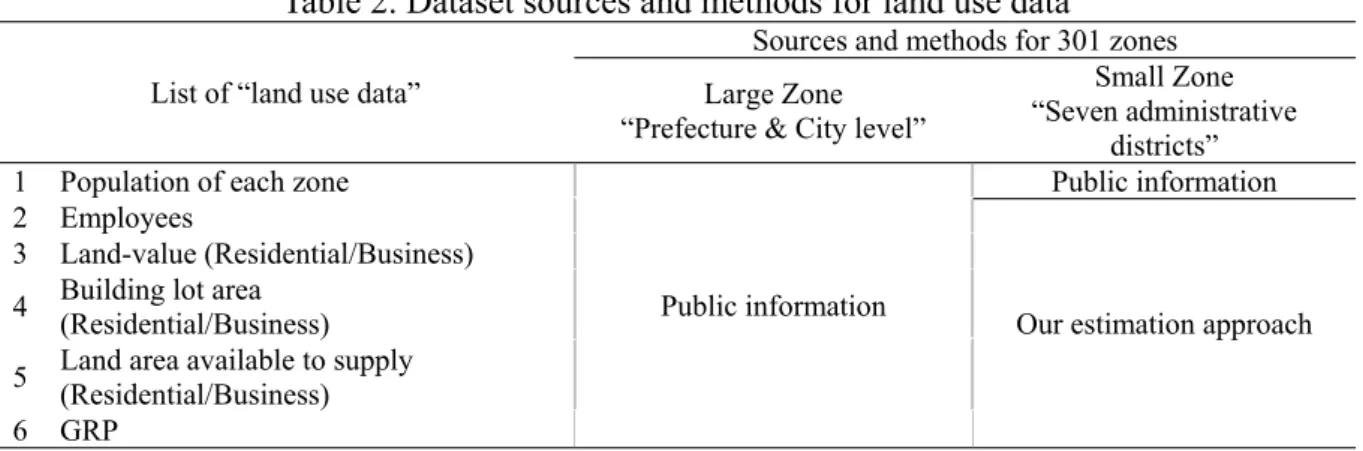
In Japan, land use data at a detailed spatial scale, such as at the district level or smaller, have been prepared and published. In other Asian and ASEAN countries, land use data has not been prepared, even on a large administrative district scale, such as at the prefecture or city unit level. In the northern area of Taiwan, land use data is published by each administrative district. However, the data are at the prefecture or city unit level. In this study, we have estimated a detailed spatial scale land use dataset by using satellite images. This enables land use classification at a detailed spatial scale. Table 2 lists the setting sources and methods for each zone.
Table 2. Dataset sources and methods for land use data
List of “land use data”
Sources and methods for 301 zones Large Zone
“Prefecture & City level”
Small Zone “Seven administrative
districts” 1 Population of each zone
Public information
Public information 2 Employees
Our estimation approach 3 Land-value (Residential/Business)
4 Building lot area (Residential/Business) 5 Land area available to supply
(Residential/Business) 6 GRP
3.2.2 Application of our approach for estimating the land use area by satellite image
The new approach of estimating land use area by satellite image is as follows.
1) The small zones in seven administrative districts are divided into a 250 × 250 m grid cell. Thus, 10,374 grid cells are made. Dividing the area into polygons is another option. In the case of the polygon method, it is necessary to make polygon shapes manually after classifying the area into land use categories using satellite images. However, there is a possibility of making an unstable decision based on the classification, because the polygon shapes of the area are made manually and the criteria of the decision are not clear. Therefore, we do not use the polygon method. The reason we adopt a grid cell size of 250 × 250 m is that the grid cell is smaller than the smallest zone and that it is sufficient to maintain the decision-making accuracy of the land use classification.
land use area into a grid cell that has been identified by color and building shape in a satellite image. Second, we will decide which land use category to apply to the urban area, and the amount of green space depends on the occupation rate. If the occupation ratio of the building area in the grid cell is more than 50%, this grid cell is considered to be in the urban space category. If the occupation ratio of the building area in the grid cell is less than 50%, this area fits into the green space category. Third, we will determine the land use category for the transportation area. If the occupation ratio of the transportation area is more than 50%, the area shall be placed in the urban space category. Finally, we will determine the land use category for non-resident and residential spaces. If the occupation ratio of the large-scale building area in the grid cell is more than 50%, the grid cell is classified as a non-residence. If the occupation ratio of the residential building area in the grid cell is more than 50%, the grid cell is classified as a residence. On the other hand, if the occupation ratio for the entire land use area is not more than 50%, we will select the land use classification with the highest occupancy ratio.
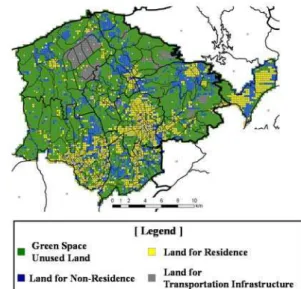
3) Figure 5 shows the results of the land use classification in all of the small zones. Using these results, we can calculate the land use area for the four categories in each small zone. 4) Eventually, we estimated the land use data for each small zone, as shown in Table 2, by
using large-scale land use data from public sources, and the aggregated land use area for each land use category shown in the below flowchart. Table 4 lists the concrete estimate method for land use data for each small zone. In addition, we do not consider the difference between land use areas by type of building in this study. Therefore, this method cannot correctly estimate the amount of floor space. This point is an issue for future study, which will require us to study an additional approach.
Table 3. Categories of land use
Categories of Land Use Item
Green Space, Unused Land Green Space, Unused Land, River, Pond, etc. Urban
Area
Land for Residence Residential House, Apartment Building Land for Non-residence Factory, Office Building, Commercial Building
Land for Transportation Infrastructure Railway, Roadway, Airport, Port, Large-Scale Ground, etc.
Figure 5. Result of land use classification in small zones of seven
administrative districts Figure 4. Decision flowchart
of land use classification
Creation of a 250m mesh by Satellite image [ Google Earth ]
Building area more than 50%
Land for Non-residence
Land for Residence Land for
transportation infrastructure Green Space
Unused land
Urban Space
Transportation infrastructure area more than 50%
Large-scale building area more than 50%
Yes No
Yes No
Table 4. Estimation method for each land use dataset
Land Use Datasets Estimation method for small zones of each land use dataset
Employee The number of employees in a small zone is estimated by the following formula. The building lot area for residences and businesses in each small zone is calculated in 3.2.2-2).
B (1)
i: Small zone number (the large zone “k” is divided into i-number of small zones) : The number of employees in each small zone
: The number of employees in a large zone : Building lot area for a residence in a large zone k
: Building lot area for a business in a large zone k
: Building lot area for a residence in each small zone : Building lot area for a business in each small zone Land value
(Residence/Business)
The estimation of land value is divided into two steps. Firstly, we calculate the following two regression formulas by using data from a large zone.
1) The regression formula for population density and land value for a residence: (2) : residential land value for of large zone k,
: population density of large zone k, : coefficient, : intercept coefficient 2) The regression formula for employee density and land value for a business:
(3) : business land value for of large zone k,
: employee density of large zone k, : coefficient, : intercept coefficient Secondly, we estimate the land value for each small zone by substituting the population density and employee density in each small zone in the above regression formula. Building lot area
(Residence/Business)
The building lot area of a small zone is estimated by the building lot area ratio of large zone “k” and small zone “i”.
1) The building lot area for a residence:
∑ (4)
i: Small zone number (The large zone “k” is divided into i small zones.) : The building lot area for a residence in each small zone i
: The building lot area for a residence in a large zone k
: The aggregate value of an estimated building lot area for a residence determined by satellite image
2) The building lot area for a business:
∑ (5)
: The building lot area for a business in each small zone i
: The building lot area for a business in a large zone k
: The aggregate value of estimated building lot area for a business by satellite image
Land area available to supply
(Residence/Business)
The data of land area available to supply each small zone estimated by the land area available to supply from large zone data and area of zone.
1) The land area available to supply for a residence
(6)
i : Small zone number (the large zone “k” is divided into i small zones.)
: The land area available to supply for a residence of each small zone i
: The land area available to supply for a residence of large zone k
2) The land area available to supply for a business
(7) : The land area available to supply for a business in each small zone i
: The land area available to supply for a business in a large zone k
: The zone area of small zone i, : The zone area of large zone k
GRP GRP of small zone estimate by GRP of large zone and the number of employees of each small zone.
∑ (8)
i : small zone number(the large zone “k” is divided into i small zones) : GRP of small zone i, : GRP of large zone k
: The number of employee of each small zone
3.2.3 Land use datasets
Figures 6 and 7 show examples of the datasets for population density and employee density. The population density data for the small zones are obtained from the Taoyuan government website and are shown in Figure 6 in comparison with the employee density. While open sources provide land use data, such as employee density by large zone units (the original scale), the estimation approach of the land use area using satellite images can show land use data in small zone units (downscaled). Regarding the accuracy of our estimation approach, we could not validate it in this study because actual land use data for each small zone was not available from the Taoyuan government. However, we have reached an understanding with the Taoyuan government whereby we will discuss the feasibility of our estimated results. Through this approach, we believe that our new estimation approach can attain sufficient accuracy. This estimation approach has the possibility of being applied to evaluate urban development using TOD in Asian and ASEAN countries, where land use data is not sufficient. In the next step, we are planning to develop an automatic decision algorithm for land use classification and to apply this estimation approach to other cities in Asia.
a) Original scale b) Downscaled [from open source] Figure 6 Example of land use data: population density
a) Original scale b) Downscaled [by our estimation approach] Figure 7 Example of land use data: Employee density
0 2 4 6 8 101 km
al aa
la - - - - - -
0 2 4 6 8 101 km
al aa
la - - - - - -
al aa
l a - - - - - -
al aa
l a - - - - - -
0 2 4 6 8 101 km
al aa
la - - - - -
- 0 2 4 6 8 101
km
al aa
la - - - - - -
al aa
l a - - - - - -
al aa
3.3 Transportation Data
3.3.1 Transportation network data
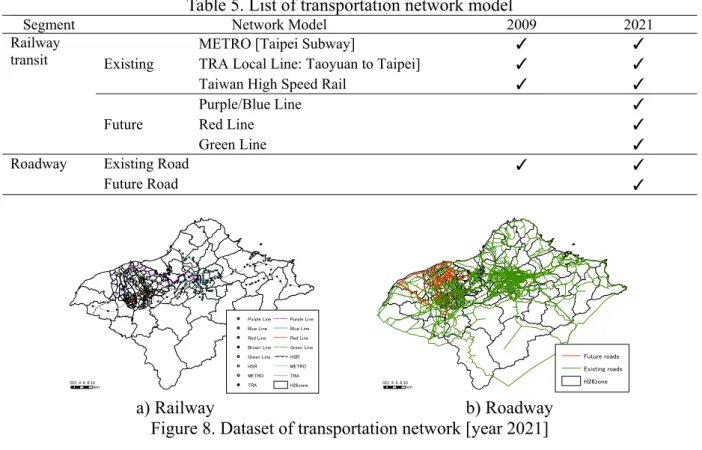
In this study, we build the railway network and roadway network in 2009 as existing networks and those in 2021 as future networks. Table 5 shows a list of the transportation network model, and Figure 8 shows a dataset of the transportation network for 2021.
Table 5. List of transportation network model
Segment Network Model 2009 2021
Railway
transit Existing
METRO [Taipei Subway] ✓ ✓
TRA Local Line: Taoyuan to Taipei] ✓ ✓
Taiwan High Speed Rail ✓ ✓
Future
Purple/Blue Line ✓
Red Line ✓
Green Line ✓
Roadway Existing Road ✓ ✓
Future Road ✓
a) Railway b) Roadway Figure 8. Dataset of transportation network [year 2021]
3.3.2 Target of transport mode
Table 6 shows a list of the transportation modes. Passenger trips consist of regular trips and visitor trips from the airport. We set four transportation modes for this category. On the other hand, we set only one mode, the truck mode, for freight trips. The passenger Origin– Destination (OD) of a usual day is an endogenous variable, and the passenger OD of an unusual day is an exogenous variable. The freight OD is also an exogenous variable.
Table 6. List of objectives for each trip and transportation modes
Objectives for each trip Transportation modes
Passenger
Usual trips Commuting trip, Personal trip, Business trip Railway, Bus, Car, Motorcycle Visitor trips
from airport Travel, Business trip Railway, Bus, Car, Motorcycle
Freight transport Truck
3.3.3 OD Data
Table 7 shows the sources for the OD data. The OD data for railways, cars, and motorcycles are cited from data published by the Taiwan government. In addition, the OD data for freight are also quoted from the published information. On the other hand, since the OD data for
0 2 4 6 8 101 km
l l
l l
0 2 4 6 8 101 km
a a
l
l l
l
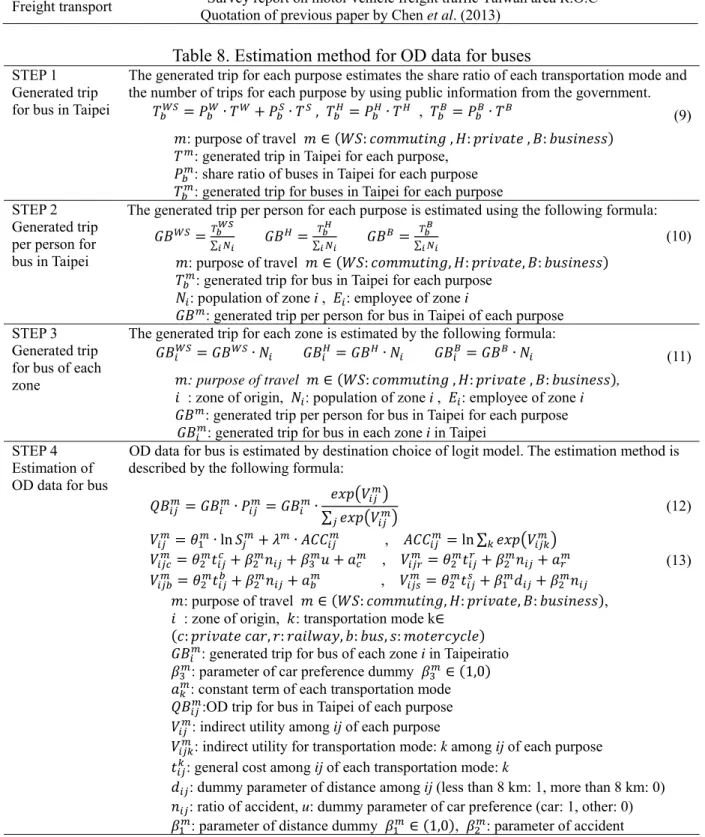
a
buses are not published for public access, it was estimated based on the trip volume for each objective in the northern area of Taiwan. The detailed estimation method for OD data for buses is shown in Table 8.
Table 7. Sources of OD data
Transportation modes Source of OD data
Railway, Car, Motorcycle “Traffic Census for Metropolis / Preference” Quotation from previous paper by Chen et al. (2013) Bus Estimation using the above OD data
Freight transport “Survey report on motor vehicle freight traffic Taiwan area R.O.C” Quotation of previous paper by Chen et al. (2013)
Table 8. Estimation method for OD data for buses
STEP 1 Generated trip for bus in Taipei
The generated trip for each purpose estimates the share ratio of each transportation mode and the number of trips for each purpose by using public information from the government.
∙ ∙ , ∙ , ∙ (9)
: purpose of travel ∈ : , : , :
: generated trip in Taipei for each purpose, : share ratio of buses in Taipei for each purpose : generated trip for buses in Taipei for each purpose STEP 2
Generated trip per person for bus in Taipei
The generated trip per person for each purpose is estimated using the following formula:
∑ ∑ ∑ (10)
: purpose of travel ∈ : , : , :
: generated trip for bus in Taipei for each purpose : population of zone i , : employee of zone i
: generated trip per person for bus in Taipei of each purpose STEP 3
Generated trip for bus of each zone
The generated trip for each zone is estimated by the following formula:
∙ ∙ ∙ (11)
: purpose of travel ∈ : , : , : ,
: zone of origin, : population of zone i , : employee of zone i
: generated trip per person for bus in Taipei for each purpose : generated trip for bus in each zone i in Taipei
STEP 4 Estimation of OD data for bus
OD data for bus is estimated by destination choice of logit model. The estimation method is described by the following formula:
∙ ∙
∑ (12)
∙ ln ∙ , ln ∑ ,
,
(13)
: purpose of travel ∈ : , : , : ,
: zone of origin, : transportation mode k∈
: , : , : , :
: generated trip for bus of each zone i in Taipeiratio : parameter of car preference dummy ∈ , : constant term of each transportation mode
:OD trip for bus in Taipei of each purpose : indirect utility among ij of each purpose
: indirect utility for transportation mode: k among ij of each purpose : general cost among ij of each transportation mode: k
: dummy parameter of distance among ij (less than 8 km: 1, more than 8 km: 0) : ratio of accident, u: dummy parameter of car preference (car: 1, other: 0)
4. COMPUTABLE URBAN ECONOMIC MODEL: CUE MODEL
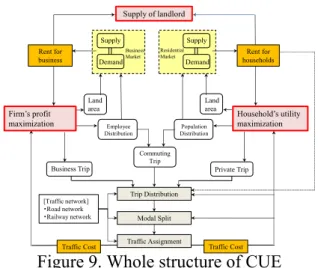
4.1 Structure of CUE Model
The CUE model, a land use transportation interaction model based on microeconomic theory, is a statics equilibrium model proposed by Ueda (1991), Ueda (1992), Muto et al. (2000), and Ueda et al. (2013). Its basic framework is applied generally in Japan. The model in this study, which is especially suitable for the analysis of a metropolitan region, is derived from the framework of the above model proposed in Yamasaki et al. (2008).
The structure of the CUE model is indicated in Figure 9. In the model, there are three agents, namely households, firms, and absentee landowners. All the agents attempt to
maximize their utility or revenue by changing their location. The consumption and investment in the trip and land will keep changing until the land market and transportation market in each zone reach a state of equilibrium. Values such as rent and generalized transportation costs also reach a state of equilibrium, which implies that locators cannot enjoy a higher level of utility or revenue in zones other than the present one.
The premise conditions are as follows:
1) The three agents are households, firms, and absentee landowners where each household is presumed to be a person with the same preference and each firm is presumed to be an employee without industry classification.
2) The metropolis is divided into several zones and each zone has homogeneous geographical and economic features.
3) The metropolis is a closed region, which indicates there is no interaction between the subject metropolis and any outside region. In addition, the population and the employee are regarded as exogenous variables.
4) The overall model reaches a state of equilibrium when the land market and the transportation market reach equilibrium. The equilibrium state in the land market and transportation market are based on the equal utility and equal travel time principles, respectively.
5) Households and firms allocate themselves by maximizing their utilities and profits. However, any additional costs owing to relocation behavior are not considered.
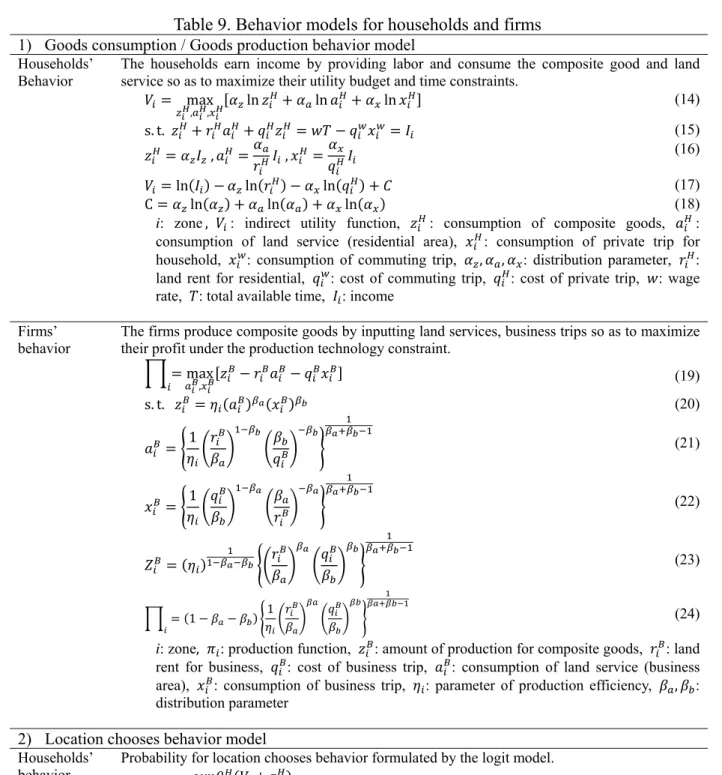
4.2 Formulation of Each Agent’s Behavior
The land use model is an equilibrium model of the land market, which corresponds perfectly to the land demand and the land supply, and the calculation of equilibrium is performed by the land value. The subjects of behaviors are households, firms, and landowners, and the land market is in the residential and business area. Table 9 shows the behavior models of households and firms, Table 10 shows the behavior model of landowners, and Table 11 shows the equilibrium conditions.
Supply of landlord
Rent for business Supply Demand Supply Demand Land area Population Distribution Trip Distribution Modal Split Traffic Assignment Private Trip Business Trip [Traffic network]
・Road network ・Railway network
Traffic Cost Traffic Cost
Firm’s profit maximization Land area Rent for households Commuting Trip Employee Distribution Household’s utility maximization Residential Market Business Market
Table 9. Behavior models for households and firms 1) Goods consumption / Goods production behavior model
Households’ Behavior
The households earn income by providing labor and consume the composite good and land service so as to maximize their utility budget and time constraints.
max
, , ln ln ln (14)
s. t. (15)
, , (16)
ln ln ln (17)
C ln ln ln (18)
i: zone, : indirect utility function, : consumption of composite goods, : consumption of land service (residential area), : consumption of private trip for household, : consumption of commuting trip, , , : distribution parameter, : land rent for residential, : cost of commuting trip, : cost of private trip, : wage rate, : total available time, : income
Firms’ behavior
The firms produce composite goods by inputting land services, business trips so as to maximize their profit under the production technology constraint.
max
, (19)
s. t. (20)
(21)
(22)
(23)
(24)
i: zone, : production function, : amount of production for composite goods, : land rent for business, : cost of business trip, : consumption of land service (business area), : consumption of business trip, : parameter of production efficiency, , : distribution parameter
2) Location chooses behavior model Households’
behavior
Probability for location chooses behavior formulated by the logit model.
∑ (25)
・ (26)
i: zone, : location choice probability for household, : population of each zone, : total population of simulation coverage area, : logit parameter for location choice model, : utility level, : other factor apart from utility level
Firms’ behavior
Probability for location chooses behavior formulated by the logit model. ∏
∑ ∏ (27)
∙ (28)
3) Demand of residential/business land and generation of private/business trip Households’
behavior
Demand of residential land and generation of private trip formulated by the following.
(29) (30)
i: zone, : demand of residential land, : number of private trip, : location choice probability for household, : total population of simulation coverage area, : consumption of land service (residential area), : consumption of private trip
Firms’ behavior
Demand of business land and generation of business trip formulated by the following.
(31) (32)
i: zone, : demand of business land, : number of business trip, : location choice probability for firm, : total employees of simulation coverage area, : consumption of land service (business area), : consumption of business trip
Table 10. Behavior model for landowners Land supply by the absentee landowner
The absentee landowner supplies the land for the households and firms with the land supply function by the following.
Residential
market (33)
: supply area for residential land, : available supply area for residential land, : parameter, : land rent for residential
Business
market (34)
: supply area for business land, : available supply area for business land, : parameter, : land rent for business
Table 11. Equilibrium conditions
Residential zone market Population Business zone market Employee
(35) (36) y (37) (38)
4.3 Formulation of Transportation Behavior
The transportation model consists of the trip generation model, the choice of destination model, and choice of transportation mode model. Table 12 shows each transportation model
Table 12. Transportation models 1) Trip generation model
Passenger [usual trip]
Private, commuting, and business trips generated formulated by the following.
(39) (40) (41)
Passenger [visitor trip from airport]
Private and commuting trips generated formulated by the following.
∙ (42)
∙ (43)
i: zone (origin), X : commuting trip generated at Taoyuan airport, : private trip generated at Taoyuan airport, : amount of arrivals at Taoyuan airport, : composition rate of visitors coming to Taiwan for pleasure, : composition rate of visitors coming to Taiwan for business
2) Destination Choice Model Passenger
[usual trip]
Probability for choice of destination formulated by the logit model. exp
∑ exp (44)
ln (45)
ln exp (46)
i: zone (origin), j:zone (destination),
m: purpose of trip, ϵ , , ,
k: mode of trip, ϵ , , , ,
: destination choice probability, : utility level of purpose : m, :ability of attracting customers index for destination : j of purpose : m, : accessibility index of purpose : m, : utility level of transportation k and purpose m, : ability of attracting customers index of purpose : m, : parameter of accessibility index of purpose m (log sum parameter)
Passenger [visitor trip from airport]
Probability for choice of destination formulated by the logit model. 1) Private trip
∑ (47)
j:zone (destination), : number of tourists 2) Business trip
exp
∑ exp (48)
ln (49)
ln (50)
i: zone(origin), j:zone(destination)
m: purpose of trip, ϵ , ,
k: mode of trip, ϵ , , ,
: destination choice probability, : utility level by purpose m, : ability of attracting customers index for destination: j of purpose: m, : accessibility index of purpose: m, : utility level of transportation k and purpose m
3) Transportation Mode Choice Model Passenger
[usual trip]
Probability for choice of transportation mode formulated by the logit model. exp
∑ exp (51)
Passenger [visitor trip from airport]
exp ∑ exp
(56) (57) (58) (59) (60)
i: zone (origin), j:zone (destination)
k: mode of trip ϵ , , ,
: share ratio of transportation mode k by purpose m, : utility level of transportation mode k by purpose m, : utility level of transportation mode k by purpose m, : generalized cost (time) of car , : generalized cost (time) of railway, : generalized cost (time) of bus , : generalized cost (time) of scooter, : dummy variable of distance among
ij (if link ij < 8 km: 0 , link ij > 8 km: 1), : occurrence ratio of traffic accident among ij, u: dummy variable of car preference (car: 1, other: 0), : parameter of generalized cost by purpose m, : parameter of distance dummy by purpose m ∈ , , : parameter of traffic accident by purpose m , : parameter of car preference dummy, ∈ , : constant term of car by purpose m , :constant term of railway by purpose m
5. ESTIMATION OF PARAMETERS
5.1 Land use model section
The values of spend distribution parameters and production function parameters are quoted from Chen et al. (2013), which are applied to the land use model. These values were
estimated using the least-squares method in the demand function on the utility maximization issue of households and profit maximization behavior of firms.
Table 13. Distribution parameters
Consumption of
residential lands
Trip generated for private purposes
Consumption of residential lands
Parameter 0.0107 0.2693 0.7200
t-statics 4.16 16.16 -
[ ]
Table 14. Production function parameters
Consumption of
commercial lands
Trip generated for business purpose
Parameter 0.0037 0.0680
t-statics 3.63 5.50
5.2 Transportation model section
Table 15. Parameters of the destination choice model [Passenger trip]
Commute/School Private Business
Parameter t-statics Parameter t-statics Parameter t-statics Accessibility index : −0.0088 −24.2 −0.0099 −23.5 −0.0045 −22.4 Attracting customers
Index: 10.8169 9.6 10.8865 9.7 14.2815 15.4
Likelihood ratio∶ 0.36 0.36 0.34
Table 16. Parameters of the transportation mode choice model
Commute/School Private Business
Parameter t-statics Parameter t-statics Parameter t-statics Generalized cost : −0.0058 −16.1 −0.0049 −11.6 −0.0027 −10.9
Distance dummy : −0.2926 −9.8 −0.1192 −3.9 -- --
Accident variable : -- -- -- -- −0.1725 −3.2
Preference dummy∶ -- -- -- -- −0.8051 −36.8
Car constant term : −1.2196 −45.0 −0.3398 −12.7 0.4843 19.9 Train constant : −1.483 −73.3 −1.113 −47.9 −1.5628 −65.7
Likelihood ratio : 0.48 0.27 0.83
6. RESULTS OF CUE SIMULATION
6.1 Simulation case
The target area of the simulation is the northern area of Taiwan, centering on Taoyuan city, and the target year is 2021. The simulation results for 2021 are compared with those of 2009 (refer to Table 17). Table 5 shows a list of the transportation network model in 2009 and 2021. Although the Taoyuan Aerotropolis is scheduled to be completed in 2041, we quote the target values of the development in 2021 from the master plan by the government of Taiwan.
Table 17. Simulation cases
Year Railway Road way Taoyuan
Aerotropolis Existing Future Existing Future
Case1 2009 ✓ ✓
Case2 2021 ✓ ✓ ✓ ✓ ✓
6.2 Future of setting scenario
Table 18 shows growth rates of the economy, population, and employees for 2021.We estimate each growth rate in 2021 by multiplying that in 2009.
Table 18. Growth rate of rate of the economy, population, and employees
Item Growth rate
[2009 to 2021] Reference
GRP 1.40 Quoting the GDP growth ratio [%/year] for the whole of Taiwan Population 1.05
Calculating the population growth rate using the estimated result of future population for the whole of Taiwan and the current population ratio of the northern area of Taiwan (Taoyuan City, Taipei City, New Taipei City, Keelung City) to that of the whole of Taiwan.
Employee 1.23
6.3 Calculation method of CO2 emissions
Two calculation cases for CO2 emissions in 2021 were conducted. One case incorporated transportation and the other case did not. The case with transportation conducts transportation infrastructure development in the 2021 situation, whereas the case of without transportation does not conduct transportation infrastructure development in the 2021 situation.
The amount of CO2 emission is calculated using the formula shown below. The car and motorcycle transportation modes were the focus of this examination, and the total amount of CO2 emission is calculated as the sum of what was generated from each road link in the northern area of Taiwan. CO2 emission intensity is a function of the driving speed of the car or motorcycle, and the shape of the function is in the form convex-downward, whose horizontal axis is the driving speed and whose vertical axis is the CO2 emission intensity. When the traffic demand of a road link has increased, traffic congestion will occur in the road link and the driving speed will be reduced. As a result, the amount of CO2 emissions generated from that road link, as well as the CO2 emission intensity, will increase. In this study, the CO2 emission intensity described above is based on Japanese data. The reason for this is that CO2 emission intensity was not available from the Taiwan government. Therefore, the evaluation method for both calculation cases was compared by using the variation ratio of CO2 emission from 2009 to 2021.
CO ∙ ∙ (61)
where,
CO : amount of vehicle CO2 emissions in road link l,
: number of vehicle trips of car and motorcycle in road link l, : length of road link l,
: driving speed in road link l, and
: CO2 emission intensity by driving speed.
6.4 Evaluation of simulation results
Figure 10 shows the simulation results for the variation in population density and employee density. Figure 11 shows the change in the land value. Both figures show the differences in each zone between 2009 and 2021. If the planned land use development and transportation development are achieved by 2021, the population density and the employee density will increase intensively around the Red Line and Green Line stations. In particular, the rate of population increase around the stations is 7%, and 74% around the Taoyuan Aerotropolis. Similarly, the rate of increase for employees is 25% around the stations and 100% around the Taoyuan Aerotropolis. In addition, the land value along the railway lines increases, especially at the connection point between the Green Line and Red Line. The residential and business areas are reallocated around the railway stations by land use development and transportation development. In particular, the rate of increase for residential land value is 3%, and the rate of increase for business land value is 11% around the stations. As a result, this area is converted to an urban form based on TOD with centering of the stations of railway transportation.
Therefore, it is necessary to reduce the utilization ratio of cars and motorcycles by applying new urban and transportation policies. This is needed in order to realize the development plan using TOD, in which residents and visitors are assumed to use public transportation. On the other hand, one of the reasons for the limited variation in transportation mode in Taoyuan City is that the parameter of generalized cost, , is too small. Therefore, the effect of transportation convenience improvement by transportation infrastructure development is limited. The number of passengers using public transportation might have been less than expected. Although, in this study, all parameters for transportation mode choice were quoted from the previous study by Chen et al. (2013), we will need to re-estimate all parameters in a future study.
In addition, when we compared the results of urban development with transportation to urban development without transportation, the reduction ratio of CO2 emissions per capita from cars and motorcycles was 0.5% in the entirety of the northern area of Taiwan. Although 0.5% is a small amount, the transportation development plan from Taoyuan City seems to have the potential to control the amount of CO2 emissions from cars and motorcycles, while considering the increase in traffic demand due to the population growth in that area. This result indicates the realization of a reduction in CO2, which is expected as an effect of TOD.
While the ratio of passengers using public transportation increased among the four transportation modes in Taoyuan City, residents and employees still chose to use cars and motorcycles in their daily life. This seems to be because the existing public transportation is in Taoyuan City is not sufficient. In addition, it is expected that the behavior range for residents will become wider as a response to traffic development, and the number of trips from Taoyuan City to cities with large groups of businesses, such as Taipei City, will increase. In this sense, one of the concerns is that it is difficult for Taoyuan City to develop a compact urban form as a center for railway stations, which is the basic concept of TOD. Besides the transportation development plan, it will be necessary to combine other policies to realize TOD in Taoyuan City. For example, Japanese TOD by private railway companies coordinates the lifestyles of people along their railway lines not only by developing the residential areas and business areas, but also by developing commercial or entertainment facilities. This was one of the keys to realizing the urban form centering around the stations of railway transportation. To realize urban development based on TOD in Taoyuan City, it is necessary to integrate transportation development and other detailed policies, such as limiting the use of cars and motorcycles around the railway stations, and promoting home building and industries within walking distance from the stations.
a) Population density b) Employees
a) Rent for residential b) Rent for business Figure 11. Simulation results for land value differences between 2009 and 2021
a) Increasing ratio of transportation trip b) Transportation mode in 2009 & 2021 Figure 12. Simulation result of transportation modes
7. CONCLUSIONS
In this paper, we have built a detailed spatial scale CUE using our estimation approach of the land use area by using satellite images.
The paper has obtained detailed scale land use information in Taoyuan City, Taiwan, where the land use data is not sufficient, by an estimation approach.
In addition, the detailed spatial scale CUE model in Taoyuan City gives us the simulation results of the travel behavior and the change of land use at a level of the area of each railway station unit. It is on a scale large enough to evaluate the transportation and land use development plan based on TOD.
We have confirmed that, through the results of the simulation in Taoyuan City, the detailed spatial scale CUE model has the potential to be applied to any other Asian and ASEAN countries where land use data are not sufficient.
There remain a few issues for future work in order to improve this study.
First, it is necessary to assess the suitable grid cell size in order to ensure sufficient accuracy of the approach of estimating land use area using satellite imagery.
automatic decision algorithm for land use should be developed.
Finally, it is necessary to improve the accuracy of our estimation approach and the CUE model. Therefore, it is necessary to apply them to other cities in Asia. Moreover, it is necessary to observe the situation of urban development in the examined city and constantly obtain updated data, because the local government does not prepare existing actual land use data for assessing the accuracy of our estimation approach.
ACKNOWLEDGMENTS
In preparing this paper, we quoted important basic data from “An Impact Analysis of the Taiwan Taoyuan International Airport Access MRT System – Considering the interaction between land use and transportation behavior.” We express our gratitude to Hsin-Ti Chen (Graduate student, Faculty of Engineering, Information and Systems, University of Tsukuba) and Kazuki Iwakami (Value Management Institute, Ltd.), who are the authors of the article.
REFERENCES
Chen, H., Tsutsumi, M., Yamasaki, K., Iwakami, K. (2013). An impact analysis of the Taiwan Taoyuan international airport access MRT system – considering the interaction between land use and transportation behavior. Journal of the Eastern Asia Society for
Transportation Studies, 10, 315–334.
Muto, S., Akiyama, T., Takagi, A. (2000). Econometric evaluation of an urban road network project considering the spatial structure change. Traffic Engineering, 44, 205– 214 (in Japanese).
Taniguchi, M. (2009). “Compact city” and “transport oriented development”: History, philosophy and reality. Urban planning, 58(5), 5–8 (in Japanese).
Tsutsumi, M., Yamasaki, K., Koike, A., Seya, H. (2012). Computable urban economics models: current issue and perspectives. Japan Society of Civil Engineers, 68(4), 344– 357 (in Japanese).
Ueda, T. (1991). A model analysis on the impact of transport improvement on household locations through increase in opportunities for life activities. Infrastructure Planning
Review, 9, 237–244 (in Japanese).
Ueda, T. (1992). A general equilibrium model with re-defined location surplus.
Infrastructure Planning Review, 10, 183–190 (in Japanese).
Ueda, T., Tsutsumi, M., Muto, S., Yamasaki, K. (2013). Unified computable urban economic model. The annals of regional science. 50(1), 341–362.
Yamasaki, K., Ueda, T., Iwakami, K. (2008). Evaluation of the economic effects by reducing the fare on Tokyowan Aqua-Line (TWAL) with endogenous developed population and induced/developed traffic. Expressways and Automobiles, 51(6), 20–32 (in Japanese).
Yamasaki, K., Ueda, T., Muto, S. (2013). Impacts of transport infrastructure policies in population-declining metropolitan area. Metropolitan Regions Advances in Spatial