1
INSTITUTE OF DEVELOPING ECONOMIES
IDE Discussion Papers are preliminary materials circulated to stimulate discussions and critical comments
Keywords: technological innovation, differentiated products, input and output markets JEL classification: Q12, Q16, Q17
* Research Fellow, Global Value Chains Studies Group, Inter-disciplinary Studies Center, IDE ([email protected])
IDE DISCUSSION PAPER No. 687
Effects of Trade Policy on Technological
Innovation in Agricultural Markets -
Implications for the Developing
Economies
Lei LEI*
Abstract
2
The Institute of Developing Economies (IDE) is a semigovernmental,
nonpartisan, nonprofit research institute, founded in 1958. The Institute
merged with the Japan External Trade Organization (JETRO) on July 1, 1998.
The Institute conducts basic and comprehensive studies on economic and
related affairs in all developing countries and regions, including Asia, the
Middle East, Africa, Latin America, Oceania, and Eastern Europe.
The views expressed in this publication are those of the author(s). Publication does
not imply endorsement by the Institute of Developing Economies of any of the views
expressed within.
INSTITUTE OF DEVELOPING ECONOMIES (IDE), JETRO
3-2-2, WAKABA,MIHAMA-KU,CHIBA-SHI
CHIBA 261-8545, JAPAN
©2018 by Institute of Developing Economies, JETRO
No part of this publication may be reproduced without the prior permission of the
3 Introduction
The increasing global interdependency between countries has induced a new set
of technological innovations as a result of food-safety issues and environmental policies
in international trade (Hayami and Ruttan 1971; Cavallo and Mundlak 1982; Coeymans
and Mundlak 1993; Carletto, De Janvry, and Sadoulet 1996; Macnaghten 2016). Among
these technological innovations, some have specifically reformed the agricultural industry
(Sunding and Zilberman 2000; Schut et al. 2016). These policy-induced technological
innovations sometimes favor certain final commodities, which are most affected by the
policy. This study examines the impact of policy-induced, biased, technological
innovation in the agricultural industry, from the prospective of developing economies.
Following a conceptual model on biased technology for differentiated products, the paper
tests the impact of biased technological innovation, focusing on the apple industry.
Furthermore, suggestions are provided to policy makers and agricultural producers.
Technological innovation significantly impacts agricultural development (Schultz
1964; Cochrane 1979) and several technological innovations have been induced by
government policies and regulations (Sunding and Zilberman 2000). For example, tomato
harvesters, which are biased toward labor input, were introduced after the Bracero
Program1 which is implemented in the 1960s. In recent years, food-safety regulations and
environmental concerns have led to more intensive research and alternatives to the
widespread use of chemicals in many stages of the production process. Examples in
agricultural and food markets include the emergence of integrated farm management
systems and various biotechnologies (Sunding and Zilberman 2000).
4
international organizations and major trade destinations also induce biased technological
innovation for countries to 1) fulfill global responsibility; 2) avoid anynon-tariff barriers
(NTBs) or meet Sanitary and Phytosanitary (SPS) standards; and 3) enjoy favorable
prices created by trade constraints. For example, because of its ozone-depleting effects,
the use of methyl bromide in agricultural production was scheduled to be banned in the
U.S. in 2005 under the Montreal Protocol. As a widely used fumigator in the agricultural
sector, especially in the strawberry industry, the economic impact of banning methyl
bromide can be significant and complex. Industry groups that invested heavily in
developing alternative fumigants were induced by the policy ban and biased toward
fumigant input (Carter et al. 2005; Goodhue, Fennimore and Ajwa 2005). Related
research studied market responses to the policy ban and to the adoption of alternatives
among U.S. trading partners (Braun and Supkoff 1994; Duniway 2002; Byrd et al. 2005).
Agricultural trade is especially important for developing countries because
agricultural sectors compose a large percentage of their economies (IDE-JETRO and
UNIDO 2013). In addition to various non-tariff measures faced by such countries when
exporting to developed countries, technological innovation is another factor that could
affect their export markets (Massa 2015; Maswana 2015). Because of strong economic
support and research and development (R&D) investment, technological innovations tend
to take place first in developed countries before spreading to developing countries.
Although missing some exporting opportunities, developing countries take time to adopt
technological innovations while observing the market’s response to policy changes and
induced technology innovations in developed countries. Later, when the induced
5
prepared and have more efficient responses. Producers then can reduce risks when
adopting those new technologies.
This paper provides a general framework to study market responses to
policy-induced technological innovations, focusing on how biased technology affects
differentiated products in different ways. In addition, it examines a specific example of a
food-safety policy that caused technological innovation to avoid SPS barriers in
international trade. Further, the paper analyzes the potential economic impact of this
biased technology, incorporating product differentiation in U.S. apple markets. When
studying this example, we derive parallel implications for developing countries from the
prospects of innovative technologies, public R&D efforts in agricultural markets, and the
development of agricultural trade policies.
Policy Background
With increasing food-safety concerns, the rules governing food production and
trade have become more and more stringent. This is particularly true for the chemicals
used in agriculture, which may harmfully affect humans if used excessively. To regulate
food-safety, Maximum Residue Limits (MRLs) are applied to both domestic and foreign
products. However, the heterogeneity of MRL across countries, which frequently causes
trade frictions and disputes, has become a major NTB issue (Burnquist et al. 2011; Li and
Beghin 2012; Xiong and Beghin 2012).
A recent SPS standard initiated by the European Union (EU) was based on MRL.
In August 2013, the EU lowered the MRL of Diphenylamine (DPA) on apples2 to 50
times below the current standard because of food-safety concerns, allowing a phase-out
6
post-harvest, physiological storage disorders in apples. It is the most widely used
post-harvest storage method in the apple industry because it is effective, easily accessible,
and cost-saving. However, as one of the most popular fruits, apples have been
consistently listed near to the top of the annual list of the “Dirty Dozen” because of high
chemical residuals (Environmental Working Group 2017). Among chemical residuals,
DPA is ranked as the second most often found residual. The EU initiated discussions
about such a DPA regulation in 2009, and a final decision was made in 2013 after
consulting with trading partners in the World Trade Organization. As one of the world’s
leading apple-consuming and importing regions, the EU’s new MRL challenged apple
producers and trade operators around the world.
Because several EU member states have a relatively high consumption of apples,
the new policy will significantly impact the global apple market, including not only EU
member states but also third countries and global food producers. The strictness of the
new MRLs not only rules out DPA-treated products but also any cross-contaminated
products in the process of storage, packing, and shipping. In general, any industry that
has not operated in a DPA-free environment for the last few years will find it difficult to
meet the new requirements (USAEC 2013). Regarding this, concerns have been
expressed by major apple-producing countries, such as Chile, China, South Africa, and
the U.S. The EU’s new MRL bans DPA on apples in most cases. Since these new MRLs
for DPA were implemented, the volume of apples exported to the EU has substantially
decreased. Only a few shippers have designated special DPA-free facilities that meet the
currently allowed MRLs and continue exporting to Europe (USDA FAS 2016).
7
developed countries. Among the top 15 apple-exporting countries, by value (based on
FAO 2016), are five developing countries: China, Chile, South Africa, Serbia, and
Argentina. China, one of the top apple-producing and exporting countries, grows a
variety of apples. The local wholesale prices of Fuji apples, a premium variety, have been
relatively low and competitive in export markets. However, access to some major export
markets, including the EU, has been hampered. In competition with that of Poland, the
EU’s regional trade is one reason for stricter Non-tariff measures (NTMs), including the
new MRLs of DPA (Sijmonsma 2016). To access the EU’s agricultural and food markets,
China and other developing countries face strict food-safety regulations and standards
(IDE UNIDO 2013). It is important to study as to how the EU regulates international
food and agricultural trade to foster exports from developing countries.
The U.S. Apple Market
The EU has been an important market for U.S. apple exports, which have moved
steadily upward since 1990 (Figure 1). The share of total exports to the EU has been
around 7%, slightly increased over that of 2004. The U.K.—the largest import market in
the EU—ranks among the top six U.S. apple-exporting destinations and accounts for
about 69% of the total U.S. apple exports over the past three decades (USITC ITS 2010).
Although Brexit (still in negotiation) could change these figures, other important EU
markets, such as Finland, the Netherlands, Spain, and Sweden, exist for U.S.’s apple
exports.
Before 2013, SPS barriers existed for U.S. apples entering the EU. However, this
new regulation could decrease Washington state’s apple exports to Europe by over 50%
8
faces challenges. Complaints have been raised from various stakeholders in the apple
industry. However, although it is risky to export apples to Europe, most apple industry
participants would be reluctant to give up the European market. If the extra supply of
apples were domestically absorbed, the U.S. apple market would be depressed.
Furthermore, exploring new export destinations could be extremely expensive. In
addition, the EU’s new MRL regulation has induced attention of other countries on the
use of DPA in apples. Similar discussions about reducing DPA in apples have been taking
place in other countries (Gillam 2014). Therefore, implementing new equipment, packing
lines, and storage rooms may be a sound investment in the long run. If the trade rule
becomes permanent, it may lead to a complete infrastructure overhaul, possibly causing
the adoption of new technologies and modernization of agricultural practices (Sunding
and Zilberman 2001). Although the overhaul brings benefits, it increases producers’ costs.
The actual effect on producers’ welfare can be highly complex, changing according to
location, time, and the degree of product differentiation. This paper focuses on measuring
the impacts (primarily measuring welfare) of the EU’s policy change in the highly
differentiated U.S. apple market.
Producers’ Responses to Input Bans in Agricultural Markets
Environmental and food-safety concerns have led to bans and other policy
changes in the agricultural industry. Previous research has studied technological and
non-technological alternatives to the system of banning substances or of becoming
compliant to the new standards. Pesticide bans provide strong incentive for the
development of alternatives by manufacturers and for the adoption of alternative
9
the elimination of dibromochloropropane, a chemical that enhanced the adoption of drip
irrigation and enabled the application of alternatives (Sunding and Zimmerman 2001).
Banning methyl bromide on nursery plants induced both chemical and non-chemical
innovations to replace it (Braun and Supkoff 1994; Duniway 2002; Byrd et al. 2005;
Carter et al. 2005; Goodhue, Fennimore and Ajwa 2005). These studies reveal that
because of policies mandating certain technologies, in the long run, producers were
benefited and rewarded for adopting them. However, short-run costs initially caused a
reduction in welfare. At the macro level, the impact of the policies, together with biased
technology, even affected agricultural trade patterns and production levels for certain
regions (Lynch, Malcolm and Zilberman 2005).
Regarding apples, no perfect chemical alternative for DPA currently exists. The
only feasible way for apple producers to meet the EU’s MRL is farm management, which
includes expediting or postponing harvests, shortening post-harvest periods, and
enhancing sorting, packaging, transport, and other elements of the post-harvest stage
(McPhee 1999).
With public R&D supported by the U.S. government, a recently developed
biomarker technology may prove to be a solution because of its easy accessibility, cost
savings, and effectiveness in solving post-harvest apple storage problems. This metabolic
and genetic biomarker could predict, diagnose, and distinguish potential post-harvest
disorders, allowing marketers to release their products before the disorders evolve too far.
It ensures that high-quality and disorder-free products remain available throughout the
supply chain. The biomarker technology is an effective alternative of DPA in various
10
feasible, sustainable, and management-based systems. A biomarker favors high-value,
more susceptible apples in particular, and enhances their yield. To better evaluate the
economics of biomarkers on high- and low-value commodities, while assessing the
welfare of producers and consumers, this paper simulates the possible impact of
biomarkers on the prices and quantities of apples at both the retail and farm levels,.
Conceptual Model
Biased technological innovation has played a significant role in social
development and economic growth. Labor and capital savings plus neutral technological
progress lead to different forms of economic growth (Ruttan and Hayami 1984; Lucas
1988; Helpman 1998; Card and DiNardo 2002). Previous research on biased technology
focused on relative factor prices, factor proportions in production, equilibrium analysis of
technology adoption, and economic growth (Kennedy 1964; Romer 1990; Acemoglu
2007). These papers studied biased technological innovation from producers’
perspectives on adopting such technology in order to minimize cost and to enhance firms’
ability to maximize profit. However, most of this work focuses on how biased technology
directly impacts factors rather than how it impacts the output of using the technologically
innovated biased factors. In addition, this paper studies how classical, biased
technological innovation favors different outputs in industries with highly differentiated
products. As these commodities require different factor amounts in production, they are
affected by biased technological innovation in different ways; such innovation favors
certain commodities through the factors toward which it is biased.
The model is set up according to the basic set up of a producer profit
11
using two factors, x1 and x2. y1 and y2 are two different types of products of the
same commodity (one is an imperfect substitution of the other). They are differentiated
by certain commodity characteristics. Factor ratios are fixed but distinct in the production
of y1 and y2. Producing both products requires two common factors x1 and x2.
Product y1 is relatively more intense in factor x1 than product y2. In other words,
producing one unit of product y1 requires more x1 than producing the same amount of
product y2. In our case, suppose a technological innovation biased toward factor x1 is
used in the production of both y1 and y2. Consider the objective function of a
profit-maximizing producer who operates in a competitive goods market, facing given
factor and goods prices, as follows:
1 2 1 2
1 2 2 1 2 1 2
1 2
1 1 1 1 2 2 2 2
1 1 2 1 2
,
max [ ( , ) ] [ ( , ) ]
x x π π= +π = P g x x −w x −w x + P g x x −w x −w x
The superscript indicates output and the subscript represents input.P is the output price.
Products y1 and y2 have different prices and are not perfect substitutes for each other.
g, the production function of output commodities for both the products, is a real-valued
function and is twice continuously differentiable (the first derivative with respect to x1
is monotonic and increases its evaluation at x1). Products y1 and y2 are produced
using the same production function, but product y1 is x1-intensive relative to
product y2 . In addition, w1 and w2 are the prices of x1 and x2, respectively.
Technological innovation enters the profit maximization problem by affecting the
production functiong.
12
which is relatively x1-intensive in production. Adopting the technology increases the
cost because the factor price of x1 increases from w1 to 1t
w . With the new technology,
the producer who only produces product y1 will increase his profit, π1. This can be
seen from the first-order condition. With the technology, the marginal product of factor
1
x increases while the factor price of x1 increases to 1t
w . For the
biased-technology-favored commodity y1,
1
1 1 1
1 2 1
( *, *) t
x
P g x x >w . The producer could
increase his profit π1 by augmenting x1. The marginal unit of x1 contributes
1
1 1 1
1 2
( *, *)
x
P g x x to revenue but costs the producer only 1t
w . Hence, using more x1 in
production would generate more revenue than the associated cost. This is a net addition to
profit. The producer will continue doing this until the first-order condition holds with
equality again. This process is shown in Figure 2a. With biased technology, the initial
equilibrium point for profit maximization (x11*,x12*) moves to (x11*',x12*'), which is the
new tangent point of the new iso-cost and iso-quant lines. The slope of the iso-cost line
changes due to the increased factor price of 1t
w . The new iso-quant line is not parallel to
the original one because of the x1-augmenting technology, indicating that the marginal
product of x1 increases faster than that of x2. In the new equilibrium, the producer
increases his use of x1 and produces more y1 for a higher profit.
On the other hand, with the technology biased toward factor x1, the producer
who only produces y2 will earn less or even experience a drop in profit π2. The reason
behind this is that as the quality and productivity of product y1 improves with the new
13
two products exist for the same commodity. Meanwhile, given the production function
1 1
2 2 1 1
1 2 1 2
( *, *) ( *, *)
x x
g x x <g x x , and depending on the value of 1t
w , it is possible that
product y2 has a first-order condition
1
2 2 2
1 2 1
( *, *) t
x
P g x x <w , the value of the marginal
product of x1, less its market price. The producer profit π2 decreases because the
additional revenue of one more unit of x1 is less than the marginal cost of using one
more unit of x1. This process is shown in Figure 2b. With biased technology, the initial
equilibrium point for profit maximization (x12*,x22*) moves to (x12*',x22*'), which is the
new tangent point of the new iso-cost and iso-quant lines. The producer continues
production in order to reach a new profit maximization, where the use of x1 is actually
reduced. If the π2 profit does not decrease initially, it will decrease later. As product y1
increases profits, resources will move to produce y1 from y2. Gradually, the producer
who only produces y2 will see lower profits.
To balance the risks of technology adoption, producers benefit from including
both products. Whether the producers of both the products will benefit from biased
technological innovation depends on their production shares of y1 and y2. On the basis
of the above conceptual model, this paper proposes the following hypothesis:
H0: Technological innovation biases favor intensive product factors. However, this
could lower the manufacturing of products with less intensive biased factors.
In the following section, this paper will test this hypothesis using a simulation analysis.
To avoid potential profit loss caused by the adoption of new technology, producers could
diversify their product lineup to include both commodities, which would show gains and
14
A simulation model is developed to test the hypothesis, using data from the U.S.
apple industry. Apple production consists of marketing and farming, and storage is part of
farming. The biomarker is biased toward marketing in apple production. As a highly
differentiated commodity, apples are susceptible to post-harvest disorders. These highly
susceptible apples are more valuable, with higher market prices, whereas non-susceptible
apples are less valuable (House 2012). Therefore, in the apple industry, the biomarker,
which favors the former type of apples, will increase the profits and welfare of apple
producers. The biomarker will have a smaller impact on less-valuable apples and their
producers. To avoid losing the biomarker, apple producers could produce high-value and
less-valuable apples. This paper develops an equilibrium displacement model of the apple
industry in order to simulate the impact of biased technology on different stakeholders in
the industry, in specific producers of different apple varieties.
Modeling the Apple Industry
As biomarker technology is still in the testing stage, an ex-ante approach is
adopted, following the frameworks typically used by agricultural economists to analyze
new technologies. Because of highly differentiated characteristics across products in the
apple market, this paper explicitly takes into account the interrelationships 1) between
input usage in different output markets; 2) between different categories of apples, defined
by variety and grade; and 3) between domestic demand and export demand. It also
considers exogenous policy shifts in input markets, technology adoption that causes shifts
in input markets, and long-run shifts in consumer demand in output markets.
To better study the impact of policy-induced technological innovations that are
15
attention must be paid to the degree of agricultural product differentiation. “Over the
years, product differentiation in agriculture has increased along with an increase in the
importance of factors beyond the farm gate and within specialized agribusiness”
(Sunding and Zilberman 2000). This evolution is affecting the nature and analysis of
agricultural research. When a policy-induced, biased technology enters the economy, it is
important to study the vertical market structure of agriculture and how farm-level
innovation may contribute to changes in both downstream and upstream sectors (Alston,
Sexton and Zhang 1997; Hamilton and Sunding 1998).
The model is based on previous simulation studies that evaluate the impact of the
biotechnologies that are adopted in agricultural markets (Binswanger 1974; Heuth and
Just 1987; Lemieux and Wohlgenant 1989) and extended to incorporate biased
technological impacts in multi-input and multi-output models. Here, exogenous shocks
are imposed by considering the vertical linkage of multi-input and multi-output markets.
The linear elasticity model is compatible with parameter values selected through
econometric or programming approaches. In addition to the agricultural industry’s major
empirical contributions in policy making and technological innovation, this paper’s
analysis could be generally applied to other markets with highly differentiated products.
As a widely consumed and popular commodity, about 20 major varieties of apples
are planted in the U.S. Stakeholders in the commercial apple industry include apple
orchards, storage carriers, packing facilitators, and wholesalers and retailers in
international markets. As shown in Figure 3, this model simplifies the apple market. As
this paper focuses on the EU–U.S. apple trade, subject to the EU’s SPS regulation in the
16
exported to the EU market (Empire, Gala, Honey Crisp, and Granny Smith) and 2)
varieties that suffer most from post-harvest disorders (Honey Crisp, Granny Smith, and
Empire). Of the four varieties of apples exported from the U.S. to the EU, three are
highly susceptible. These varieties suffer from the following disorders: Empire (browning,
external CO2 injury), Honey Crisp (soft scald), and Granny Smith (superficial scald).
Gala is a non-susceptible variety. Empire, Honey Crisp, and Granny Smith apples are
higher-value apples, garnering higher market prices, whereas Gala is relatively less
expensive. Therefore, the former group is considered high-value (H-type) and the latter is
low-value (L-type).
In addition to variety-based classification, apples are also categorized by grade.
Apple grades are based on size, shape, color, and overall quality. Higher-grade (E) apples
are sold as a fresh fruit while culls (C) usually are processed to make juice, jam, and
apple sauce. Combining these classifications, this paper studies four types of apples:
higher-value high-grade (HE), higher-value culls (HC), lower-value low-grade (LE), and
lower-value culls (LC). The high- and low-value classification of apples directly captures
biomarkers’ biased impact of preferring storage as an input. Further grade classification
explicitly studies policy and induced technology impacts. Higher-grade, exported apples
are directly affected by the EU’s SPS regulation, while culls (C) are not. In addition,
induced, biased technological innovations (i.e., a biomarker) could “upgrade” culls to
higher-grade (E) apples. The detailed classification of apples is used to capture
product-level details and substitution effects in the apple market.
Our model includes two inputs: farm inputs and marketing inputs. Storage of
17
farm input. Farm inputs are used for both higher-value (FH) and lower-value apples (FL).
Apple grades determine how much marketing input is needed. Marketing inputs are used
for higher-grade apples (ME) and culls (MC). In general, higher-grade apples require less
marketing input than culls (Stewart et al. 2011). Considering this fixed-factor proportion
assumption, for a given grade, higher-value apples use more farm input per unit (which
includes storage) than lower-value apples. In other words, FH is greater than FL. For a
given variety, higher-grade apples use less marketing input than culls, and thus, ME is
less than MC.
The simulation model was developed to assess the impact of exogenous policy
and technological innovation shocks in the highly differentiated U.S. apple market’s open
economy. A set of basic equations is used to describe national demand, export demand,
supply, and the corresponding factor markets. This equilibrium displacement model
includes markets for four outputs and two factors. As a simplification of the U.S. apple
market, it captures critical characteristics found in the industry and provides a useful
framework to examine the impact of policy change and biased technological innovation.
The model is as follows:
(1) i i( , i)
QD = f P A
(2) i i( , i)
QX =g P AX
(3) i i i
QS =QD +QX
(4) i i( )
P =MC W
1
( ,1) (5)
i N
i l
l
i l
c W
XD QS
W
=
∂ =
∂
∑
(6) XSl =h W Bl( l, l)(7) XDl = XSl
Apple output is denoted by superscript i and input is denoted bysubscript l. In the
18
exogenous demand shift A in the output market. Variable QX represents apples
exported abroad (international and country-specific apple demand), subject to an
exogenous shift AX. Variable P is an apple price vector, which assumes that domestic
prices equal the world price. Variable QS represents apple supply. For the two input
markets, XS represents input supply and XD is a derived input demand (a
constant-output, demand-input function). Factor prices of farm and marketing inputs are
denoted by W. The adoption of new technology biomarkers brings an exogenous shift to
the input supply, represented byB. In equations (4) and (5), MC is the marginal cost
function, and i( ,1)
l
c W denotes the unit cost function.
Equations (1) and (2) represent domestic and export demand for output apple i.
Equation (3) shows the clearing condition of the apple output market. Apple i’s retail and
wholesale price equals the marginal cost of producing it. Equation (4) shows the
competitive equilibrium, which is the price linkage between output and input markets.
Equation (5) is the derived demand function of input l. The summation of i l
XD across
all varieties of apples generates total input demand l, which indicates the input market
equilibrium. Equation (6) is the supply of input l. The last equation (7) is the clearing
condition of the input market.
For the simulation, differentiating the above model yields equation (1’) to
equation (7’). Equilibrium adjustments can be simulated by exogenously specifying
changes in the shift parameters. In the following equations, for any variable V, notation
E(V) represents dV
19 1
(1') EQD EP
N
i ij j i
j
η α
=
=
∑
+1
(2 ') EQX EP
N
i ij j i
j
x x
η α
=
=
∑
+(3') EQ i iEQDi (1 i)EQXi
S =S + −S
1
(4 ') EP EW
M i i l l l γ = =
∑
1 1(5 ') EXD ( EW EQS )
N M
i i i i
l l k lk k
i k
λ γ σ
= =
=
∑ ∑
+(6 ') EXSl =εlEWl +βl
(7 ') EXDl =EXSl
Notations for share and elasticity parameter values used in the simulation are reported in
Table 1. A detailed definition of the model’s parameters is provided in the following
section.
Data and Parameters
Apple data from the Washington Grower Clearing House for 2011–20123 are used
in the model’s simulation4. Weighted average monthly prices at “Free On Board”
shipping points are used on the basis of the price information received from Washington
apple growers and marketing firms in the area, considering sales price adjustments. A
calculation is made to obtain the annual price, and a similar calculation is applied for
apple quantities in two seasons. All quantities are measured in “Cargo,” which contains
1000 40-pound cartons. As mentioned before, three varieties, Empire, Honey Crisp, and
Granny Smith, were selected as high-value (H) apples. Price and quantity data for
high-value apples were calculated and weighted by the market share of each variety. For
apple grade, Extra Fancy and Fancy (including U.S. #1) apples were considered of the
higher-grade (E). No direct data about culls (C) are available. Therefore, an average
20
regarding higher-grade apples. Table 2, which shows the data used in the model, lists the
quantity and price data of the four outputs and two inputs used in each output production.
Given the apple prices and quantity data for retail and wholesale markets, input
prices and quantity data are calculated on the basis of a fixed-factor proportion
assumption. Isolating apple output by variety is done to distribute the total farm input,
which is distinguished only by variety. Similarly, isolating apple output by grade is done
to distribute marketing inputs, which vary only by grade. As per the model’s setup, the
key parameters in evaluating the economic impact of the biomarker are (1) the elasticities
of supply, demand, and export demand; (2) cost and industry share; and (3) policy shocks
on the output demand side and shocks from adopting a new technology on the factor
supply side.
Parameters in (1) were first obtained from baseline values in relevant literature.
Then, following the studies by Davis and Espinoza (1998, 2000), Griffiths and Zhao
(2000), Zhao et al. (2000), and Rickard and Lei (2011), I applied prior distributions to
these parameters for a sensitivity analysis. I set the baseline parameter as the central
tendency and specified a variance of 0.04 to develop beta (3,3) distributions (Brester,
Marsh and Atwood 2004). The beta distribution is ideal for generating elasticity
parameters because it is continuous and symmetrical when parameters are equal and
equivalent to a uniform distribution when parameters equal to 1. It is often used to model
events that are constrained and take place within an interval defined by minimum and
maximum values. The beta distribution selected here constrains demand elasticities to be
negative and supply elasticity to be positive. Iterated 1,000 times, random values are
21
Following previous estimates about supply elasticity from previous literature
(Nerlove and Addison 1958; Gardner 1979), the baseline supply elasticity parameter for
apples was set to 0.5 because the supply of fruit is relatively inelastic. Furthermore, all
cross-price elasticities of supply are set to zero because apples are perennial crops
(Rickard and Lei 2011).
The domestic matrices of own- and cross-price elasticities of apple demand ηii
and ηij
are calculated following the Armington specification (Armington 1969).
(8) ηii =ς ηi - (1-ς σi)
(9) ηij =ς η σj( + )
The Armington specification is typically used for calculating the elasticity of
differentiated commodities. It extends the homogeneous goods model to examine the
demand response for differentiated goods (Rickard and Lei 2011). In this paper, it is used
to define the matrix of own- and cross-price elasticities of apple demand, differentiated
by both variety and grade. In equations (8) and (9), the overall demand elasticity η and
the elasticity of substitution across the four different apple types σ are set as equal to
baseline values from the literature. The baseline value of the overall demand elasticity η
is based on the demand elasticity of the top eight apple varieties,6 as estimated by Richard
and Patterson (2000). I averaged and weighted them by the market share of these
varieties of apple, and the value was calculated to be −0.762. The baseline value of the
substitution across apples, σ , is set equal to 1, following range estimates used in the
literature on agricultural economics (Alston, Gray and Sumner 1994; Rickard and Lei
2011). Substitution between fruit products has not been directly estimated and is not
22
baseline elasticity of substitution, and results are robust across a range of plausible
values.
Several studies (e.g., Alston, Gray and Sumner 1994) have discussed the
limitations of the Armington specification. However, based on the specific differentiation
of apples in this paper and data availability, the Armington specification is an appropriate
method to generate the matrices of elasticities. The same method is applied for export
demand elasticity. The only difference in this specification, with regard to the Arlington
specification, is the overall demand elasticity for exports, which is set to –1.5—more
elastic than domestic estimation—on the basis of the estimates by the U.S. International
Trade Commission (2010). On an average, between 2004 and 2008, about 8%–16% of
U.S. apple production was exported. Simulation results are robust for demand elasticity’s
chosen value, within a range of −1.0–−2.5.
Parameters in (2) are shares calculated from the data on quantity and by applying
certain assumptions. The share of consumption S derives from the apple export studies
by the United States International Trade Commission (USITC) (2010), from the data in
Table 2, and by following assumptions and common knowledge supplied by stakeholders
in the apple industry (Washington Grower House 2012; Reed, Elitzak and Wohlgenant
2002). The cost share of input i l
γ is calculated following the “20% and 80%” rule
(Stewart et al. 2011), which states that for each dollar invested in apple production, 80
cents are used for marketing and 20 cents are used for farm production. For industry
share i l
λ , I assume that higher grades of apples usually need less marketing than the lower ones. Higher-grade apples require a smaller share for marketing (65%) but a higher
23
elasticity of substitution i lk
σ is assumed to be 0 across different inputs on the basis of
the fixed-factor proportion assumption, and 1 for the same input (Sumner, Lee and
Hallstrom 1999; Rickard and Lei 2011).
Parameters in (3) represent exogenous shocks. Parameter αi
describes the EU’s
SPS regulation change and estimates a policy shock in the simulation model. Considering
that new SPS regulations were implemented on March 2, 2014, no accurate data is
available to estimate this parameter. About 23% U.S. apple exports go to the European
market (USITC 2010). With the new SPS regulation, exports from the two major U.S.
apple-growing and exporting states, Washington and New York, are expected to drop
noticeably. Between 8% and 16% of U.S. apple production was exported annually
between 2004 and 2008 (USITC 2010). The maximum 16% figure produces a calculated
5% drop in apple demand. As higher-value apples are susceptible to post-harvest
disorders and are being exported to the EU, high-value and higher-grade apples will get
the most affected by the policy shock. I assume that the same shock will affect export
demand for U.S. apples.
Parameterβi
, which describes technological change as an exogenous variable, is
used in the simulation model to introduce shocks caused by biased technological
innovation. The biomarker increases marginal farm input products. On the other hand,
apple producers pay to buy the biomarker and thus the difference between them will be a
net shock applied to farm input. Due to limited data availability and the complexity of the
impact, some assumptions and approximations are made in the calculation. A biomarker
could “upgrade” low-grade apples to higher-grade apples, i.e., from culls to high-value
24
after applying the biomarker in the post-harvest stage.7 As a result, the new packout will
be 92.5%, with a 7.5% improvement. The biomarker has not been priced yet because
price data are required to understand consumers’ willingness to pay. For now, based on
the information provided by the biomarker developer, production cost is quite low. I
assume that adopting the biomarker will only increase farm input cost by 2.5%. Therefore,
for higher-value apples, the net benefit of farm input for adopting technological
innovation is 5%.
Measuring Welfare
Simulated changes are reported for prices and quantities as a result of the EU’s
policy change. Welfare changes accruing to consumers and producers are measured using
information about initial product prices and simulated changes in product prices and
quantities. To obtain a mean prediction of changes in surplus measures, 1,000 iterations
are repeated in the simulation model. Each iteration draws values for elasticity
parameters from empirical distributions that rely on estimates in the literature while
initial prices and quantities remain the same across all iterations. As welfare is calculated
on the basis of a range of elasticities with fixed prices and quantities, welfare results as
well are generated as distributions. Studying welfare results provides a better
understanding of the impact of technological changes.
The following equations are used to calculate welfare accruing to consumers of
product i and to producers from factor l. Policy changes or technological innovations in
the market are reflected by the variables EP, EQD, EW, and EXS. Therefore, the
following equations capture changes in welfare:
i i i i i
25
l l l l l
ΔPS = W XS EW [1 + 0.5EXS ] (11)
The initial price and quantity of apple i and the initial price and quantity of factor l are
shown in Table 2. Factor quantities are calculated on the basis of output quantities,
following the fixed-factor assumption, and each value is weighted by market shares of
different apples. Factor prices are calculated according to the “80%/20%” rule based on
output prices and are weighted by market share.
Results and Discussion
Below are the results for four simulations:
1. A 5% decrease in export demand for high-value, higher-grade apples because of
the EU’s SPS regulation change. No other changes to apples occur.
2. A 5% increase in the farm input for high-value apples because of new, biased
technology. No other changes to apples occur.
3. Simulations 1 and 2 simultaneously
4. With consumers recognizing biomarker-treated apples, a 15% increase in both
domestic and export demand takes place for high-value and higher-grade apples,
in conjunction with Simulation 2.
Simulation 1 captures the EU’s SPS impact on the U.S. apple market. A 5%
exogenous shock is applied to high-value, higher-grade apples, because this type of
apples, highly susceptible to post-harvest disorders, is the most affected by the change.
Using DPA is a must in its storage. Higher-grade, fresh apples are primarily exported to
the European market (USITC 2010).
Simulation 2 adopts new biomarker technology.8 The 5% net biomarker benefit is
26
benefits primarily derive from culls upgraded to higher-grade apples.
Simulation 3 compares policy and technology impacts to determine the
effectiveness of biomarker technology. Can it be an effective, alternative method to avoid
using DPA, so that U.S. apples can comply with the new MRL set up by the EU? Will it
be able to mitigate the impact of certain policies in the U.S. apple market? If so, to what
extent? Simulation 4 shows the long-run result. If the biomarker is an effective alternative
for the DPA, the U.S. market will see no more policy shocks. Given the function of the
biomarker, it should be well accepted by consumers because treated apples will not suffer
post-harvest disorders (i.e., flesh browning, superficial scalding, and other issues). This
will increase consumer demand for such good-quality apples. Although consumer
demand for this type of apples may change, lower-grade apples also are expected to
experience a quality upgrade with biomarkers. Therefore, the supply of different types of
apples changes. Given that the share of higher-grade apples of each variety is 85%, and
the market share of the three high-value varieties selected here is about 17%, a
conservative estimate of the increase in consumer demand is set to 15%.
Each simulation imposes exogenous shock(s) to the system of equations and
generates empirical distributions for changes in prices and quantities as well as welfare
changes for the four apple outputs and the two input factors used in the four outputs.
Empirical distributions are used to calculate the mean and a 95% confidence interval for
price, quantity, and welfare variables across 1,000 iterations (more iterations have been
calculated but the results do not differ greatly. Therefore, I report the mean value in the
results table, plus a 95% confidence interval).
27
output and input markets. The four columns correspond to each of the simulation
scenarios. The first column represents when the U.S. apple market is subject to the policy
change. The EU’s SPS regulation change affects apples with post-harvest disorder
problems exported to the EU. With a natural decrease in apple export demand from the
European market, the supply of high-value, higher-grade apple product declines by
16.73%. This drop is distributed into a 13.98% decrease in farm input and a 0.12%
increase in marketing input. The decreased farm input supply also affects high-value culls
by −0.58% because high-value apples have intensive farm input. Decreasing the supply
of all high-value apples leads to increasing production of low-value apples in both the
grades, in the form of consumer substitutes. Therefore, the policy shock decreases supply
(and demand) for all high-value exported apples but has a positive effect on low-value
apples. The derived demand of farm supply decreases, principally because of lower MRL
in the EU. Before an effective alternative is introduced, this trend is expected to continue.
In the second scenario, adopting a biased technological innovation increases the
farm factor supply of high-value apples by 2.34%. Together with marketing inputs, the
retail-level supply of three types of apples (excluding high-value culls) increases. A lower
supply of high-value culls proves the effectiveness of the biomarker, which “upgrades”
apples by avoiding further post-harvest disorder problems. This “upgrading” partly
contributes to increased high-value, higher-grade supply. Retail prices of apples change
accordingly, depending on the equilibrium status of the retail market. When biomarker
technology is the only shock to the apple industry, the new technology seems to be an
effective alternative to banning farm input.
28
emphasize the bias of technological innovation. Despite the presence of both policy
changes and a biased technology, high-value apple supplies still drop (by −12.19% and
−0.02%). However, these lower grades for high-value apples are smaller than the results
in Simulation 1. Moreover, all the results listed in column 3 have the same sign as those
in column 1, but the absolute values of all the negative changes are smaller in Simulation
3 compared to those in Simulation 1, and the values of all the positive changes are larger
than those in Simulation 1. Therefore, biomarker technology effectively mitigates the
effects of the EU policy ban on the U.S. apple market.
In the long run (Simulation 4), a biomarker is accepted by consumers, which
stimulates the production of better-quality and higher-grade apples. With positive impacts
from both the biased technology (+5%) and consumer recognition (+15%) on high-value,
high-grade apples, farm supplies of high-value apples increases by 3.49% (compared to
2.34% with biomarker adoption only in Simulation 2). Low-value apple production
decreases by 0.53% (compared to −0.01% with the biomarker alone in Simulation 2).
Meanwhile, 0.03% less marketing input is needed to sell high-value apple products, but
0.04% more is required for low-value apple products. Apple producers have to put more
effort into promoting the sale of low-value apples. This result can also be observed at the
retail level. Both the grades of high-value apples increase—4.18% for higher-grade
apples and 0.15% for culls, whereas decreases of 0.65% and 0.003% occur for low-value
higher-grade apples and low-value culls, respectively. More high-value apples and fewer
low-value apples are demanded and supplied. As a result, prices of high-value
higher-grade apples increase by 1.98%, which lead to higher profits for producers.
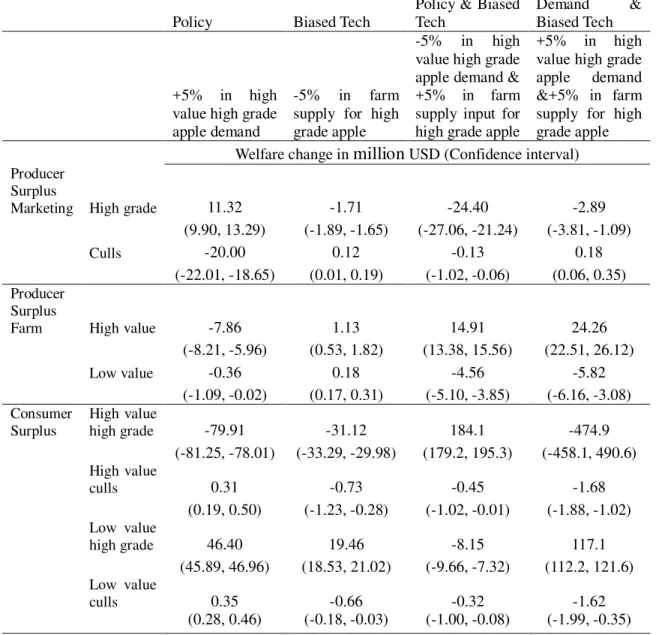
29
welfare changes. In the first column, the SPS regulation change causes farm input
producers to lose $7.86 million from high-value apple markets and $360,000 from
low-value markets. Marketing input producers gain a surplus of $11.32 million from
higher-grade apples but lose $20 million from culls. Producers are worse off in general,
especially those who produce high-value higher-grade apples that are affected by the EU
policy ban. Consumers of high-value higher-grade apples lose $79.91 million because of
the policy change, for two reasons: 1) they realize the health risks of consuming
high-value higher-grade apples and 2) fewer high-value higher-grade apples are available.
Thus, they might be better off consuming low-value apples.
Producers who market high-value apples, using farm inputs with biased
technology, are more profitable, earning $1.13 million. While the producers of low-value
apples are also better off, their profits increase by a lower $180,000. In the third scenario,
which incorporates both policy and technology shocks, the impact of biased technology
becomes a more dominant measurement of welfare. With a policy specifically imposed
on high-value higher-grade apples, the biomarker benefits producers of high-value apples
but harms the producers of low-value apples. The producer surplus for the former is
$14.91 million and negative $4.56 million for the latter. Furthermore, in Simulation 4,
with greater consumer demand for high-value apples, the producer surplus is $24.26
million, much more than in Simulation 2. Higher demand for high-value higher-grade
apples helps these apples’ producers. At the same time, producers of low-value apples
suffer a loss of $5.82 million. The 1.98% retail price increase of high-value higher-grade
apples costs consumers about $474.9 million.
30
This paper focuses on the relation between trade policy and biased technological
innovation in agricultural markets in order to examine how market production and
consumption influences stakeholders’ welfare. While it focuses on the U.S. apple market,
its conclusions and implications can be applied to other countries, including developing
countries. The EU’s altered SPS regulation on imported apples has directly affected
storage of apples (farm input). A biased technological innovation is a potential solution to
the policy change. This paper evaluates the impact of trade policy changes and
corresponding technology adoptions to highlight the effects of agricultural trade in a
market with highly differentiated products. In addition, it tests a hypothesis about biased
technology to provide suggestions to exporters and stakeholders about production
decisions and technology adoption.
Simulation 1 examines the impact of a European trade policy change on the U.S.
apple market. Although the EU market accounts for only about 16% of U.S. apple exports,
as a result of the complexity of NTBs in agricultural trade, it has a large impact on the
U.S. domestic market. As long as U.S. apple producers continue exporting to the
European market, they will have to rebuild storage, sorting, packaging, and transportation
facilities to avoid cross-contamination and to meet the EU’s new MRL. Producers who
achieve this will be able to earn substantial profits. Other producers will have to
completely forfeit the EU market.
The policy has a negative impact on both the U.S. apple input and output markets.
It causes welfare losses for producers who adopt the policy affecting farm input and for
consumers who purchase exported, high-value higher-grade apples. The U.S. government
31
potential losses caused by this trade policy. In addition to looking for alternative storage
methods, U.S. apple producers should explore other export destinations.
Simulations 2, 3, and 4 show the effectiveness of biased technological innovation
by studying its impact on quantity, price, and the welfare of stakeholders. The biomarker
effectively increases the supply of high-value apples at both farm and retail levels by
enhancing the efficiency of post-harvest apple storage. Future acceptance of this new
technology could accelerate consumer demand for high-value higher-grade apples.
Development of such a technology should be supported by both the public and private
sectors. Technological innovation is particularly important in the agricultural industry,
whose production always involves numerous factors (Binswanger 1974).
Simulations 2, 3, and 4 also test Hypothesis H0. Producers of high-value apples
enjoy a welfare gain in all three scenarios. Those who produce low-value apples suffer a
welfare loss. (This is consistent with H0.) In the presence of a biased technology,
producers in the industry should increase the production of commodities that are favored
by the technology, decreasing the production of other commodities. This would maximize
their welfare and minimize the risks from exogenous shocks, such as policy and
regulation changes, market failures, and natural disasters. The initial cost to shift
production would not be extremely high when the market includes highly differentiated
products. In addition, factors required for production would largely remain the same.
To sum up, changes in a country’s trade policy will affect its trading partners. One
way to maintain trade is technological innovation. Policy-induced technologies may be
biased toward certain production aspects of a traded commodity to be in line with altered
32
input), the new technology is biased toward farm input. Biased technology will bring
shifts in production and consumption. Particularly when markets include highly
differentiated products, these shifts are complex due to substitution effects between
outputs and inputs and the vertical linkage between input and output markets. However,
added complexity also provides producers opportunities to avoid loss and maintain a
surplus. Exporters whose production is affected mostly by trade policy change will
experience losses if no effective alternative technology can be found. Alternatively,
producers could shift their production more toward products that take advantage of the
policy and the biased technology. In a market with highly differentiated products and an
effective policy-induced technology, a trade policy shock could become a net benefit for
exporters who adopt the appropriate technologies.
Developing countries, which also may face the same policy change and
policy-induced technological innovation, can learn from developed countries' experience.
However, some policy-induced technological innovations, while facilitating trade and
fostering economic growth, may bring challenges to the economy, the country’s
well-being, and the environment (UNCTAD 2004). Developing countries need to be
33
End Notes
1 The termination of the Bracero Program resulted in reduced availability of inexpensive
immigrant labor for California and Florida growers.
2 COMMISSION REGULATION (EU) No 772/2013 of 8 August 2013 amending
Annexes II, III and V to Regulation (EC) No 396/2005 of the European Parliament and of the Council as regards maximum residue levels for diphenylamine in or on certain products. Pear is another product targeted in the regulation, in addition to apples.
3 Washington Grower Clearing House, 55th Annual Apple Price Summary for the
2011-2012 Marketing Season
4 Only non-organic apples are considered in this research because organic apples do not
apply DPA for post-harvest storage.
5 “The percentage of fruit deemed acceptable for a fresh market outlet is known as the
“packout percentage.” For example, if a load of navel oranges has a packout of 64%, this means that out of 100 navel oranges, 64 were deemed acceptable for the fresh market. The remaining 36 were sorted out and sent to the processing plant.” (Muraro, Roka and Timpner 2007)
6 Red Delicious, Golden Delicious, Granny Smith, Fuji, Gala, Braeburn, Jongold, and
Rome.
7 The statement that 50% culls are upgraded into a higher-grade is a general assumption
based on their composition. Culls are small, abnormally shaped apples. This irregular appearance is caused by post-harvest disorders (Rules and Regulations Relating To NEW
YORK STATE APPLE GRADES. Available at: http://www.agriculture.ny.gov/FS/pdfs/farmcircs/circ859.pdf)
34
References
Acemoglu, D. 2007. “Equilibrium bias of technology.” Econometrica75(5), 1371-1409. Alston, J. M., Gray, R., and Sumner, D. A. 1994. “The wheat war of 1994.” Canadian
Journal of Agricultural Economics/Revue canadienne d'agroeconomie42(3),
231-251.
Alston, J. M., R. J. Sexton, and M. Zhang. 1997. “The effects of imperfect competition on the size and distribution of research benefits.” American Journal of Agricultural Economics79(4), 1252-1265.
Armington, P. S. 1969. “A theory of demand for products distinguished by place of production.” Staff Papers16(1), 159-178.
Binswanger, H. P. 1974. “The measurement of technical change biases with many factors of production.” American Economic Review 64(6), 964-976.
Braun, A. L., and D. M. Supkoff. 1994. “Options to methyl bromide for the control of soil-borne diseases and pests in California with reference to the Netherlands.” Environmental Protection Agency, Environmental Monitoring and Pest Management Branch.
Brester, G. W., J. M. Marsh, and J. A. Atwood. 2004. “Distributional impacts of country-of-origin labeling in the US meat industry.” Journal of Agricultural and Resource Economics 206-227.
Burnquist, H. L., K. Shutes, M. L. Rau, J. P. de Souza, and R. F. de Faria. 2011. “Heterogeneity Index of Trade and Actual Heterogeneity Index–the case of maximum residue levels (MRLs) for pesticides.” In Posted presented at the Agricultural and Applied Economics Association’s Annual Meeting, May, Pittsburgh, PA (pp. 24-26).
Byrd, M. M., C. L. Escalante, M. E. Wetzstein, and E. G. Fonsah. 2005. “A Farm-level Approach to the Methyl Bromide Phase-out: Identifying Alternatives and Maximizing Net-worth Using Stochastic Dominance and Optimization Procedures.” Doctoral dissertation. University of Georgia.
Card, D., and J. E. DiNardo. 2002. “Skill biased technological change and rising wage inequality: some problems and puzzles”. Working paper No. w8769. National Bureau of Economic Research.
Carletto, C., A. De Janvry, and E. Sadoulet. 1996. “Knowledge, toxicity, and external shocks: the determinants of adoption and abandonment of non-traditional export crops by smallholders in Guatemala” (p. 32). Department of Agricultural and Resource Economics, Division of Agriculture and Natural Resources, University of California at Berkeley.
Carter, C. A., J. A. Chalfant, R. E. Goodhue, F. M. Han, and M. DeSantis. 2005. “The methyl bromide ban: Economic impacts on the California strawberry industry.” Applied Economic Perspectives and Policy 27(2), 181-197.
Cavallo, D., and Y. Mundlak. 1982. Agricultural and Economic Growth in an Open Economy: The Case of Argentina. International Food Policy Research Institute, Research Report No. 36, Washington, D.C.
Coeymans, J. E., and Y. Mundlak. 1993. Sectoral growth in Chile, 1962-82 (No. 95). Intl Food Policy Res Inst.
35
U of Minnesota Press.
Davis, G. C., and M. C. Espinoza. 1998. “A unified approach to sensitivity analysis in equilibrium displacement models.” American Journal of Agricultural Economics 80(4), 868-879.
Davis, G. C., and M. C. Espinoza. 2000. “A unified approach to sensitivity analysis in equilibrium displacement models: Reply.” American Journal of Agricultural Economics82(1), 241-243.
Duniway, J. M. 2002. “Status of chemical alternatives to methyl bromide for pre-plant fumigation of soil.”Phytopathology 92(12), 1337-1343.
Environmental Working Group. 2017. EWG’s 2017 Shopper’s Guide to Pesticides in
Produce. Available at:
https://www.ewg.org/foodnews/dirty_dozen_list.php#.WcC9ZchJaUk
Gardner, H. W. 1979. “Lipid hydroperoxide reactivity with proteins and amino acids: a review.” Journal of Agricultural and Food Chemistry27(2), 220-229.
Gillam, C. 2014. “Amid Health Concerns, Nonprofit Urges EPA To Halt Apple Pesticide That’s Already Banned In Europe.” Huffpost June. Available at: http://www.huffingtonpost.com/2014/04/24/halt-apple-pesticide_n_5202901.html
Goodhue, R. E., S. A. Fennimore, and H. A. Ajwa. 2005. “The economic importance of methyl bromide: Does the California strawberry industry qualify for a critical use exemption from the methyl bromide ban?” Applied Economic Perspectives and Policy27(2), 198-211.
Griffiths, W., and X. Zhao. 2000. “A unified approach to sensitivity analysis in equilibrium displacement models: Comment.” American Journal of Agricultural Economics82(1), 236-240.
Hamilton, S. F., and D. Sunding. 1998. “Returns to public investments in agriculture with imperfect downstream competition.” American Journal of Agricultural Economics80(4), 830-838.
Hayami, Y., and V. W. Ruttan. 1971. Agricultural Development: An International Perspective. Baltimore: The Johns Hopkins University Press.
Hayami, Y., and V. W. Ruttan. 1984. “The green revolution: inducement and distribution.” The Pakistan Development Review 37-63.
Helpman, E., ed. 1998. General purpose technologies and economic growth. MIT Press.
Hueth, B., B. McWilliams, D. Sunding, and D. Zilberman. 2000. “Analysis of an Emerging Market: Can Methyl Iodide Substitute for Methyl Bromide?” Review of Agricultural Economics22(1), 43-54.
Hueth, D. L., and R. E. Just. 1987. “Policy implications of agricultural biotechnology.” American Journal of Agricultural Economics 426-431.
Karst, T. 2013. “U.S. apple exports to Europe at risk.” The Packer May. Available at:
http://www.thepacker.com/fruit-vegetable-news/US-apple-exports-to-Europe-at-risk-205642871.html
Kennedy, C. 1964. “Induced bias in innovation and the theory of distribution.” The Economic Journal74(295), 541-547.
Lemieux, C. M., and M. K. Wohlgenant. 1989. “Ex ante evaluation of the economic impact of agricultural biotechnology: The case of porcine somatotropin.” American Journal of Agricultural Economics 71(4), 903-914.
36
application to maximum residue levels.” Food Policy45, 57-68.
Lucas Jr, R. E. 1988. “On the Mechanics of Economic Development.” Journal of Monetary Economics 22(1), 3-42.
Lynch, L., S. A. Malcolm, and D. Zilberman. 2005. “Effect of a Differentially Applied Environmental Regulation on Agricultural Trade Patterns and Production Location: The Case of Methyl Bromide.” Agricultural and Resource Economics Review 34(1).
Macnaghten, P. 2016. “Responsible innovation and the reshaping of existing technological trajectories: the hard case of genetically modified crops.” Journal of Responsible Innovation3(3), 282-289.
Massa, I., 2015. “Technological change in developing countries: Trade-offs between economic, social, and environmental sustainability.” UNIDO Working Paper 21/2015 Maswana, J. C. 2015. “Assessing the Effects of Trade-induced Technology Imitation on
Economic Growth in Africa.” Procedia Economics and Finance30(), 543-549. McPhee, B. 1999. “Field management of postharvest rots reviewed.” Good Fruit Grower
50(5)
Muraro, R., F. Roka, T. Spreen, and M. Timpner. 2007. The "phantom costs" of Florida's
citrus industry.FE699. Gainesville: University of Florida Institute of Food and
Agricultural Sciences. Retrieved from http://edis.ifas.ufl.edu/fe669
Nerlove, M., and W. Addison. 1958. “Statistical estimation of long-run elasticities of supply and demand.” Journal of Farm Economics40(4), 861-880.
Reed, A. J., H. Elitzak, and M. K. Wohlgenant. 2002. Retail-farm price margins and consumer product diversity. U.S. Department of Agriculture, [electronic report], Technical Bulletin. TB1899
Rickard, B. J., and L. Lei. 2011. “How important are tariffs and nontariff barriers in international markets for fresh fruit?” Agricultural Economics42(s1), 19-32.
Richards, T. J., and P. M. Patterson. 2000. “New Varieties and the Returns to Commodity Fuji Apples.” Agricultural and Resource Economics Review29, 10-23.
Romer, P. 1990. Are nonconvexities important for understanding growth? (No. w3271). National Bureau of Economic Research.
Ruttan, V. W., and Y. Hayami. 1984. “Toward a theory of induced institutional innovation.” The Journal of Development Studies20(4), 203-223.
Schultz, T. W. 1964. Transforming traditional agriculture. New Haven: Yale Univ. Pr. Schut, M., L. Klerkx, M. Sartas, D. Lamers, M. Mc Campbell, I. Ogbonna, K. Pawandeep,
K. Atta-krah, and C. Leeuwis. 2016. “Innovation platforms: experiences with their institutional embedding in agricultural research for development.” Experimental Agriculture52(4), 537-561.
Sijmonsma, A. 2016, Sep. 3. “Mixed outlook for China’s apple export.” Retrieved from
Fresh Plaza:
http://www.freshplaza.com/article/154724/Mixed-outlook-for-Chinas-apple-export Stewart, H., J. Hyman, J. C. Buzby, E. Frazao, and A. Carlson. 2011. “How Much Do
Fruits and Vegetables Cost?” Economic Information Bulletin No. (EIB-71) 37 pp, February
Sumner, D. A., H. Leeand, and D. G. Hallstrom. 1999. “Implications of trade reform for agricultural markets in northeast Asia: A Korean example.” Agricultural Economics21(3), 309-322.