Analysis Guideline Revision Working Group
Hitachi Group
March 2018
Contents
1 Objective ... 2
1.1 Main purpose of revision ... 2
1.2 Scope of application ... 3
2 Abbreviations ... 3
3 Outline of the RoHS Directive ... 5
3.1 History of existing law and revision ... 5
3.2 Interpretation of homogeneous material ... 6
4 Analytical method and basic flow of analysis ... 7
4.1 Principle of analytical instruments ... 7
4.2 Flow of analytical procedure ... 21
4.3 Sampling ... 23
5 Analytical method ... 25
5.1 Screening analysis by X-ray fluorescence spectrometry ... 25
5.2 Cadmium, lead, chrome and their compounds ... 27
5.3 Mercury and its compounds ... 31
5.4 Hexavalent chromium and its compounds ... 32
5.5 Specific brominated compounds (PBBs and PBDEs) ... 37
Analysis guideline for the RoHS Directive Ver. 4.0
1 Objective
1.1 Main Purpose of Revision
In response to the European RoHS Directive (2002/95/EC) published in January 2003 banning the use of the electric and electronic equipment containing the specific hazardous substances, the Environment Division (Current the CSR and Environmental Strategy Division) of Hitachi prepared the first version of this guideline in April, 2004 to indicate to Hitachi Group companies the analytical method that complies with the RoHS Directive. At the stage of 2004, there was no official method to check the compliance with the RoHS Directive. Therefore, individual business divisions and associated companies referred to this guideline for the analytical method and interpretation and, established the control system of their own in cooperation with their partners and customers.
Under such situation, IEC contemplated, during 2005 - 2008 in its IEC/TC111/WG3 (Test Methods), the standardization of the analytical procedures of the specific hazardous substances contained in the electric and electronic equipment, and produced IEC62321 in December, 2008 by integrating the results. As the standard of the official method was established, the analytical guideline of Hitachi group clarified the conformity of IEC62321 in terms of the measurement procedure, and the content of the guideline was expanded to become useful as operating guidelines by incorporating the basic descriptions of analysis methods and an introduction to typical practices of the leading divisions, which resulted in the revision of the guideline as the second version in November 2010.
Later in June 2011, the RoHS Directive in Europe was revised into the Directive 2011/65/EU, with additional category 8 (medical equipment) and category 9 (monitoring and control equipment), which had previously been out of the scope, now being regulated. And with the other electrical and electronic equipment not falling under categories 1 to 10 being newly established as category 11, all electrical and electronic equipments are now, as a rule, within the scope. In addition, preparation and storage of declaration of conformity for CE markings and technical documents were made obligatory. For restricted substances subject to the RoHS Directive (hereinafter referred to as "restricted substances"), Directive (EU) 2015/863, which revises Annex II of Directive 2011/65/EU, was issued in June 2015 to add four phthalic acid esters as restricted substances. Additions are expected to be made regularly in the future.
On the other hand, with the revision made in May 2013, it has been decided to issue IEC62321 as divided into abstract, sampling, screening, detailed analysis method, or as classified by substance, along with incorporating PAS62596—a sampling guideline. The analysis methods for restricted substances likely to be added will also be issued.
technically necessary matters. Therefore, it is expected to utilize this new guideline for reducing the specific hazardous substances contained in the electronic equipment and to contribute to the environmental protection and improvement as well as to the health protection of the users by preventing the contamination due to the specific hazardous substances.
1.2 Scope of application
This guideline stipulates the analytical method to measure the content of the specific chemical substances contained in the constituents of the electric and electronic equipment, and applies to the products and their constituents regulated under the RoHS Directive.
The content measured by this guideline can be used, for example, for the determination of the threshold value stipulated in the RoHS Directive.
Note: The international standard corresponding to this guideline and the abbreviations to show the extent of compliance are indicated below:
IEC62321 Ed. 1.0: 2008 (b), Electrotechnical products — Determination of levels of six regulated substances (lead, mercury, cadmium, hexavalent chromium, polybrominated biphenyls, polybrominated diphenyl ethers) (MOD)
The sign to denote the extent of compliance (MOD) shows the correction as per ISO/IEC Guide 21.
2 Abbreviations
AAS Atomic Absorption Spectrometry ABS Acrylonitrile Butadiene Styrene AFS Atomic Fluorescence Spectrometry
APCI Atmospheric Pressure Chemical Ionization ASTM American Society for Testing and Materials
BL Below Limit
CCS Calibration Check Standard CI Chemical Ionization
CRM Certified Reference Material
CV-AAS Cold Vapor Atomic Absorption Spectrometry CV-AFS Cold Vapour Atomic Fluorescence Spectrometry DecaBDE Decabrominated Diphenyl Ether
DI De-ionized (water)
EN European Norm
EPA Environmental Protection Agency
FEP Fluorinated Ethylene Propylene Copolymer FP Fundamental Parameter
FRU Field Replaceable Unit
GC-MS Gas Chromatography-Mass Spectrometry GLP Good Laboratory Practice
HDPE High-Density Polyethylene
HPLC-UV High-Performance Liquid Chromatography-Ultra Violet HIPS High-Impact Polystyrene
IAMS Ion Attachment Mass Spectrometry IC Integrated Circuit
IC Ion Chromatography
ICP Inductively Coupled Plasma
ICP-MS Inductively Coupled Plasma Mass Spectrometry
ICP-OES Inductively Coupled Plasma-Optical Emission Spectrometry IEC International Electrotechnical Commission
IEC/TC111/WG3 (Test Methods)
TC111 is a technical committee for compiling basic environmental and cross-product standards, technical reports, and other necessary guidelines in close collaboration with the various technical committees of IEC. WG3 is a working group that considers how to measure chemicals and other substances in electrical and electronics equipment.
IS Internal Standard
JIS Japanese Industrial Standard LLOD Low Limits of Detection LOD Limits of Detection MDL Method Detection Limit
NMIJ National Metrology Institute of Japan NMP N-Methylpyrrolidone
OctaBB Octabromo Biphenyl OctaBDE Octabromo Diphenyl Ether
OL Over Limit
PBB Polybrominated Biphenyl PBDE Polybrominated Diphenyl Ether
PC Polycarbonate
PCB Polychlorinated Biphenyl PCT Polychlorinated Terphenyl PCN Polychlorinated Naphthalene
PFA Perfluoro Alkoxy PFK Perfluoro Kerosene PFTBA Perfluoro Tributyl Amine PTFE Polytetrafluoroethylene
PTV Programmable Temperature Vaporization injector PVC Polyvinyl Chloride
Py-TD-GC-MS Thermal Decomposition/Desorption Gas Chromatography Mass Spectrometry (Equipment)
Note: In this guideline, because measurements are performed without thermal
desorption of analysis samples, the term “Thermal Desorption Gas Chromatography Mass Spectometry (Equipment)” is used across the board.
PWB Printed Wiring Board
QA Quality Assurance
QC Quality Control
SIM Selected Ion Monitoring
TD(G)-AAS Thermal Decomposition - Gold amalgamation - Atomic Absorption Spectrometry TD-MS Thermal Desorption Mass Spectrometry
THF Tetrahydrofuran
WDXRF Wavelength Dispersive X-ray Fluorescence XRF X-ray Fluorescence
3 Outline of RoHS Directive
3.1 History of exiting law and revision
In Europe, by enforcement of the RoHS Directive promulgated in February 2003 (Directive 2002/95/EC), the restriction on the use of designated hazardous substances included in electrical and electronic equipments (EEE) came into force in July 2006. Later, the largely revised version (Directive 2011/65/EU) was promulgated in July 2011 and has been virtually enforced since January 2013 (the deadline for member countries to establish related domestic laws).
(The first edition is called RoHS1 and revised one is called RoHS2.)
At the beginning of enforcing the restriction, however, there were six types of regulated substances: lead, mercury, cadmium, hexavalent chromium, polybrominated biphenyls (PBBs), and polybrominated diphenyl ethers (PBDEs). Then it was decided to add four phthalic acid esters from July 2019. The authorities are considering placing the restriction on even more substances.
Also note that this directive allows for the exemption of items that technically cannot be prohibited. However, whether to continue applying such exemption is regularly deliberated in Europe, so that along with technical advances, there are cases that are subject to the regulation newly as a result of the elimination of exemptions.
There are also cases, such as the four phthalic acid esters, where the possibility of permitting exemption is very low from the first, because such substances must be approved under the European REACH regulation.
Furthermore, there is movement to apply the similar law that was almost copied from this directive in foreign countries newly, and the case to deal with a similar regulation is increasing in the country of not only Europe but also other areas.
3.2 Interpretation of homogeneous material
3.2.1 Definition of denominator and numerator of the mass of contained chemical substances
3.2.1.1 Definition of denominator for measuring the mass of chemical substances
The denominator should be the mass of homogeneous material (same material), and please see the table below for the composite materials.
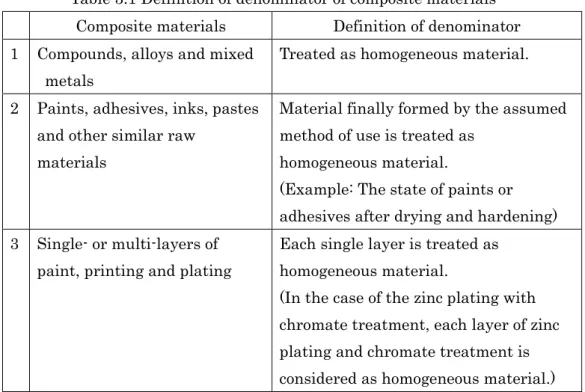
Table 3.1 Definition of denominator of composite materials Composite materials Definition of denominator 1 Compounds, alloys and mixed
metals
Treated as homogeneous material.
2 Paints, adhesives, inks, pastes and other similar raw
materials
Material finally formed by the assumed method of use is treated as
homogeneous material.
(Example: The state of paints or adhesives after drying and hardening) 3 Single- or multi-layers of
paint, printing and plating
Each single layer is treated as homogeneous material.
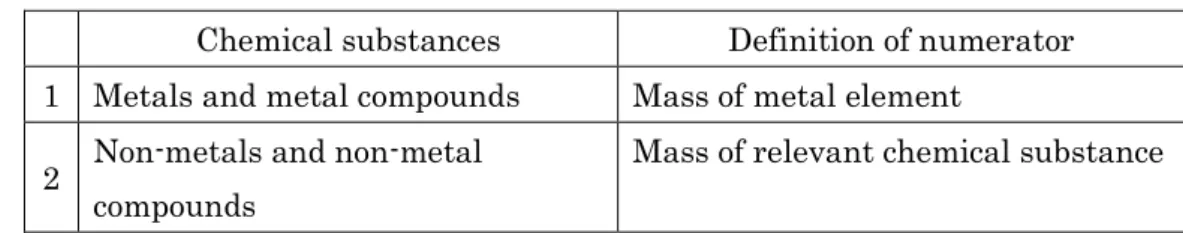
3.2.1.2 Definition of numerator for measuring the mass of chemical substances
Table 3.2 Definition of numerator of chemical substances Chemical substances Definition of numerator 1 Metals and metal compounds Mass of metal element 2 Non-metals and non-metal
compounds
Mass of relevant chemical substance
4 Analytical method and basic flow of analysis 4.1 Principle of analytical instruments
4.1.1 X-ray fluorescence spectrometer (Figs. 4.2 and 4.4)
X-ray fluorescence spectrometers can measure hazardous elements contained in resins and metals (cadmium, lead, chromium, mercury, and bromine) with relative ease.
- What is X-ray fluorescence (XRF)?
Irradiating an X-ray (also known as the primary X-ray or characteristic X) into an atom (element) drives electrons out of the inner shell orbit, thereby producing an empty orbit, and electrons from the outer shell orbit with a higher energy level begin falling. At that time the X-ray corresponding to the difference in energy between both orbits is released. This is called the fluorescent X-ray [a kind of characteristic X-ray]. (Fig. 4.1.)
This fluorescent X-ray has a characteristic value (wavelength and intensity) for each element, and the method of measuring these values to determine the quality and quantity of a specific substance (element) is called X-ray fluorescence spectrometry.
Fig. 4.1 Generation of X-ray fluorescence
X-ray fluorescence spectrometers come in two categories: Energy Dispersive X-ray Fluorescence (EDXRF) and Wavelength Dispersive X-ray Fluorescence (WDXRF), depending on differences in the detector and detection method. The size-reducible ED XRF (Figs. 4.2 and 4.3) is generally used.
X-ray fluorescence
Atomic nucleus
Primary X-rays
Hitachi High-Tech Science EA1000VX Fig. 4.3 Conceptual drawing of X-ray Fig. 4.2 X-ray fluorescence spectrometer fluorescence spectrometer
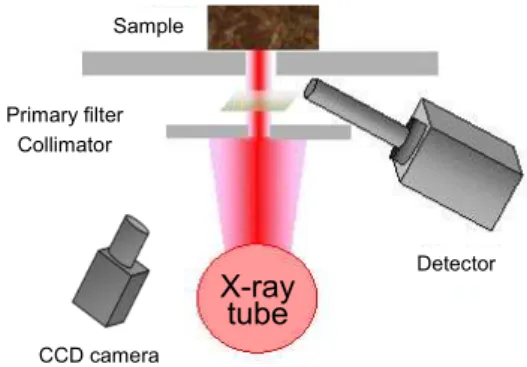
One way to screen constituent elements efficiently is to take in an image of the measured portion of the particular sample while conducting fluorescent X-ray analysis and
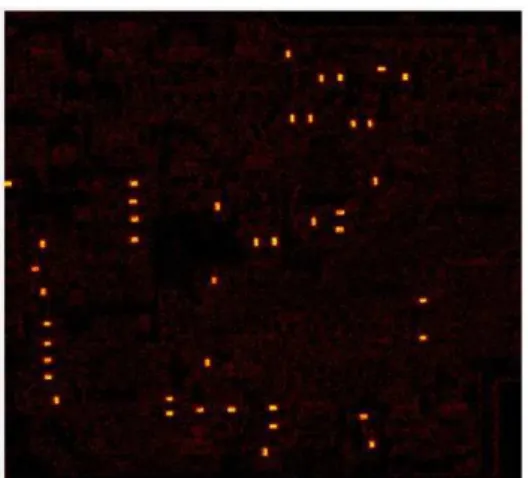
scanning, and then obtain information about the distribution of elements on the measured surface. Figs. 4.5 to 4.7 show some of the measurements taken. Surface information provides details about the distribution of many chemical substances. Comparing that distribution information with the image obtained allows you to confirm the presence of any restricted substances. And because this method identifies the part in question, it facilitates judgment on whether the part can be excluded. Such information is made available from energy-dispersive X-ray fluorescence (EDXRF) equipped with element mapping.
Hitachi High-Tech Science EA6000VX
Fig. 4.4 X-ray fluorescence spectrometer Fig. 4.5 Specimen image capable of element mapping
Sample
X-ray tube Primary filter
Collimator
CCD camera
Detector Sample
Fig. 4.6 Lead element mapping Fig. 4.7 Bromine element mapping
4.1.2 Atomic absorption spectrometer
Fig. 4.8 Principle of atomic absorption spectrometer
The atomic absorption is a phenomenon that shows the narrow absorption spectrum width inherent to the element when the light is irradiated to the atom.
The Atomic Absorption Spectrometry (AAS) is a method to make the quantitative determination of the element in the sample by atomizing the liquid sample with the heat at high temperature (in most of the cases, in the flame of acetylene and air or in the electrically heated graphite furnace) and by measuring the atomic absorption spectrum of the light transmitted from the sample. As this analytical method indicates a high reliability to some particular elements, it is employed as the official method for the analysis of the inorganic materials in many fields like the measurement of the regulation value of the hazardous metal elements contained in the industrial effluents.
Since the spectrum width of the AAS is extremely narrow, it is compulsory to select, as the light source, the hollow cathode lamp to emit the light length having the absorption
Spectral section
Detector Light source
Sample
Atomization Section Flame method Furnace method
Y axis movement of sample stage
CCD camera
X-ray tube
Vacuum Sample observation light
path
10 μm X-ray beam
X-ray fluorescence detector
X-ray fluorescence
X axis movement of sample stage
Atmosphere
Transmitted X-rays Transmitted X-ray
characteristic to the target element. Therefore, a same number of lamps as the elements to be measured must be prepared while those lamps must show high selectivity to specific elements. There is a composite type of hollow cathode lamp that emits the light in the absorption wavelengths of plural elements.
Changes in the lamp over time and spectral interference between coexistent substances other than the target elements entering the sample are avoided by background correction. Sensitivity is higher in the furnace method (Fig. 4.11) based on a graphite furnace than in the flame method (Fig. 4.10) based on a combustion flame.
Hitachi High-Tech Science ZA3000 Fig. 4.10 Flame method Fig. 4.11 Furnace method Fig. 4.9 Atomic absorption spectrometer
4.1.3 ICP emission spectrometer (Fig. 4.13)
Fig. 4.12 Principle of ICP emission spectrometer
ICP stands for "Inductively Coupled Plasma" and refers to plasma generated by a high-frequency electromagnetic field. An overview of its mechanism is described below. When high-frequency current is applied to the high-frequency coil around the quartz plasma torch tube shown in Fig. 4.12, electromagnetic induction generates a high-frequency electromagnetic field in the torch tube. This field intensifies the motion of electrons in the torch tube, and argon gas introduced into the tube collides with the activated electrons and
Ar gas
High-frequency wave coil
Quartz torch
Atomization section (nebulizer)
Sample
ionizes into an argon ion and an electron, thereby generating plasma. Then, the electrons ionized from the argon similarly ionize other argon gas, thereby causing a chain that maintains high-temperature plasma generation status in the torch tube. The ICP used as the light source of the emission spectroscopy is the high temperature plasma source of doughnut shape that is kept lighted stably by ionizing the argon gas which is led through the triple-tube structured quartz glass tube wound with the coil around its outer surface. In ICP optical emission spectrometry (ICP-OES), the liquid sample is generally fed to the ICP by sucking it by pump or by natural suction and atomizing it with the nebulizer. The introduced sample undergoes the thermal decomposition by absorbing the thermal energy and becomes atomized, excited or ionized for the most part. The light emitted when the atom and electron of ion returns from the excited state to the ground state is the emission inherent to the element contained in the sample (Fig. 4.14), and it is separated into individual wavelengths by the spectral section and detected by the detector.
As the ICP emission spectrometry is characterized by the optical emission of a number of simultaneously atomized or excited elements in the sample, it can be used, unlike the atomic absorption method, for analyzing many types of elements at one time or continuously and for the qualitative analysis purpose. Though this method is inferior to the atomic absorption of the furnace method in terms of the sensitivity, it is quite useful for a wide range of application in the qualitative analysis.
4.1.4 ICP mass spectrometer (Fig. 4.16)
Fig. 4.15 Principle of ICP mass spectrometer
In the ICP mass spectrometry (ICP-MS), the liquid sample is fed to the ICP by sucking it by pump or by natural suction and atomizing it with the nebulizer as in the ICP emission spectrometry. The introduced sample undergoes thermal decomposition by absorbing the thermal energy and becomes atomized, excited or ionized for the most part. The element ion produced in the plasma under atmospheric pressure led to the vacuum chamber through the minute pores (normally two types consisting of the sample cone and the skimmer cone) called the interface. The ions converge after passing through the ion lens under vacuum, get separated in the mass spectroscopy section and enter into the detector.
Hitachi High-Tech Science Spectro MS (manufactured by Spectro) Fig. 4.16 DCD simultaneous ICP mass spectrometer
The quadruple electrode is widely used as the mass spectroscopy section of the ICP mass spectroscopy, and double conversion type is chosen for the high performance application. Double-conversion types come in two types: high-resolution type and multi-element
Ar gas
Sample
Atomization section (nebulizer)
Quartz torch
High-frequency wave coil Mass spectrometric section
Interface section
Ion lens section
Ion introducing section
simultaneous analysis type. ICP mass spectroscopy can analyze the quality and quantity of several kinds of elements at a time, and also offers isotope analysis capability and other excellent features. Highly sensitive, this method has detection limits two or three digits lower than those of atomic absorption spectrometry (see 4.1.2) and ICP emission spectrometry (see 4.1.3), and can exhibit its full performance in fields of very small trace analysis.
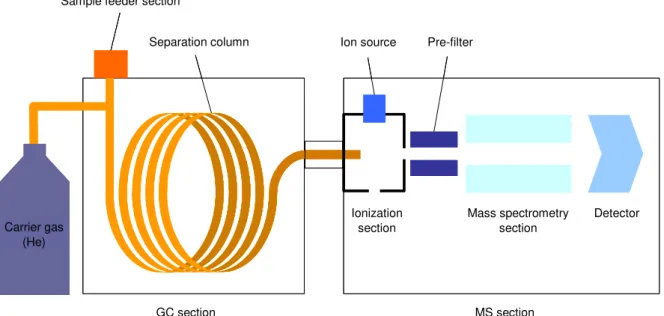
4.1.5 Gas chromatograph/Mass spectrometer (Fig. 4.18)
Fig. 4.17 Principle of gas chromatograph/mass spectrometer
Gas chromatograph/Mass spectrometer (GC-MS) is an equipment used mainly for the qualitative and quantitative analysis of the organic compounds.
As shown in Fig. 4.17, the mixed components of the sample are separated at the gas chromatograph (GC) section, and then the separated components are ionized, and subjected to mass spectroscopy (MS) to obtain the MS spectrum. In this way, the qualitative analysis is made for each component and the quantitative analysis is made by measuring the ion intensity. For the analysis of the brominated flame retardants, the detection is possible up to the level of ppm to ppb.
a) Sample feeder section
It becomes possible to feed any sample in the state of gas, liquid and solid by the combination with the various types of pretreatment equipment including the auto-sampler and the thermal decomposition equipment. Since the feeder section is also equipped with the functions like the split/splitless and the temperature programming, it is applicable to wide varieties in combination with the pretreatment equipment.
b) Separation column
As shown in Fig. 4.19, this is roughly divided into packed columns and capillary columns. Capillary columns chemically combined the fixed phase of polydimethyl siloxane,
GC部 MS部
試料注入部
分離用
ン化部 質量分離部 検出器
ン源 プ フ タ
ャ ス
(He)
GC部 MS部
試料注入部
分離用
ン化部 質量分離部 検出器
ン源 プ フ タ
ャ ス
(He)
Sample feeder section
Separation column Ion source Pre-filter
Ionization section
Mass spectrometry section
Detector Carrier gas
(He)
polyethylene glycol, or other substance with the inside of a capillary tube 0.25 to 0.53 mm in inner diameter are mainly used. In GC-MS spectroscopy, capillary columns with higher resolution, smaller inner diameter, longer length, and capable of little-background trace analysis are commonly used.
c) Ionization section
It is one way to use the Electron Ionization (EI) to ionize the sample molecule by bombarding the thermal electron released from the heated filament, and another way is the Chemical Ionization (CI) to ionize the sample molecule by the action of electric charge exchange between the sample and methane gas ionized in advance by the method like EI. The EI method is widely used for GC-MS and the technique of the “target material search” using the data base available in the market is frequently used as the fragment information of the sample can be readily obtained.
d) Mass spectrometry section
The quadruple (Q) type is most popular which transmits only the target ions by sending the ions through the 4 pieces of electrodes and applying the high frequency voltage to the electrodes. Its advantages are low price, high speed scanning and wide range of quantitative determination.
The Ion Trap (IT) type, which retains the ion in the trap chamber enclosed by the electrodes and enables to obtain the spectrometry by the selective release of the ion through the change of the electric potential, has the high resolution and is capable of the detailed structural analysis based on the MS/MS technique to split the ions and analyze the fragments thus produced.
There are also other types such as the high- sensitivity, high resolution triple Q type, Time of Flight (TOF) type and double convergence type.
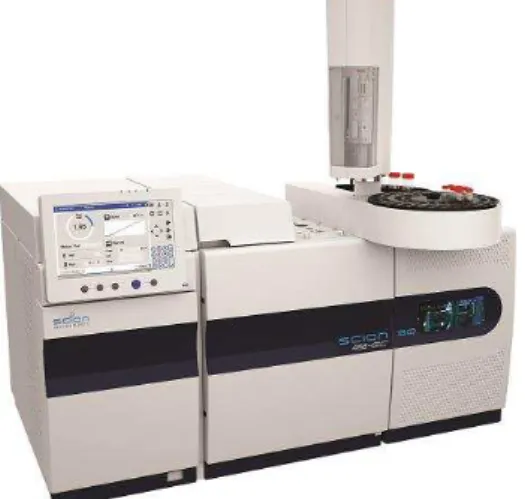
Hitachi High-Tech Science SCION SQ 456GC Fig. 4.19 Packed column and
(Made by SCION) capillary column
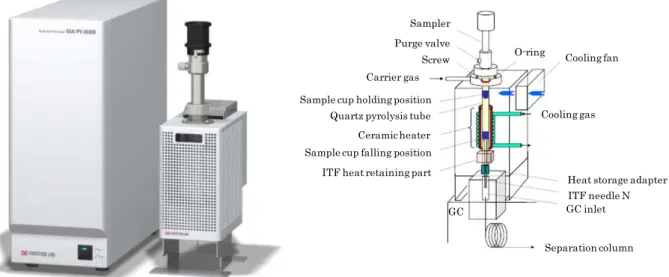
4.1.6 Thermal Desorption Gas Chromatography Mass Spectrometry Equipment (Fig. 4.20)
Thermal Desorption Gas Chromatography Mass Spectrometry equipment (Py-TD-GC-MS) connects a heating device (pyrolyzer) to the sample injection part of the GC-MS as a pre-treatment device, which leads volatilized organic compound to GC-MS by heating a solid sample, and can identify ingredients and carry out semi-quantitative analysis.
Frontier Laboratories Ltd. Multi-shot Pyrolyzer EGA/PY-3030D
Fig. 4.20 Example of heating equipment (pyrolyzer)
4.1.7 Ion Attachment Mass Spectrometry (Fig. 4.21)
Ion Attachment Mass Spectrometry (IAMS) is an equipment configuration without gas chromatograph, which is a part separated from Py-TD-GC-MS, and can measure samples easily without special pretreatment, like the Py-TD-GC-MS, as well as being able to shorten measurement time remarkably in comparison with the Py-TD-GC-MS.
However, the mass peak of the admixture composition overlaps with the target composition when an isomer or an admixture composition with the same molecular weight as the target composition exists in the measurement sample. In order to accurately determine the quantity of the target composition, it is necessary to take into account the need to subtract the admixture composition from this peak strength, etc.
IAMS equipment is a kind of mass spectrometer with ion attachment source, consisting of Li+ attachment reaction chambers having Li+ emitters. Furthermore, it is coupled with a
direct injection probe (DIP) that has a program heating function up to 350 ℃. The heat desorption sample molecule (M) forms an additive with Li+ (M+Li+) in the reaction
chambers, and these additives are measured by means of a mass spectrometer via selective ion monitoring.
Cooling fan
Cooling gas
ITF needle N GC inlet
Separation column O-ring
Sampler
Purge valve Screw Carrier gas
Ceramic heater
ITF heat retaining part Sample cup falling position
Heat storage adapter
Source: IEC62321-8:2017 Appendix E Fig. 4.21 Example of IAMS equipment
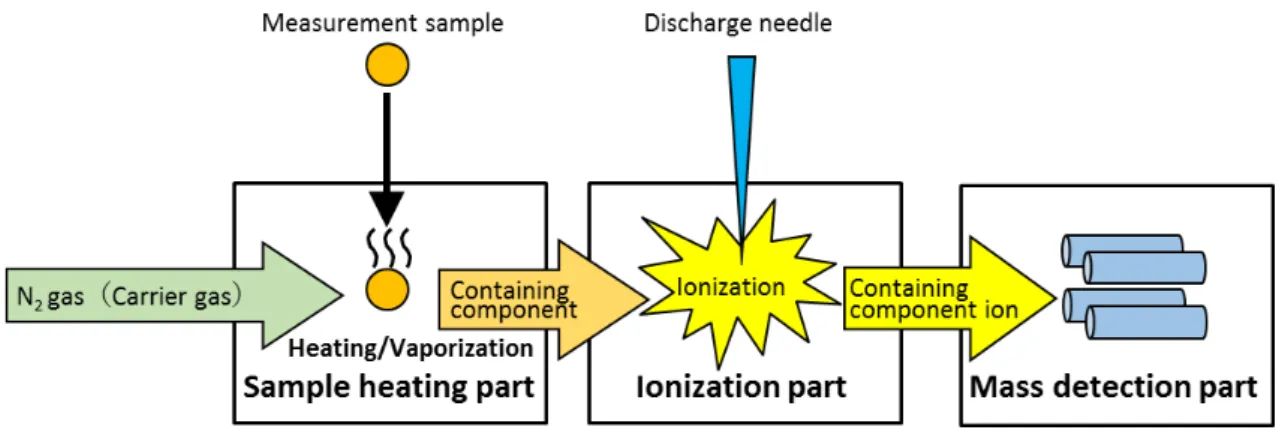
4.1.8 Thermal Desorption Mass Spectrometry (Fig. 4.23)
Thermal Desorption Mass Spectrometry (TD-MS) is also an equipment configuration without gas chromatograph, which is a part separated from Py-TD-GC-MS, and can measure samples easily without special pretreatment, like the Py-TD-GC-MS, as well as being able to shorten measurement time remarkably in comparison with the Py-TD-GC-MS. However, the mass peak of the admixture composition overlaps with the target composition when an isomer or an admixture composition with the same molecular weight as the target composition exists in the measurement sample. In order to accurately determine the quantity of the target composition, it is necessary to take into account the need to subtract the admixture composition from this peak strength, etc.
Like IAMS, the TD-MS equipment configuration consisits of (1) a sample heating part, (2) an ionization part, and (3) a mass spectrometry part, but unlike IAMS, it adopts the atmospheric pressure chemical ionization method (APCI) in its ionization part, which
Side view
view
Front view
vi
ew
IR lamp for sample heating
Planchet
Direct Injection Probe(DIP)
ン化
ち
ゃんば
chamber
Dry air
TMP
Split flow
e
-0.1Pa 10-4Pa EI
source
Li+
source
源
げ
源
sourc
e
Quadrupole
Rotary pump Ionizing chamber 50Pa
makes it possible to obtain molecular ions with added protons (H+) like the ion adhesion
method.
Fig. 4.22 Equipment component figure of TD-MS
Hitachi High-Tech Science HM1000
4.1.9 Liquid chromatograph (Fig. 4.25)
Fig. 4.24 Liquid chromatograph
The chromatography is a technique to separate the components in the sample by using the column filled with the fine packing materials as shown in Fig. 4.24. It requires the mobile phase to allow the sample to migrate and the stationary phase (column) to serve as the place of separation.
A sample is sent from the mobile phase to the stationary phase. The elution speed is slow when the affinity of the component is high for the stationary phase, and rapid when the affinity is low. The components in the sample can be separated based on the difference of the property of individual components against the stationary phase. The components that eluted from the stationary phase are detected by the detector and recorded as the chromatogram.
Under certain specified conditions, the same component has the same elution time. Therefore, by comparing the elution time of the control sample with that of the component in the sample and if the elution time coincides, the test sample is judged to be the same as the control. As the concentration of the component is proportional to the area of the peak, the quantitative determination can be done by preparing the calibration curve using the control sample.
There are two types of chromatograph. One is the “Gas Chromatograph” to use gas as the mobile phase (see 4.1.5) and the other is the “Liquid Chromatograph” to use liquid.
Petroleum ether
Liquid plant extract
Glass tube
Calcium carbonate
Coloring matter A
Coloring matter B
Coloring matter C
Separation of coloring matter of plant by chromatography
When the petroleum ether is circulated by adding the liquid extract of the leaf to the upper part of the glass tube packed with calcium carbonate, the coloring matter contained in the liquid extract was separated over time. This phenomenon was nominated as “chromatography” after the wordings of “chroma (color)” and “graphos (draw)” by the Russian botanist, Mr. Tswett.
Sample Mobile phase Pump Column oven Column Auto-sampler Data processing Time Detector
Unit flow diagram
The liquid chromatograph consists of the following modules (Fig. 4.24):
- Pump: Sends the mobile phase. It is important to keep a certain flow rate without pressure fluctuation.
- Sampler: A sample is fed into the flow path.
There are options of Manual and Automatic.
- Column oven: Column is kept at constant temperature to prevent the elution time error.
- Detector: Detects the component that eluted from the column and converts it to the electric signal.
- Data processing: Receives the detector signal, performs the quantitative calculation and prepares the report.
The “Ion Chromatograph” is a kind of liquid chromatograph used mainly for the separation of the inorganic ions, and it uses the column packed with the ion exchange resins for the ion separation and the electric conductivity detector for the detection and the quantitative determination.
4.1.10 Spectrophotometer (Fig. 4.27)
Fig. 4.26 shows the photometric principle of spectrophotometers. Typical
spectrophotometers incorporate a deuterium discharge lamp (in the ultraviolet region) and a halogen lamp (in the visible region) as light sources. Either one of these lamps is used depending on the wavelength applied. In recent years, spectrophotometers based on xenon flash lamps used as longer-lasting light sources are commercially available. Xenon flash lamps are advantageous in terms of lasting longer than halogen lamps and
deuterium discharge lamps, and enabling measurement with a single lamp in both the ultraviolet and visible regions.
The basic principle of measurement is as follows: Light with an applicable wavelength is spectrally dispersed from a light source into monochrome light with a diffraction grating, and then enters a sample (with an incident angle intensity of 10). The sample is put into a cell and installed on the device. The intensity (I) of light transmitted through the sample is then detected with a photomultiplier tube, silicon photodiode, or other detector. Spectrophotometers can convert this intensity into a transmittance or absorbance and display it. In general, transmittance is used in measuring solid samples and absorbance is used in measuring solution samples. Transmittance (%T) is calculated with Equation 1 by using IO and I. Equation 2 is known as Bouguer's law or Lambert's law, indicating
absorbance A and sample concentration c.
%T I / I0 × 100 ・・・ Equation 1 A log10 I0 / I εc l ・ ・・ Equation 2
Fig. 4.26 Overview and photometric principle of spectrophotometers
Hitachi High-Tech Science Double-beam spectrophotometer
UH5300
Fig. 4.27 Spectrophotometer Diffraction
grating
XeF light source
Half mirror
Reference cell
Sample cell
Reference detector
4.2 Flow of analytical procedure
Fig. 4.28 shows the flow of the analytical procedure to determine the concentration of the hazardous substances in the electric and electronic equipment.
Fig. 4.28 Flow chart of analytical procedure
(Source: IEC62321:2008) Sample
Mechanical sample preparation
Non-destructive sample preparation
Sample complies with Standard Sample does not
comply with Standard Mechanical sample
preparation
Detail analysis
Sample complies with Standard Sample does not
comply with Standard
Yes
Yes No
Failure
OK
No Yes
OK Failure
No
Is screening to be done?
Is sample homogeneous?
Within allowable limits Screening analysis
Perform detail analysis Within
According to the procedure of the screening analysis, it is necessary to choose either to subject the sample to the measurement without changing its condition (Non-destructive sample preparation) or to the measurement by destroying and homogenizing it (Mechanical sample preparation). The judgment of which method to use should be made by considering the material type, size and shape of the sample.
In carrying out the screening analysis, either Energy Dispersive X-ray Fluorescence (EDXRF) or Wavelength Dispersive X-ray Fluorescence (WDXRF) is employed. The procedure of the screening analysis must be implemented under controlled conditions. It is necessary to determine the tolerance values for each sample to be analyzed considering the influence of the sample shape and its material type on the variation of the analysis accuracy. The details on the analysis procedure are shown in Table 4.1.
Table 4.1 Outline of details on analysis procedure
Steps Substances Polymers Metals Electronic
components (PWB/Constituents) Mechanical sample preparation Direct measurement Pulverization Direct measurement Pulverization Direct measurement Pulverization Chemical sample preparation Microwave decomposition Acid decomposition Dry ashing Solvent extraction Microwave decomposition Acid decomposition Microwave decomposition Acid decomposition Solvent extraction Analytical method
PBB, PBDE GC-MS Not applicable GC-MS
Cr (VI) Alkali
decomposition / colorimetry
Spot test / hot water extraction
Alkali
decomposition / colorimetry Hg CV-AAS, ICP-MS, ICP-OES, CV-AFS
Pb, Cd AAS, ICP-OES, ICP-MS,
4.3 Sampling
4.3.1 Sampling procedure
The sampling should be done by referring to IEC62321-2/Ed.1:2013.
Before carrying out the sampling, it is necessary, at first, to decide the analysis investigation policy by collecting the maximum possible information as indicated in “4.4 Strategy relating to Sampling” of IEC62321-2/Ed.1:2013.
Fig. 4.29 shows the general procedure applicable to most of the cases:
Fig. 4.29 General replication standard for sampling
(Source: IEC62321-2/Ed.1:2013) The information’s to be collected are:
a) The combination of the products / components / assemblies and the practicability of sampling and analysis at the homogeneous level of the material.
b) Information on restricted materials and allowable values. c) If exception items exist or not?
d) If the basic information’s exist or not on the items like the table of material list including the constituents of the product / assemblies / materials?
e) If the declaration of the product material is necessary or not? f) The evaluation records of the product or its similar product.
Products / components / assemblies
Decision of strategy
Is the present form of evaluation
possible?
Sampling / disassembly / decomposition
Is the result satisfactory for the
purpose? Evaluation
Completion Purpose of test
Information/ history
No
Yes Yes
g) Information on the foreign materials existing in the component. h) The history of the screening analysis.
i) Process control record at the supplier on the constituents and materials.
j) If there is any concern about the history at the supplier on the constituents and materials.
On the basis of such information, the scope and the frequency of sampling should be decided.
In regard with the replication standard shown in Fig. 4.29, the following steps should be taken on a timely basis. It is necessary to conduct the analytical work stepwise and make an efficient investigation by referring to 5.3 to 5.6 (Reference: “5.3 Partial disassembly” of IEC62321-2/Ed.1:2013).
4.3.2 Consideration items on sampling and disassembly
(Reference: “5.7 Consideration items on sampling and disassembly” of IEC62321-2/Ed.1:2013)
4.3.2.1 Necessary sample size (see 5.7.2 of IEC62321-2/Ed.1:2013)
The minimum sample amount defined in the IEC62321 series is described below: a) Analysis by XRF
Thickness, in the range of mm (Changes with instrument and shape) b) Mercury
0.5g (If the lower detection limit is < 5mg/kg) c) Lead and Cadmium (Simultaneous measurement)
0.5g (If the lower detection limit is < 50mg/kg) 1g (If the lower detection limit is < 5mg/kg) d) PBB, PBDE
100mg (If the lower detection limit for the same element group is < 100mg/kg) e) Hexavalent chromium
1) For polymer materials & electronic equipment:
0.1 - 0.15 g (If the lower detection limit is < 15mg/kg) 2) For chromium coated metals:
50cm2 (If the lower detection limit is < 0.02mg/kg)
f) Phthalate esters
0.2 - 0.5mg (in the case of screening analysis)
4.3.2.2 Non-uniform “homogeneous material” (see 5.7.5 of IEC62321-2/Ed.1:2013)
Namely, it becomes necessary to work out a scheme like establishing the control standard based on the designed values and implementing the control of such standard values at the factory.
5. Analytical method
5.1 Screening analysis by X-ray fluorescence spectrometry
The screening analysis by X-ray fluorescence spectrometry must be performed in accordance with IEC62321-3-1/Ed.1:2013.
By making the screening analysis by the X-ray fluorescence spectrometry for the homogeneous material pretreated in some way like the slicing of the sample, the presence and the approximate quantity of five elements, i.e. Pb, Hg, Cd, total Cr and total Br are investigated.
a) Scope of application
Polymer materials, metal materials, and ceramic materials b) Analyzing equipment
- Energy Dispersive X-ray Fluorescence (EDXRF) - Wavelength Dispersive X-ray Fluorescence (WDXRF) c) Pretreatment
Non-destructive approach or destructive approach must be chosen appropriately depending on the sample.
For example, if the sample surface is plated or coated, the plating or coated layer must be removed so that the exposed base material can be measured (destructive approach). d) Analytical method
The optimal conditions depend upon the equipment to be used. Therefore, the analysis should be performed by setting to the conditions recommended by the equipment makers or the conditions established by the analysis institutions.
The example conditions recommended for various applications of the X-ray fluorescence are shown in the table below. (Extracted from IEC62321-3-1/Ed.1:2013)
Table5.1 X-ray fluorescence recommended for various analysis applications Applicable components Primary recommended line Secondary recommended line
Lead (Pb) L2-M4 (L 1) L3-M4,5 (L 1,2)
Mercury (Hg) L3-M4,5 (L 1,2) ―
Cadmium (Cd) K-L2,3 (K 1,2) ―
Chromium (Cr) K-L2,3 (K 1,2) ―
Bromine (Br) K-L2,3 (K 1,2) K-M2,3 (K 1,3)
materials and the light alloys like aluminum and 1 mm or more for the other metals. If the thickness is less than the value specified above, the plural pieces of sample must be stacked for the analysis.
The content is calculated by using the calibration curve or the fundamental parameter (FP) method for the obtained results. (Generally the software of the automatic calculation is installed in the analytical equipment.)
Then, after estimating the uncertainty of the result, it is compared with the maximum allowable content of the applicable analysis component of the material.
The table below shows the judgment criteria of screening. (Excerpt from Annex A of IEC62321-3-1/Ed.1:2013)
Table 5.2 Judgment criteria for screening
Element High polymers Metals Composite materials
Cadmium Cd
BL 70-3σ X
130+3σ OL
BL 70-3σ X
130+3σ OL
LOD X
150+3σ OL
Mercury Hg
BL 700-3σ X
1300+3σ OL
BL 700-3σ X
1300+3σ OL
BL 500-3σ X
1500+3σ OL
Lead Pb
BL 700-3σ X
1300+3σ OL
BL 700-3σ X
1300+3σ OL
BL 500-3σ X
1500+3σ OL
Bromine
Br BL 300-3σ X Not applicable BL 250-3σ X
Chrome
Cr BL 700-3σ X BL 700-3σ X BL 500-3σ X
X: Gray zone
BL: Below limit, OL: Over limit LOD: Limit of detection
Note: 3 represents the repetitive accuracy of an analyzer in the management criteria. Here, denotes the standard deviation to be applied in measuring the content of a specific restricted substance near its tolerance level.
[Typical analysis of cadmium in high polymers]
When polyethylene (PE) standard substance (Hitachi High-Tech Science Corporation's cadmium, 100 ppm) is used, 3 of 100 ppm of cadmium in PE was 5 ppm (device EA1000VX, measurement time of 100 seconds, in 10 measurements).
In that case, samples measuring less than 65 (= 70 - 5) ppm were below limit (BL), while those exceeding 135 (130 + 5) ppm were over limit (OL). The samples between 65 ppm and 135 ppm are in the gray zone, and ICP or other detailed analysis is required.
[Typical analysis of cadmium in metals]
of cadmium in brass was 20 ppm (device EA1000VX, measurement time of 100 seconds, in 10 measurements).
In that case, samples measuring less than 50 (= 70 - 20) ppm were below limit (BL), while those exceeding 150 (= 130 + 20) ppm were over limit (OL). The samples between 50 ppm and 150 ppm are in the gray zone, and ICP or other detailed analysis is required.
[Typical analysis of cadmium in composite materials]
For samples with 2% antimony (Sb) and no bromine (Br) content (See Annex A, Table A.1.) The limit of detection (LOD) of Cd in PE is 3 ppm. (Device EA1000VX, measurement time of 100 seconds, in 10 measurements.)
No definitions are given for "below limit (BL)." The limit of detection (LOD) expected due to the matrix effect becomes double the LOD of PE. Therefore, set 3 to 10 (5 x 2) ppm. The samples between 6 ppm and 160 (= 150 + (5 x 2)) ppm are in the gray zone, and ICP or other detailed analysis is required. Those exceeding 160 ppm are over limit (OL).
5.2 Cadmium, lead, chrome and their compounds
The quantitative analysis should be made in accordance with IEC62321-5/Ed.1:2013. The analysis is performed by dissolving the sample in acid, using its solution for measurement with ICP-Optical Emission Spectrometry (ICP-OES), ICP-Mass Spectrometry (ICP-MS) or Atomic Absorption Spectrometry (AAS) and by determining quantity with the use of the calibration curve prepared with the control solution. Chrome in this clause means total chromium and the quantity of hexavalent chromium is determined in accordance with IEC62321-7/Ed.1:2015 and IEC62321:2008.
Note: It is to be noted that, if lead is pretreated with sulfuric acid, its sulfate salt precipitation is produced.
5.2.1 Cadmium, lead, chrome and their compounds in the resin a) Scope of application
The quantitative analysis of cadmium, lead, chrome and their compounds in the resin
b) Analyzing equipment
1) Inductively coupled plasma optical emission spectrometer (ICP-OES) The emission intensity of the target element is measured.
2) Inductively coupled plasma mass spectrometer (ICP-MS)
The mass/electric charge (m/z) and signal intensity of the target element are measured.
3) Atomic absorption spectrometer (AAS)
The absorbance of the target element is measured. c) Pretreatment
The average sample must be collected that represents the site to be measured. The collected sample is sliced and pulverized to the size suitable for the selected analysis method in accordance with the procedure of IEC62321-2/Ed.1:2013. Then, an unbiased sample is taken by means of the quartering method or the like. 2) Preparation of the test solution
It should be prepared in accordance with IEC62321-5/Ed.1:2013. Please refer to the IEC standard for the acid to be used as it varies with the co-existing elements of the sample.
i) Dry ashing method (7.1.2 of IEC62321-5/Ed.1:2013)
Nitric acid or sulfuric acid is added to the sample and it is decomposed by heating. ii) Wet decomposition method (7.1.3 of IEC62321-5/Ed.1:2013)
The sample is decomposed by acids like sulfuric acid, nitric acid, hydrofluoric acid, hydrogen peroxide or phosphoric acid.
This method is not suitable for the quantitative determination of lead as the loss of lead in the sample may take place due to the formation of lead sulfate. iii) Method of acid decomposition in closed system (7.1.4 of IEC62321-5/Ed.1:2013)
The sample, to which nitric acid or hydrogen peroxide solution is added in the decomposition container made of the special fluororesin, is subjected to decomposition by the microwave irradiation. This is also called the microwave decomposition method.
In any method, if the sample residue exists, it is necessary to separate it by the use of the centrifuge or the filter. Then, non-presence of the target element must be confirmed by checking the residue with the appropriate measurement. As the fluorine series resin sample is resistant to decomposition and its decomposition temperature is high, the sublimation or the splash of the target material takes place. So, due to the difficulty to obtain the sufficient accuracy, the abovementioned methods are not applied to this resin.
d) Analytical method
It should be performed in accordance with IEC62321-5/Ed.1:2013.
The calibration curve is prepared by the procedure like calibration curve, internal standard or standard addition. After the concentration of each material in the sample solution is measured, the content of each corresponding material in the solid sample is calculated.
5.2.2 Cadmium, lead and their compounds in the metal materials a) Scope of application
The quantitative analysis of cadmium, lead and compounds in the metal materials b) Analyzing equipment
2) Inductively coupled plasma mass spectrometer (ICP-MS)
The mass/electric charge (m/z) and signal intensity of the target element are measured.
3) Atomic absorption spectrometer (AAS)
The absorbance of the target element is measured. c) Pretreatment
1) Mechanical sample preparation
The average sample must be collected that represents the site to be measured. The collected sample is sliced and pulverized to the size suitable to the selected
analysis method in accordance with the procedure of IEC62321-2/Ed.1:2013. Then, an unbiased sample is taken by means of the quartering method or the like. 2) Preparation of the test solution
It is done in accordance with IEC62321-5/Ed.1:2013. i) Wet decomposition method
The sample is decomposed by acid like sulfuric acid, nitric acid, hydrofluoric acid, hydrogen peroxide or phosphoric acid.
ii) Method of acid decomposition in closed system (microwave decomposition method) The sample, to which acid is added in the decomposition container made of the special fluororesin, is subjected to decomposition by the microwave irradiation. If the sample residue exists, non-existence of target element must be confirmed by checking the residue with the appropriate measurement, or the test solution must be prepared by dissolving entirely the sample solution already dissolved in acid by the other dissolving method (for example, decomposition by alkali melting or microwave decomposition) and adding this solution to the acid solution.
d) Analytical method
It should be performed in accordance with IEC62321-5/Ed.1:2013.
5.2.3 Cadmium, lead, chrome and their compounds in glass and ceramics (electronic equipment)
a) Scope of application
The quantitative analysis of cadmium, lead, chrome and compounds in glass and ceramics (electronic equipment)
b) Analyzing equipment
1) Inductively coupled plasma optical emission spectrometer (ICP-OES) The emission intensity of the target element is measured.
2) Inductively coupled plasma mass spectrometer (ICP-MS)
The mass/electric charge (m/z) and signal intensity of the target element are measured.
3) Atomic absorption spectrometer (AAS)
The absorbance of the target element is measured. c) Pretreatment
1) Mechanical sample preparation
The average sample must be collected that represents the site to be measured. The collected sample is sliced and pulverized to the size suitable for the selected
analysis method in accordance with the procedure of IEC62321-2/Ed.1:2013 Then, an unbiased sample is taken by means of the quartering method or the like. 2) Preparation of the test solution
It is done in accordance with IEC62321-5/Ed.1:2013. i) Wet decomposition method
The sample is decomposed by acid like sulfuric acid, nitric acid, hydrofluoric acid, hydrogen peroxide or phosphoric acid.
ii) Method of acid decomposition in closed system (microwave decomposition method) The sample, to which acid is added in the decomposition container made of the special fluororesin, is subjected to decomposition by the microwave irradiation. If the sample residue exists, non-presence of target element must be confirmed
by checking the residue with the appropriate measurement, or the test solution must be prepared by dissolving entirely the sample solution already dissolved in acid by the other dissolving method (for example, decomposition by alkali melting or microwave decomposition) and adding this solution to the acid solution.
d) Analytical method
It should be performed in accordance with IEC62321-5/Ed.1:2013.
5.3 Mercury and its compounds
The quantitative analysis should be performed in accordance with IEC62321-4/Ed.1:2013. The analysis is performed by dissolving the sample in acid, by vaporizing the solution by heating or by reduction, then by using it for the measurement with ICP-Optical Emission Spectrometry (ICP-OES), ICP-Mass Spectrometry (ICP-MS) or Atomic Absorption Spectrometry (AAS) and by determining quantity with the use of the calibration curve prepared with the control solution. An alternative method of analysis is to quantify the samples by using Thermal Decomposition - Gold Amalgamation - Atomic Absorption Spectrometry (TD(G)-AAS), which requires no wet pretreatment and can measure samples directly.
Note: As mercury is highly volatile, its loss should be prevented by using the reflux condenser or the microwave heating equipment.
a) Scope of application
The quantitative analysis of mercury contained in the high-molecular materials, metal materials, and electronic parts.
b) Analyzing equipment
- Heating vaporized or reducing vaporized atomic absorption spectrometry (AAS) - Inductively coupled plasma optical emission spectrometer (ICP-OES)
- Inductively coupled plasma mass spectrometry (ICP-MS)
- Thermal Decomposition - Gold Amalgamation - Atomic Absorption Spectrometry (TD(G)-AAS)
c) Pretreatment
1) Mechanical sample preparation
The average sample must be collected that represents the site to be measured. The collected sample is sliced and pulverized to the size suitable for the selected analysis method in accordance with the procedure of IEC62321-2/Ed.1:2013. Then, an unbiased sample is taken by means of the quartering method or the like. 2) Preparation of the test solution
It is done in accordance with IEC62321-4/Ed.1:2013. i) Reducing vaporization method (Wet decomposition process)
The sample is decomposed by sulfuric acid, nitric acid or potassium permanganate using the decomposition flask attached with the reflux condenser. ii) Method of acid decomposition in closed system (microwave decomposition method)
The sample, to which acid is added, is subjected to decomposition by the microwave irradiation.
If the sample residue exists, it is necessary to separate it by the use of the centrifuge or the filter. Then, non-presence of the target element must be confirmed by checking the residue with the appropriate measurement.
iii) Thermal Decomposition - Gold Amalgamation method
the sample under predetermined thermal decomposition conditions. Mercury alone is concentrated as gold amalgam in a special mercury collection pipe, the obstacle components are removed, and then the reheated and vaporized mercury is measured using atomic absorption spectrometry.
d) Analytical method
It should be performed in accordance with IEC62321-4/Ed.1:2013.
The calibration curve is prepared by the procedure like calibration curve, internal standard or standard addition. After the concentration of each material in the sample solution is measured, the content of each corresponding material in the solid sample is calculated.
5.4 Hexavalent chromium and its compounds
Regarding hexavalent chromium on the metal surface, qualitative evaluation based on the amount detected per surface area should be carried out in accordance with IEC62321-7-1/Ed.1:2015, "Confirmation test of hexavalent chromium in colourless and coloured anticorrosive film of metal sample" established in 2015.
Also, regarding polymeric materials (polymers) and hexavalent chromium in electronic equipment, quantitative evaluation should be carried out according to IEC62321-7-2/Ed.1:2017, “Hexavelent chromium – Determination of hexavalent chromium (Cr(VI)) in polymers and electronics by the colorimetric method” established in 2017.
5.4.1 Confirmation test of hexavalent chromium in colorless and colored anticorrosive film of metal sample
The confirmation test must be done in accordance with IEC62321-7-1/Ed.1:2015. a) Scope of application
Confirmation test of hexavalent chromium in the colorless and colored anticorrosive film of the metal sample
b) Analyzing equipment Spectrophotometer c) Pretreatment
1) Washing of surface
The contamination on the sample surface such as foulings, oil film, and fingerprints must be wiped out by the clean, soft cloth wetted with solvent or removed by cleaning with the appropriate solvent. But, the forced drying at 35C or above, or alkali treatment are not permitted. If the sample is coated with the polymer material, only the polymer material layer must be removed by grinding with the sandpaper of grit size 800 without removing the anticorrosive membrane. 2) Preparation of test solution (Boiling water extraction method)
The sample with the surface area of 50 ± 5 cm2 is subjected to 50 mL boiling water
If the surface area of a sample is less than 50 ± 5 cm2, several samples may be used
to obtain a total of 50 cm2, but the total surface area must be at least 25 cm2. (The
quantity of boiled water to be extracted at that time must be 1 mL per 1 cm2.)
It is necessary to take the sufficient precautions in the test using the boiling water since the sample and the container become high in temperature.
d) Analytical method
Being different from the other specific hazardous substances, the concentration of hexavalent chromium in the sample solution is not measured by the prepared calibration curve but its conformity/noncoformity is judged by comparing with the absorbance of the sample solution of a certain concentration (equivalent to 0.10g/cm2
and 0.13g/cm2) according to Table 5.3.
- Diphenyl carbazide spectrophotometry
The absorbance is measured for the colored sample solution.
If the sample has a complicated shape, the surface area is estimated by size and shape.
Table 5.3 Evaluation criteria for hexavalent chromium Concentration of hexavalent
chromium by absorption spectrophotometry
Qualitative evaluation results
0.10 μg/㎝2 or equivalent Regarded as conformity
0.10 ~0.13 μg/㎝2 or equivalent Pending gray zone.
If possible, measure the sample surface three more times and evaluate the average.
0.13 μg/㎝2 or equivalent Regarded as unconformity.
e) Viewpoint to observe the RoHS Directive (Supplementary explanation)
As the restriction of the RoHS Directive, on most of the chemical substances contained in the product is implemented by the weight ratio on the level of the homogeneous material, the identical quantitative control is required also for hexavalent chromium within the colorless or colored anticorrosive membrane in the metal sample. Therefore, a viewpoint not described in IEC62321-7-1/Ed.1:2015 is presented below as the supplementary information to ensure the security for the various regulations.
First, please see the Figure below for the image of the anticorrosive membrane on the surface of the metal sample. At present, according to the restriction of the chemical substances contained in the product such as RoHS Directive, it is necessary to confirm the non-presence of the restricted substance for each of the three layers shown in the Figure.
Fig. 5.1 Image of anticorrosive membrane on metal sample surface
ク での表面処理層
亜鉛 ッ 層
ベースの金属層 L c
A c 2
ク での表面処理層
亜鉛 ッ 層
ベースの金属層 L c
A c 2
Surface layer treated with chromium
Zinc plated layer
Among several ideas to verify the non-presence, the following four ideas are suggested here.
1) To verify non-presence of total chromium
2) Apart from the anticorrosive surface treatment by the use of trivalent chromium, the non-presence of total chromium is verified, for example, by the X-ray fluorescence spectrometry for the surface treatment not using chromium or for the genuine metal material.
3) To estimate total chromium quantity on chromium-treated surface layer as denominator
If the non-presence cannot be verified by 2) above, then the total chromium quantity per unit area is determined by dissolving the chromium-treated surface layer in acid. Regarding this value as the denominator, the security for hexavalent chromium concentration is ensured by referring to the ratio with the value determined in a) to b).
Tentative concentration of hexavalent chromium (wt%)
= Hexavalent chromium elution quantity per unit area (g) / Total chromium quantity per unit area (g)
In this case, it is predicted that the total chromium quantity per unit area (g) is lower than the weight of the chromium-treated layer. Therefore, if the tentative concentration of hexavalent chromium (wt%) mentioned here is lower than the restricted value, the security of the restriction value is sufficiently ensured.
4) To make evaluation by calculating denominator from film thickness and apparent specific gravity (design value) of chromium-treated surface layer
If the security is not ensured even by 3), the investigation must be made by the following method.
If the thickness of the chromium-treated surface layer is denoted as L (cm) and the sample area as A (cm2), the weight of the chromium-treated surface layer W (g) can
be given as shown below: W = A・L・d
(Where d denotes the apparent specific gravity of the chromium-treated surface layer (g/cm3).)
Concentration of hexavalent chromium (wt%)
= Hexavalent chromium elution quantity per unit area (g) / W (g)
Where, the design value or the inspection values of L and d should be obtained from the manufacturer.
In the generally practiced chromium-based anticorrosive surface treatment, the finished film becomes 0.2 through 0.5 μm in most of the cases. In regard with the apparent specific gravity, its value is mentioned to be 2 through 5 in general. Since the true specific gravity is 7.19 (g/cm3), the apparent specific gravity cannot be
greater than this value. For both the film thickness and the specific gravity, it is wise to request for the information on the design and the inspection values to the manufacturer that performed the anticorrosive treatment.
5.4.2 Hexavalent chromium in polymer materials (polymers) and electronics
The measurement should be done in accordance with the IEC62321-7-2/Ed.1: 2017. a) Scope of application
Quantitative determination method on hexavalent chromium in the polymer materials (polymers) and electronics.
b) Analyzing equipment Spectrophometer c) Pretreatment
1) Mechanical sample preparation
The test must be performed by using the equipment and container not containing the stainless steel. The average sample to represent the site to be measured is collected and pulverized to the fine powder to pass through the 250 μm sieve. 2) Preparation of test solution
It shall be implemented by any of the following methods.
i) Extraction of Cr(VI) in soluble polymers – ABS (Acrylonitrile-butadiene-styrene), PC (Polycarbonate), and PVC (Polyvinylchloride)
Sample shall be dissolved in N-methylpyrrolidone, and Cr(VI) is extracted with an alkaline extracting solution.
Apparatus: General analysis apparatus, and ultrasonic cleaning tank which can maintain temperature between 80 and 85 C
ii) Extraction of Cr(VI) in insoluble/unknown polymers and electronics-without Sb Sample shall be decomposed in toluene / alkaline solution between 150 and 160℃. After that, it is divided into an organic layer (toluene) and an aqueous layer (alkaline solution), and the aqueous layer shall be kept for Cr(VI) analysis.
Note: If it cannot be kept at 150-160℃ in decompsosition in the toluene / alkaline solution, the measurement result will become too small because of insufficient decomposition. For complete decomposition, it is necessary to carry out adequate stirring or mixture, disperse the sample to the organic layer, and confirm the change in coloration of the organic layer and aqueous layer.
d) Analytical method
After the preparation of the calibration curve by using the calibration curve method and the measurement of hexavalent chromium concentration in the sample solution, the content in the solid sample is calculated.
Diphenyl carbazide absorption photometry
The absorbance of the colored sample solution is measured. Analytical equipment: Spectrophotometer
e) Spike and recorery test
Because this test method is subject to relatively strong matrix effects, it is necessary to implement an spike and recovery test. The permissible range of recovery rate shall be 50 % to 125 %, and if there is deviation, the sample shall be re-analysed
In the case of a recovey rate of between 50 % and 75 %, the result shall be corrected according to the recovey rate, but if the recovery rate is 75 % to 125 %, it shall not be corrected.
5.4.3 Other items to be noted
As the description is not complete in some parts in the abovementioned test methods of IEC62321-7-1/Ed.1:2015 and Attachment C of IEC62321/Ed.1:2008, please also refer to the following test methods.
- JIS H8625:1993, Appendix 2 (Hot water extraction)
- JIS K0400-65-20:1998 (Diphenyl carbazide absorption photometry) - EPA 3060A (Hot alkali extraction)
- EPA 7196A (Diphenyl carbazide absorption photometry)
5.5 Specific brominated compounds (PBBs and PBDEs)
5.5.1 Screening analysis of total bromine by combustion - ion chromatography
a) Scope of application
Polymers and electronic parts b) Analyzing equipment
Ion chromatograph c) Pretreatment
1) Mechanical sample preparation
Sampling should be performed in accordance with IEC62321-2/Ed.1:2013. Average samples representing the regions to be measured are collected. The samples collected are cut to sizes suited for the analysis method selected, and then pulverized. After that, an unbiased sample is taken by means of the quartering method or the like.
Solid samples are cut to 3 mm x 3 mm or a smaller size with scissors or a similar tool. Liquid samples are prewashed two or three times with samples for use with a pipette, and then collected.
2) Combustion treatment of samples
One mg to 100 mg of sample to an accuracy of 0.1 mg is weighed and placed on a sample boat, and is then burned in accordance with a specified combustion program. Table 5.4 shows examples of combustion furnace and absorbent conditions. (Excerpts from IEC62321-3-2/Ed.1:2013, Annex F)
Table 5.4 Combustion furnace and absorbent conditions
Parameter Condition
Combustion furnace temperature 900 - 1100℃
Oxygen gas flow 400 ml/min
Argon gas flow 200 ml/min
Amount of humidifying water 0.01 - 0.04 ml/min
Absorbent amount 10 - 20 ml
After combustion, if any soot, residual sample particles or other traces of imperfect combustion are seen, the combustion program is repeated until the sample is completely burned up.
If the sample is flux, solder paste, or other incombustible material, it must be burned up with tungsten oxide or other combustion improver.
The gas generated during combustion is collected in an absorbent and used as a measurement solution. (For absorbent, use a water solution or similar solution containing about 900 mg/kg of hydrogen peroxide.)
containing at least 0.25 g/kg of bromine. (See IEC62321-3-2 Annex A and IEC62321-3-2 Annex B.)
d) Analytical method
Ion chromatography is used to measure the concentration of bromide ions. The calibration curve method or internal standard method is used to prepare a calibration curve and measure the concentration of bromide ions in the sample solution, and then calculate their respective concentrations in solid samples. If the concentration of bromide ions in the sample solution measured exceeds the range of the calibration curve, it is diluted with ultrapure water to set it within the specified range, and then measured again.
5.5.2 Specific brominated compounds (PBBs and PBDEs)
The quantitative analysis is done in accordance with IEC62321-6/Ed.1.0:2015. For the quantitative determination, of PBBs and PBDEs, polymers are separated by soxhlet extraction and analyzed by the gas chromatography-mass spectrometer (GC-MS).
a) Scope of application
Quantitative analysis of PBBs and PBDEs in the polymers b) Analyzing equipment
Gas chromatography-mass spectrometer (GC-MS)
The gas chromatograph with its capillary column connected to the mass spectrometric detector (Electron Ionization, EI) is used for the analysis. The mass spectrometric detector must be the selective ion monitoring type with the upper limit of the mass range at 1,000 m/z or more.
c) Pretreatment
The sample is prepared before the extraction by freezing and pulverizing it at the liquid nitrogen temperature to pass through the 500 μm sieve.
This sample in the weight of 100mg is subjected to extraction by Soxhlet extractor using the solvent like toluene. The sample is placed into the paper filter in
cylindrical shape and extraction is performed in the solvent in the 60 mL round-bottom flask for 2 hours or more. It is to be noted that the recovery of the target analytical component, particularly the PBDE of high molecular weight becomes lower as the extraction time is shorter.
d) Analytical method
The calibration curve for quantitative analysis is produced by preparing 5 or more calibration solutions at the concentration of the same interval, and quantitatively measuring based on the measurement value of peak area. For the standard solution, homologues and surrogate standards of PBB and PBDE shall be managed in accordance with IEC62321-6/Ed.1:2015.