A uthor(s )
S ato, T atsuhiko; Masunaga, S hin-ichiro; K umada, Hiroaki;
Hamada, Nobuyuki
C itation
S cientific R eports (2018), 8
Is s ue D ate
2018-01-17
UR L
http://hdl.handle.net/2433/229015
R ig ht
©
T he A uthor(s) 2018. T his article is licensed under a C reative
C ommons A ttribution 4.0 International L icense, which permits
use, sharing, adaptation, distribution and reproduction in any
medium or format, as long as you give appropriate credit to the
original author(s) and the source, provide a link to the C reative
C ommons license, and indicate if changes were made. T he
images or other third party material in this article are included
in the article’
s C reative C ommons license, unless indicated
otherwise in a credit line to the material. If material is not
included in the article’
s C reative C ommons license and your
intended use is not permitted by statutory regulation or exceeds
the permitted use, you will need to obtain permission directly
from the copyright holder. T o view a copy of this license, visit
http://creativecommons.org/licenses/by/4.0/.
T ype
J ournal A rticle
Microdosimetric Modeling of
Biological Efectiveness for
Boron Neutron Capture Therapy
Considering Intra- and Intercellular
Heterogeneity in
10
B Distribution
Tatsuhiko Sato
1, Shin-ichiro Masunaga
2, Hiroaki Kumada
3& Nobuyuki Hamada
4We here propose a new model for estimating the biological efectiveness for boron neutron capture therapy (BNCT) considering intra- and intercellular heterogeneity in 10B distribution. The new model was developed from our previously established stochastic microdosimetric kinetic model that determines the surviving fraction of cells irradiated with any radiations. In the model, the probability density of the absorbed doses in microscopic scales is the fundamental physical index for characterizing the radiation ields. A new computational method was established to determine the probability density for application to BNCT using the Particle and Heavy Ion Transport code System PHITS. The parameters used in the model were determined from the measured surviving fraction of tumor cells administrated with two kinds of 10B compounds. The model quantitatively highlighted the indispensable need to consider the synergetic efect and the dose dependence of the biological efectiveness in the estimate of the therapeutic efect of BNCT. The model can predict the biological efectiveness of newly developed 10B compounds based on their intra- and intercellular distributions, and thus, it can play important roles not only in treatment planning but also in drug discovery research for future BNCT.
Neutron capture therapy using the 10B(n, α) 7Li reaction, BNCT, is one of the most efective therapeutic
modal-ities for treating locally invasive malignant tumors thanks to the large neutron-capture cross sections of 10B as
well as short ranges of their secondary particles. Upon this reaction, 1.77 MeV α particle and 1.02 MeV 7Li ion are
emitted at the branching ratio of 6.3%, while 1.47 MeV α particle, 0.84 MeV 7Li ion, and 0.478 MeV photon are
produced in the remaining 93.7% cases. In addition, 0.54 MeV protons emitted from the 14N(n, p)14C reaction,
recoil protons produced by the 1H(n,n)p reaction, photons generated by the 1H(n,γ)2H reaction, and
contamina-tion photons in the neutron beam also contribute to energy deposicontamina-tion during BNCT. In the treatment planning of BNCT, the absorbed doses deposited by 10B(n, α)7Li, 14N(n, p)14C, 1H(n, n)p, and photons are separately
cal-culated1,2, which are referred hereinater to as boron, nitrogen, hydrogen, and photon components, respectively. Low energy particles with high linear energy transfer (LET) are dominant contributors to the absorbed doses, except for the photon component. hus, estimate of their relative biological efectiveness (RBE) is indispensable for the maximal therapeutic eicacy to tumors while sparing normal tissues. Several models have been proposed for evaluating the RBE of high LET charged particles relevant to BNCT3–6. However, the therapeutic eicacy depends not only on the RBE but also on the intra- and intercellular heterogeneity of 10B distribution. For
exam-ple, 10B-boronphenylalanine (BPA: C
9H12BNO4) is more efective for tumor cell inactivation than 10B-sodium
borocaptate (BSH: Na2B12H11SH) at the same 10B concentration owing to cell permeability of BPA7. he concept of
Japan Atomic Energy Agency (JAEA), Nuclear Science and Engineering Center, Research Group for Radiation Transport Analysis, - Shirakata, Tokai, Ibaraki, - , Japan. Particle Radiation Biology, Department of Radiation Life and Medical Science, Research Reactor Institute, Kyoto University, - Asashiro-nishi, Kumatori, Sennan, Osaka, - , Japan. Proton Medical Research Center, University of Tsukuba, - - Amakubo, Tsukuba, Ibaraki, - , Japan. Radiation Safety Research Center, Nuclear Technology Research Laboratory, Central Research Institute of Electric Power Industry (CRIEPI), - - Iwado-kita, Komae, Tokyo, - , Japan. Correspondence and requests for materials should be addressed to T.S. (email: sato.tatsuhiko@jaea.go.jp)
Received: 7 February 2017
Accepted: 19 December 2017
Published: xx xx xxxx
the compound biological efectiveness (CBE)8,9 was then introduced to consider this efect in the BNCT treatment planning. he stochastic nature of the intercellular 10B distribution is also expected to inluence the therapeutic
eicacy10 because the surviving fraction (SF) of a cell population generally becomes larger with increasing hetero-geneity of absorbed dose in each cell nucleus, particularly at higher doses11 Furthermore, the sum of the absorbed dose weighted by ixed RBE or CBE (hereater, RBE-weighted dose) of each component, which is currently evalu-ated in the BNCT treatment planning, may not be an adequate index for representing its therapeutic efect, since RBE and CBE vary with the absorbed dose, and the synergistic efect exists in the radiation ields composed by diferent radiations12,13. hus, the photon dose giving the same therapeutic efect (hereater, photon-isoefective dose) was proposed for use in the BNCT treatment planning14,15.
Here, we set out to develop a new model for estimating RBE and CBE as well as photon-isoefective doses of BNCT considering the intra- and intercellular heterogeneity in 10B distribution. It is based on the stochastic
microdosimetric kinetic (SMK) model11, which was developed from the microdosimetric kinetic (MK) model proposed by Hawkins16. hese models can estimate the cellular SF, not from the proiles of radiation imparting energy such as LET, but from the dose distribution at microscopic sites in the cell nucleus, so-called domains. hese models thus consider the synergistic efect intrinsically. In our developed model, dose distributions in domains are calculated by the microdosimetric function17–19 implemented in the Particle and Heavy Ion Transport code System PHITS20, considering the intracellular 10B distributions. In addition, the SMK model was improved
to be capable of taking the dose rate efect into account. An advantage of the SMK model over the original MK model is that while the former can fully consider the stochastic nature of the absorbed dose in each cell nucleus, the latter approximates the dose by their mean value. his feature is particularly important when it is applied to BNCT because the greater heterogeneity of the absorbed dose in each cell nucleus are expected for BNCT than for other radiotherapeutic modalities, due to the stochastic nature of the intercellular 10B distribution21.
Four parameters that express cellular characteristics must be evaluated in the developed model. In this study, their numerical values were determined by the least-square (LSq) itting of the SF of tumor cells, which we pre-viously determined in vivo/in vitro experiments of mice exposed to reactor neutron beam with concomitant BPA or BSH treatment at various concentrations22. hus, this paper focuses on the analysis of the therapeutic efect of BNCT, and does not discuss about normal tissue complications. he details of the calculation procedures in the developed model are shown below, and the calculated SF is compared with the corresponding measured data. he inluence of the intra- and intercellular heterogeneity in 10B distribution on the SF, and the diference in the
RBE-weighted and photon-isoefective doses are discussed.
Methods
Principle of the SMK and MK models.
he MK model is one of the most successful models to explain the biological efectiveness for the cellular SF. It mathematically interprets the linear-quadratic (LQ) relation of the SF based on the theory of dual radiation action23. In the model, the following six basic assumptions were made: (i) a cell nucleus can be divided into multiple domains; (ii) radiation exposure produces two types of DNA damage named lethal and sublethal lesions in cell nuclei; (iii) the number of lethal and sublethal lesions produced in a domain is proportional to the speciic energy, z, in the domain; (iv) a sublethal lesion is to be repaired, or con-verted into a lethal lesion via spontaneous transformation or interaction with another sublethal lesion created in the same domain; (v) a domain is to be considered inactivated when an intra-domain lethal lesion is formed; and (vi) a cell is to be considered inactivated when an intranuclear domain is inactivated. Note that the speciic energy z indicates the energy deposited per mass at a microscopic site. z is a stochastic quantity and therefore intrinsi-cally diferent from the absorbed dose, albeit with the same unit. he deinition of speciic energy as well as other microdosimetric quantities is summarized in International Commission on Radiation Units and Measurements (ICRU) Report 3624.Based on these assumptions, the SF of a single cell with its nucleus speciic energy zn, S zC( )n, can be calculated by
α β β
= − + −
S zC( )n exp[ ( 0 0 d,z D)zn 0 nz 2], (1) where zd,D denotes the dose-mean value of speciic energy in domain, zd, per event written as
∫
∫
=∞
∞
z z f z z
z f z z ( )d
( )d , (2)
d,D 0
d2d,1 d d
0 d d,1 d d
where fd,1(zd) is the probability density (PD) of zd per event. Note that the term of “event” denotes a single hit of
radiation in microdosimetry. he parameters α0 in Eq. (1) expresses the inactivation sensitivity of domains to lethal lesions, and β0 represents the interaction probability of two sublethal lesions created in the same domain. In addition to α0 and β0, the domain radius, rd, are the free parameters representing the characteristics of the cell
type in the MK model. he numerical values of these parameters are independent of the radiation imparting the energy.
Considering the stochastic nature of zn, the SF of a cell group irradiated with the mean cell-nucleus dose zn, SG(zn), can be estimated by
∫
= ∞
S (z ) S z f z( ) ( , z )d ,z
(3) G n
0 C n n n n n
∫
∞z f z( , z )dz = z.(4) 0 n n n n n n
In the original MK model, SG(zn) is simply approximated by Sn(zn) by ignoring the stochastic nature of zn, i.e.,
substituting the Dirac’s delta-function δ(zn) for f zn( ,n zn) in Eq. (3). In contrast, Eq. (3) is numerically solved in the SMK model because our previous study revealed that the consideration of the stochastic nature of zn is of great
importance in estimating SF following high-dose, high-LET irradiation11. Since the number of events contribut-ing to the energy deposition is expected to follow a Poisson distribution, f zn( ,n zn) can be calculated by
∑
λ= −λ
f z z z e
k f z
( , ) ( )
! ( ), (5)
k
k z k
n n n n
( )
n, n
n
where fn,k(zn) is the PD of zn per k events, which can be determined from fn,1(zn) and fn,k−1(zn) using the
convolu-tion method as written by
∫
= − − .
f ( )z f ( )z f (z z z)d
(6)
k
z
k
n, n
0 n,1 n, 1 n
n
he expected value of the Poisson distribution, λ(zn), can be estimated by
λ z = z z
( ) ,
(7)
n n
n,F
where zn,F is the frequency-mean zn per event, which can be calculated by
∫
= ∞ .
z z f ( )dz z
(8) n,F
0 n n,1 n n
Eqs (1–8) can be numerically solved by determining fd,1(zd) and fn,1(zn), and thus, their evaluations are pivotal
in estimating SF based on the SMK model. he calculation procedures of fd,1(zd) and fn,1(zn) were established
based on the microdosimetric and LET-estimator functions, respectively, implemented in PHITS, assuming that all radiations can penetrate the targets. However, this assumption is not valid for estimating fn,1(zn) in the
radi-ation ields of BNCT due to the short ranges of secondary particles produced by neutron capture reactions. In addition, the intracellular heterogeneity of 10B distribution inluences both f
n,1(zn) and fd,1(zd). Accordingly, a
new method was developed here for calculating fd,1(zd) and fn,1(zn) for BNCT as described in the next subsection.
In our previous study, the overkill efect following high LET irradiation was considered in the SMK model by introducing a free parameter z0 called “saturation parameter”. In a domain with z over z0, the numbers of lethal
and sublethal lesions produced in the domain are assumed to be saturated, and not proportional to z. However, the model developed here does not need this parameter because the overkill efect was not observed in the meas-ured SF used for the parameter determination in this study, i.e. the higher z0 values always provided the better
itting results. his is why the double stochastic microdosimetric kinetic (DSMK) model11, which can handle the saturation correction more precisely but with longer computational time, was not employed in this study. Taken together, the SMK and DSMK models have a function to deal with the nontargeted efects25, but this function is not used in this study because the nontargeted efects play only a negligible role in cell inactivation at high-dose irradiation where estimation of the therapeutic efect is important.
On the other hand, we improved the SMK model to be capable of considering the dose rate efect, which is very important in the estimate of the therapeutic efect of BNCT due to its relatively longer irradiation time in comparison to other radiotherapeutic modalities. Considering the decrease of sublethal lesions during irradia-tion, Eq. (1) should be replaced by
α β β
= − + −
S zC( )n exp[ ( 0 0 d,Dz )zn G z0 n], (9) 2
where G is the correction factor of the quadratic coeicient of the LQ relationship26,27. he numerical value of G can be approximated by
γ γ γ
= − − +
G
T T T
2
(0 ) [exp( ) 1 ], (10)
2 0 0
where T is the irradiation time, and γ0 is the irst order rate constant of repair and spontaneous transformation of sublethal lesions. In this study, γ0 is regarded as a free parameter.
Calculation of PD of
z
dand
z
nconsidering intracellular
10B distribution.
In order to estimate fd,1(zd)and fn,1(zn) in the radiation ields of BNCT, we performed the particle transport simulation in a three-dimensional
cells including their nucleus and extracellular space was set to 1 g/cm3, of which composition was assumed to be
the same as that used in the dose evaluation of the experimental data, i.e., H (11.1%), C (12.6%), N (2.1%), and O (74.2%) by weight.
In the PHITS simulation for determining fd,1(zd) and fn,1(zn) for the boron component, secondary charged
par-ticles emitted from neutron capture reaction of 10B, i.e., an α particle and a 7Li ion, were generated to the opposite
directions as a Monte Carlo history, using the correlation source generation function of PHITS. he branching ratio of the reaction was considered, though the generation of 0.478 MeV secondary photons was ignored in the simulation because their energy depositions were categorized as the photon component. he PHITS simulations were carried out four times by changing the source localizations, assuming the uniform distribution of 10B in the
cell nucleus, cytoplasm, extracellular space, or at a boundary between cytoplasm and extracellular space (here-ater, cell surface) of the central lattice. he PD of zn per event, fn,1(zn), was estimated by calculating the energy
deposited in each cell nucleus per Monte Carlo history. In addition, the PD of zd per event, fd,1(zd), in cell nuclei
was calculated using the microdosimetric function in PHITS by changing the domain radii from 0.1 to 0.3 µm by 0.01 µm step. For each condition, Monte Carlo history was set to 1 million, and the PHITS simulation took approximately 15 minutes using a Linux system with 32 CPU cores. Note that the microdosimetric function was developed by itting the results of track-structure simulation, and thus, it can analytically determine the PD of microscopic sites down to the nanometer scales, considering the dispersion of deposition energies due to the production of δ-rays. herefore, each domain in cell nucleus was not explicitly speciied in the geometry of the PHITS simulation, as shown in Fig. 1.
Considering the intracellular heterogeneity of the 10B distribution, f
d,1(zd) for the entire boron component,
fd,1B( )zd, can be obtained by averaging the data for each localized source, fd,1( )z B,n
d, fd,1( )z B,c
d, fd,1( )z B,s
d, and fd,1( )z B,e
d, weighted by their 10B fractions as written by
= + + +
+ + +
f z N f z N f z N f z N f z
N N N N
( ) ( ) ( ) ( ) ( ),
(11)
d d
d,1 B
d n d,1 B,n
d c ,1 B,c
d s ,1 B,s
d e d,1 B,e
d
n c s e
where N is the relative number of 10B distributed in each cell compartment, and their subscripts (i.e., “n”, “c”, “s”
and “e”) indicate the data for cell nucleus, cytoplasm, cell surface, and extracellular space, respectively. he total number of 10B in the entire region including extracellular space is normalized to 1.0, i.e., N
n+ Nc+ Ns+ Ne= 1.0.
For BPA, we set Nn= Ns= 0 because BPA enters cells through amino acid transporters21,29, and is assumed here to
distribute in the cytoplasm, but not in the cell nucleus. For BSH, we set Nn= Nc= 0 because BSH does not pass
through the cell membrane30. he ratios between the 10B concentrations in intra- and extracellular regions were
taken from the experimental data for malignant cells, which were approximately 3.2 for BPA and 0.86 for BSH31. hen, Nc and Ne for BPA were evaluated to be 0.78 and 0.22, respectively, and Ns and Ne for BSH were to be 0.48
and 0.52, respectively, considering the volume ratio between intra- and extracellular regions in our model. he PD of zn for the entire boron component, fn,1B( )zn, can also be determined from an equation similar to Eq. (11) by replacing fd,1(zd) by fn,1(zn).
To calculate fd,1(zd) and fn,1(zn) for other dose components, their source terms must be evaluated before
con-ducting the microscopic PHITS simulation because the energy spectra of secondary charged particles depend on the irradiation conditions such as the incident neutron spectrum particularly for the hydrogen component. We therefore performed the macroscopic PHITS simulation to determine the source terms by reproducing the experimental irradiation conditions used in our previous study21. In the simulation, a cubic-shaped tumor with volume of 1 cm3 was irradiated with neutron beam in the OO-0000-F mode of Kyoto University Research Reactor
(KUR)32, and spectra of produced charged particles including recoil nuclei were scored for each mother nucleus using the event generator mode33. he charged particles emitted only from the 14N(n,p)14C reaction were regarded
as the nitrogen component, while others were categorized as the hydrogen component. hus, secondary charged
particles emitted from carbon and oxygen were included in the hydrogen component, though their contributions are not so signiicant. he correlation between recoil proton and carbon ion was considered in simulating the nitrogen component, similarly to the boron component. he spectra of produced electrons were separately scored as the source term for the photon component. Note that the electron spectra produced from the contamination photons in the neutron beam were assumed to be the same as those from photons generated inside the tumor because the spectrum of the contamination photons was not evaluated. Using the evaluated source terms, micro-scopic PHITS simulations were performed to calculate fd,1(zd) and fn,1(zn) for the hydrogen, nitrogen, and photon
components. he simulation conditions were the same as those used for the boron component calculation except for the source locations, where the charged particles were uniformly generated inside the whole central lattice because the intra- and extracellular heterogeneity of other dose components was not considered in this study.
For the mixed radiation ields of the boron, hydrogen, nitrogen, and photon components, fd,1(zd) is simply
obtained from the frequency-mean of the data for each component as written by
λ λ λ λ
λ λ λ λ
= + + +
+ + +
γ γ
γ
f ( )z f ( )z f ( )z f ( )z f ( )z ,
(12) d,1 d B d,1
B
d H d,1 H
d N d,1 N
d d,1 d
B H N
where λB, λH, λN, and λγ are the number of energy-deposition events, i.e., zd/ zd,F, for the boron, hydrogen, nitro-gen, and photon components, respectively, and fd,1B( )zd, fd,1( )z
H
d, fd,1( )z N
d, and fd,1γ ( )zd are the PD of zd per event
for each component. he PD of zn for the mixed radiation ields, fn,1(zn), can also be determined using an equation
similar to Eq. (12) by replacing fd,1(zd) by fn,1(zn).
It should be mentioned that the cell-nucleus dose for the boron component, znB, is diferent from the value obtained from the kinetic energy released per unit mass, kerma, of the 10B(n, α)7Li reaction multiplied with the
neutron luence and the 10B concentration in tumor (hereater kerma dose D) due to the heterogeneity of the
intracellular 10B distribution. To convert the kerma dose of the boron component, D
B, to znB, we calculated the ratios between the absorbed doses in cell nucleus for heterogeneous and homogeneous 10B distributions based on
the PHITS simulation. he evaluated conversion factors, κB, were 0.78 for BPA and 0.51 for BSH. Note that κB depends on the distance between the centers of a cell and its nucleus, and they become 0.82 and 0.45 for BPA and BSH, respectively, when we assume concentric spheres of a cell and its nucleus. On the other hand, the mean absorbed doses in cell nucleus for other components were assumed to be the same as their kerma doses in this study because the diference in the material compositions between cell compartments were not considered in our simulation. he conversion factor from the total kerma dose, D, to zn, κ, can be obtained from
κ=(κBDB+DH+DN+Dγ)/D. (13) he numerical value of κ depends on the characteristics of the irradiation ield and the 10B compound. Using
κ and D, Eq. (3) can be rewritten as:
∫
κ = ∞ κ .
S ( ,D) S z f z( ) ( , D z)d
(14) G
0 n n n n n
Consideration of intercellular
10B distribution.
It is expected that the larger the variance of the inter-cellular 10B distribution in tumor cells, the lower the therapeutic eicacy of BNCT. In order to take this efect intoaccount, we assumed that a cell population consists of a number of cell groups having a 10B concentration higher
(or lower) than the population mean value by a factor of x. Under this assumption, Nn, Nc, and Ns should be
mul-tiplied with x, and the conversion factor κ depends on x. hen, the SF for a cell population with kerma dose D, SP(D), can be calculated by the summation of the SF of each cell group as written by
∑
κ=
S D( ) S ( ( ),x D P) ,
(15)
i
i i
P G
where Pi denotes the probability of cells belonging to group i, which satisies the condition:
∑
x P=1,(16)
i i i
where xi is the 10B concentration factor for group i. For continuous intercellular 10B distributions, Eq. (15) can be
rewritten as:
∫
κ= ∞
S D( ) S ( ( ),x D p x dx) ( ) ,
(17) P
0 G
where p(x) denotes the PD of cells having a 10B concentration factor x.
In this study, SP(D) for two diferent types of the intercellular 10B distributions were analyzed, which are the
double peak distribution with the same probability, i.e., P1= P2= 0.5, x1= 1 −σ, and x2= 1 +σ, and the Gaussian
distribution, i.e., p(x) =exp[ (− x−1) /22 σ2]/ 2σ π2 , by changing their standard deviation σ from 0 to 0.6. For σ= 0, the probability becomes a single peak with P1= 1 and x1= 1, indicating that the 10B concentrations are the
same for all cells. he double peak distribution represents the situation where the intake of the 10B compounds
Determination of parameters used in the SMK model.
he parameters used in the SMK model, i.e., α0, β0, γ0, and rd were determined from the LSq itting of SF that we previously determined in SCC VII murinesquamous cell carcinoma22. For experiments, tumor cells were inoculated subcutaneously into the let hind legs of syngeneic female C3H/He mice. 10B-carrier solutions with BPA concentrations of 250, 500, and 750 ppm, and
BSH concentrations of 125, 250, and 375 ppm were prepared, and administrated to the tumor bearing mice in a volume of 0.02 ml/g body weight. he mice were irradiated with neutron beam in the OO-0000-F mode of KUR32. he neutron and contaminated photon dose rates in the neutron beam were approximately 0.90 and 0.66 Gy/h, respectively. For both BPA and BSH, the mean 10B concentration in the tumor during irradiation
was approximately 17, 23, and 26 µg/g with the low, middle, and high ppm, respectively. Note that the actual 10B
concentrations varied with time ater injection very much, and the uncertainties of the mean values are expected to be 20–30%. hese experiments were approved by the Committee on Safety and Ethical Handling Regulations for Laboratory Animal Experiments, Kyoto University, and followed institutional guidelines for the care and use of laboratory animals in research. he kerma doses of the experimental data were reevaluated because the kerma factors employed in the former evaluation were diferent from those used in the PHITS simulation. In addition, the temporal variation in the 10B concentration during irradiation was also considered in the reevaluation. he
SF of the tumor cells was measured by a clonogenic cell survival assay. he mice without administrating 10B
com-pounds were also irradiated with the neutron beam as well as a 60Co γ-ray ield with dose rate of 2.0 Gy/min to
obtain the reference data. More details about the experiments have been described previously22. In the LSq itting, the chi-square value, χ2, was calculated by
∑
χ = − ∆ =S D S D
S D
( ) ( )
( ) , (18)
j n
j j j j j j 2 1 ,exp ,cal ,exp 2
where Sj,exp(Dj) and ∆Sj,exp(Dj) are the measured SF and their uncertainties, respectively, for the irradiation
con-dition j with the kerma dose Dj, Sj,cal is the corresponding SF calculated by our model, and n is the number of
irradiation conditions, i.e., experimental data points adopted in the itting. In the calculation of Sj,cal, we employed
Eq. (15) and set P1= 1 and x1= 1, i.e., the heterogeneity of the intercellular 10B distributions being ignored due to
the diiculty in their evaluation during the measurement. hus, it is ideal to exclude all experimental data with
10B administration from the LSq itting because those data are supposed to be inluenced by the heterogeneity.
However, the uncertainties of the evaluated itting parameters obtained only from the experimental data without
10B administration were very large, more than 100%, due to the small number of the data points (only 7 points)
for four-parameter itting. We therefore included the experimental data for BSH administration in the LSq itting because of their lower sensitivity to the heterogeneity in comparison to the BPA data, as discussed later.
he procedure for the LSq itting was as follows. At irst, we determined the numerical values of α0, β0, and γ0 to give the minimum χ2 for each r
d for which fd,1(zd) was obtained from the PHITS simulation, based on the
Levenberg-Marquardt algorithm. hen, the practical best-it value of rd was determined by searching the smallest
χ2 among all calculated data. he evaluated parameters are 0.0422 ± 0.0234 Gy−1 for α
0, 0.00822 ± 0.00312 Gy−2
for β0, 4.33 ± 3.74 h−1 for γ
0, and 0.24 µm for rd. he accuracy of the itting was veriied by calculating χ2 per
degree of freedom and R2 for the condition, which are 0.816 and 0.960, respectively. Note that R2 is an adjustment for the coeicient of determination, R2, which becomes close to 1 when a model reproduces the data well. It
should be also mentioned that these parameters were not exactly equal to their best-it values due to the discrete-ness of rd. he diference between the evaluated and best-it values, however, should be trivial due to little
depend-ence of χ2 on r
d around 0.24 µm.
Results and Discussion
PD of
z
dand
z
n.
Figure 2 shows the cross-sectional views of calculated absorbed doses per Monte Carlohistory for each dose component. For the boron component (panel A), the data for the cytoplasmic localization source are depicted. Note that these simulations started with the production of charged particles, so that neutron and photon motions were not simulated. It is evident that while the absorbed doses are concentrated in the cen-tral cell or its neighboring cells for the boron and nitrogen components, they are widely spread for the photon component due to longer ranges of secondary electrons. For the hydrogen component, most particles stop very close to the central cell similarly to the nitrogen component, but occasionally travel through several cells because
some protons recoiled by high-energy neutrons have an energy in the order of MeV. Note that the range of 1 MeV proton in water is approximately 24 µm.
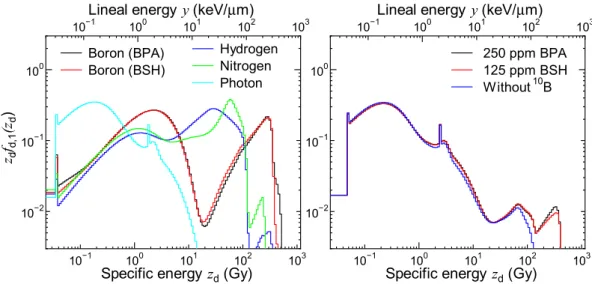
Figure 3 shows the zdfd,1(zd) calculated for each dose component and for some experimental conditions. he
data for the experimental conditions with higher concentrations of 10B compounds are not shown because the
calculated PD does not much depend on the 10B concentration. he domain radius, r
d, was set to 0.24 µm as its
evaluated value in this calculation. he upper axis denotes the corresponding lineal energy, y, which is frequently compared with LET. In general, the calculated zdfd,1(zd) is shited to higher speciic energies with an increase in
LET of the primary contributing particle for each component. Two broad peaks are observed in the data for the boron component, which are attributed to the contributions from δ-rays and primary ions, respectively. he sharp peak observed in the data for the photon component around 2 Gy is originated from the production of an Auger electron.
Figure 4 shows the calculated znfn,1(zn) for each dose component and for some experimental conditions.
Unlike zdfd,1(zd) shown in Fig. 3, the znfn,1(zn) calculated for BPA and BSH is apparently diferent from each other;
a sudden decrease of znfn,1(zn) around 0.5 Gy is observed only in the data for BSH. his is because Li ions
pro-duced at the cell surface can reach but not penetrate its cell nucleus due to their short range of approximately 4
µm. Note that the events with the highest speciic energy, approximately 2 Gy, occur when an α particle or a Li ion penetrates at the center of a cell nucleus. he gap observed in the data for nitrogen component around 0.06 Gy is attributed to the 14N(n,p)14C reaction occurring in cell nucleus because such events deposit at least 0.042 MeV, the
energy of recoil carbon ion, in cell nucleus.
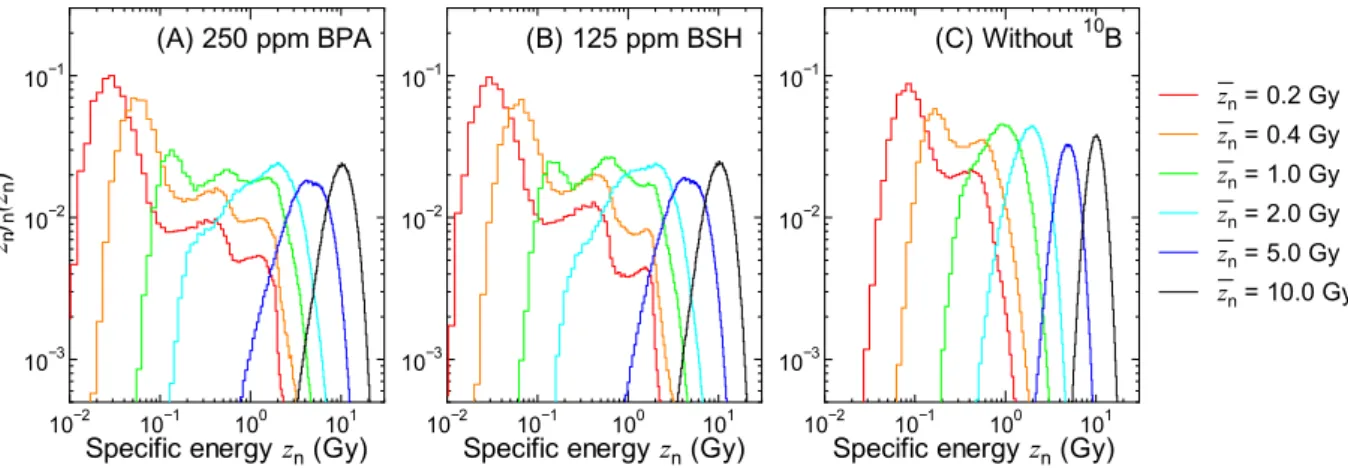
Figure 5 shows z f zn n( ,n zn) for some experimental conditions calculated by numerically solving Eqs (5) and (6). he shapes of z f zn n( ,n zn) are similar to those of the corresponding znfn,1(zn) for lower zn, while they become closer to the Gaussian distribution with increasing zn. It is evident from the graphs that the administration of 10B
Figure 3. Calculated zdfd,1(zd) for each dose component (let) and some experimental conditions (right). he
upper axis denotes the corresponding lineal energy, y, which is frequently compared with LET.
enlarges the variance of the PD even for the highest zn, indicating higher intercellular dose heterogeneity. Noteworthy is that the intercellular dose heterogeneity becomes even higher when the intercellular 10B
distribu-tion is considered.
Surviving fraction.
Figure 6 shows the measured and calculated SF for the tumor cells with administrated BPA (pane1 A), BSH (pane1 B) or without 10B compound (panel C), plotted as a function of the total kerma dosein the tumor including the boron component. he calculated data were obtained from Eq. (15) by setting P1= 1
and x1= 1, i.e., the heterogeneity of the intercellular 10B distribution was not considered in this calculation. he
agreements between the measured and calculated SF are quite satisfactory for BSH administrated and without 10B
compound cases, which were used in the LSq itting. On the other hand, our calculation underestimates the experimental data for BPA cases particularly at higher 10B concentrations. In addition, the dependence of the SF
on the 10B concentration is less signiicant in our calculated data. hese disagreements are probably attributable
to the ignorance of the heterogeneity of the intercellular 10B distribution as discussed later. At the same kerma
dose, the calculated SF for BPA cases are smaller than those for BSH cases because of the larger conversion factor from the kerma dose D to the mean cell-nucleus dose zn, owing to cell permeability of BPA.
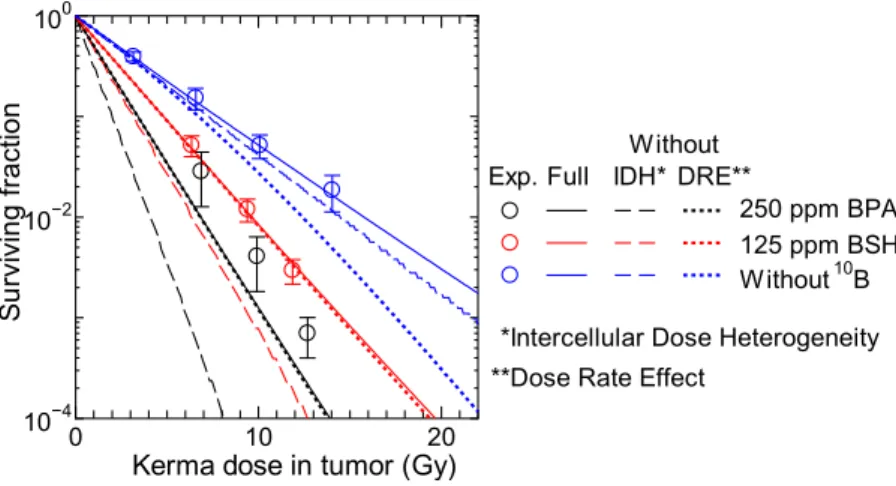
Except for the photon data, the β terms of the measured SF shown in Fig. 6 are very close to 0 or even negative, and our calculation can reproduce this tendency very well even using the same β0 parameter for all radiations. his is predominantly because our calculation considered the intercellular dose heterogeneity, which increases the SF for high-dose and high-LET irradiations. In addition, consideration of the dose rate efect also reduces β particularly for the data with longer irradiation time as indicated by Eq. (10). For example, the irradiation time T is roughly 9 hours and G calculated by Eq. (10) is approximately 0.05 for the highest-dose neutron beam irra-diation without 10B compound. For quantitative discussion, Fig. 7 shows the SF calculated without considering
the intercellular dose heterogeneity or the dose rate efect, in comparison with the corresponding data with full
Figure 5. Calculated z f zn n( ,n zn) for some experimental conditions obtained by numerically solving Eqs (5) and (6)
Figure 6. Measured and calculated SF for SCC VII squamous cell carcinomas administrated with (A) BPA, (B) BSH, and (C) without 10B compound, plotted as a function of total kerma dose in the tumor including the
boron component. hose cells were inoculated into mice and irradiated by neutron beam of KUR except for the
60Co γ-ray data shown in Panel (C). he heterogeneity of the intercellular 10B distribution is not considered in
consideration. It is evident from the graph that the consideration of the intercellular dose heterogeneity increases the SF very much particularly for 10B administrated cases because of their larger heterogeneity. On the other hand,
the dose rate efect has little inluence on the calculated SF for the 10B administrated cases because of two reasons;
it becomes less signiicant for higher dose rates, and it changes only quadratic coeicient of the LQ relationship as written in Eq. (9), while those data are predominantly determined by the linear coeicient. hese tendencies indicate that the consideration of the intercellular dose heterogeneity is indispensable to the estimate of the thera-peutic efect of BNCT, while that of the dose rate efect is desirable in the estimate of normal tissue complications with lower 10B concentration.
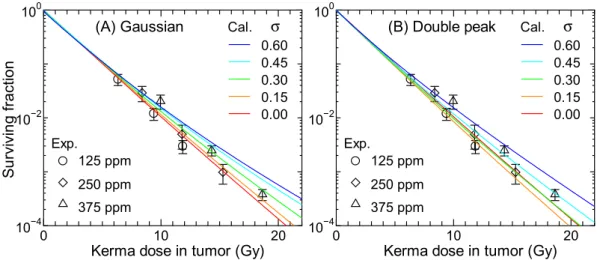
Figures 8 and 9 show the SF calculated for 250 ppm BPA and 125 ppm BSH, respectively, assuming that the intercellular heterogeneity of 10B concentrations can follow the Gaussian or double-peak distributions with the
standard deviation of σ. he corresponding experimental data including those for other 10B concentrations are
also shown in the igures. he data calculated for other 10B concentrations are nearly comparable to the plotted
data with the same σ, similarly to the data shown in Fig. 6. In general, the calculated SF increases with increasing σ particularly for the BPA data at higher doses because the intercellular dose heterogeneity becomes greater. he BSH data are less sensitive to σ than the BPA data because a large fraction of BSH localizes in the extracellular region whose 10B concentration is not afected by σ. he SF calculated for the same σ assuming the Gaussian and
double-peak distributions agrees fairly well with each other. Considering the quite diferent shapes between the Gaussian and double-peak distributions, this tendency indicates that the intercellular 10B distribution can roughly
be represented only by their standard deviation, irrespective of the form of the distribution.
As aforementioned, our calculation without considering the intercellular 10B distribution underestimates the
measured SF of cells administrated with BPA particularly at higher concentrations. In addition, the calculated
Figure 7. Calculated SF without considering the intercellular dose heterogeneity (IDH) or the dose rate efect (DRE), in comparison with the corresponding data with full consideration. Corresponding experimental data are also plotted in the graph.
Figure 8. Calculated SF for 250 ppm BPA (17 µg/g) obtained under assumption that the intercellular
heterogeneity of 10B concentrations can be expressed by the (A) Gaussian or (B) double-peak distributions with
the standard deviation of σ. he corresponding experimental data including those for other 10B concentrations
SF for higher BSH concentrations is also smaller than the corresponding experimental data to some extent. hese tendencies can be explained under assumption that σ of the intercellular 10B distribution increases with an
increase in its mean value, since the calculated data for higher σ agree with the experimental data at the higher ppm, as shown in Fig. 8. his assumption can be interpreted biologically if the maximum capacity for intake of
10B compounds would vary with each cell, such that some cells having less capacity might not incorporate
sui-cient 10B compounds than others when 10B compounds are administrated at a higher concentration. However, the
relation between the variance and mean of the intercellular 10B distribution has not been investigated, warranting
further studies to clarify this issue. It should be mentioned that cell cycle plays a very important role in determin-ing the intercellular 10B distribution21, and thus, the consideration of the cell cycle dependence of the radiation sensitivity is also desirable in our model for more precise estimation of SF.
RBE and CBE.
Figure 10 shows the RBE or CBE calculated for each dose component and for some experi-mental conditions as a function of the total kerma dose in the tumor including the boron component. he hetero-geneity of the intercellular 10B distribution was not considered in this calculation. CBE for an ideal 10B compoundthat can be homogeneously distributed inside cell including its nucleus is also drawn in the let panel. As for the terminological distinction between RBE and CBE, the latter is used only for expressing the biological efectiveness of the boron dose component in this paper because the contributions from other dose components should be excluded in the estimate of its numerical value, i.e. the biological efectiveness directly deduced from the experi-mental conditions is not CBE even for 10B administrated cases.
Figure 9. Calculated SF for 125 ppm BSH (17 µg/g) obtained under assumption that the intercellular
heterogeneity of 10B concentrations can be expressed by the (A) Gaussian or (B) double-peak distributions with
the standard deviation of σ. he corresponding experimental data including those for other 10B concentrations
are also shown in the graph.
Figure 10. Calculated RBE or CBE for each dose component (let) and for some experimental conditions (right) as a function of the total kerma dose in tumor including the boron component. CBE for an ideal 10B
hese data were obtained from the equation:
α α β
β
=
− γ+ γ − S
D RBE or CBE
4 ln( )
2 , (19)
2 0
0
where S is the SF for each dose component or experimental condition for the kerma dose D, and αγ is the α term
of the SF for the 60Co γ-ray irradiation, which was evaluated to be 0.0634 Gy−1 from Eq. (1). his equation implies
that the SF for the γ-ray irradiation can be simply expressed by the LQ model without considering the stochastic nature of zn. Experimentally determined RBE shown in the right panel of Fig. 10 were also obtained from Eq. (19),
considering the dose rate efect.
It is evident from the graphs that the calculated RBE and CBE decrease with increasing the kerma dose because the β term is not clearly observed in the calculated SF except for γ-ray irradiation due to the greater intercellular dose heterogeneity as discussed above. he dose rate efect also reduces the RBE and CBE for the experimental conditions. he CBE for BPA and BSH was smaller than that for the ideal 10B compound by factors
of approximately 1.2 and 1.8, respectively. his tendency is attributed to κB< 1 for both BPA and BSH owing to their impermeability of cell nucleus. hus, the therapeutic efect of BNCT would be much higher if a 10B
com-pound permeating cell nucleus could be developed. he lower RBE for the experimental condition without 10B
is due to the longer irradiation time as well as the higher dose fraction of the photon component; approximately 40% of the dose derived from the photon component when 10B was absent, whereas the fractions were generally
less than 10% when 10B was administrated.
Table 1 summarizes the calculated RBE or CBE at certain levels of SF – 50%, 10%, and 1% – for each dose component and experimental condition. As expected from Fig. 10, RBE and CBE decrease with decreasing SF. he RBE values of the experimental conditions for BPA and BSH cases are higher than the corresponding CBE values of the boron components, due to the existence of the synergetic efect in the experimental conditions. It should be mentioned that the kerma dose in the blood, which can be estimated from the 10B concentration in the
blood instead of tumor, is generally calculated as the physical dose in the BNCT treatment planning. hus, the calculated CBE data should be multiplied with the ratio of the 10B concentrations in tumor and blood when they
are used for estimating the therapeutic efect.
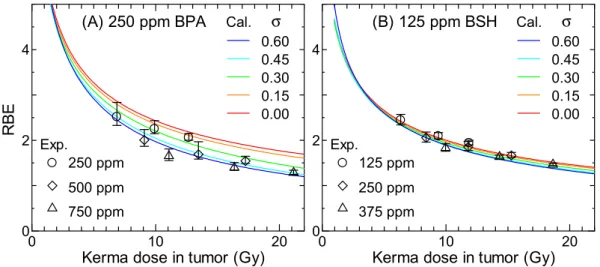
Figure 11 shows the calculated RBE for 250 ppm BPA and 125 ppm BSH considering the intercellular hetero-geneity in 10B distributions. he Gaussian distributions with the standard deviation σ were assumed in the
calcu-lation. he corresponding experimental data including those for other 10B concentrations are also shown in the
graphs. As expected from Figs 8 and 9, the calculated RBE decreases more dramatically with increasing the kerma dose at higher σ, particularly when BPA is administered. his tendency suggests that reduction of the variance of the intercellular heterogeneity in 10B distributions is important to maintain the higher therapeutic eicacy of high
dose irradiation, particularly for BPA.
RBE-weighted dose and photon-isoefective dose.
Figure 12 shows the calculated RBE-weighted doses and photon-isoeffective doses for 250 ppm BPA and 125 ppm BSH. As aforementioned, the term of “RBE-weighted dose” used for BNCT implies that RBE or CBE is independent of dose and dose rate. In this study, RBE and CBE at 10% SF, i.e., RBE10 and CBE10 shown in Table 1, were adopted for estimating the RBE-weighteddoses, and are thus proportional to the dose. In contrast, the photon-isoefective doses were estimated from the dose-dependent RBE and CBE as shown in Fig. 10. In both cases, we evaluated the data with or without consider-ing the synergetic efect, i.e., the total dose multiplied with CBE for the experimental condition, or the sum of the doses for each component multiplied with their own RBE or CBE. he RBE-weighted doses that were estimated from the RBE and CBE values adopted in the computational dosimetry system named JCDS1,34 are also drawn
RBE50 or CBE50 RBE10 or CBE10 RBE1 or CBE1
Dose component
Boron (BPA) 5.49 3.60 2.74 Boron (BSH) 3.55 2.33 1.76 Hydrogen 3.95 2.72 2.16 Nitrogen 4.07 2.78 2.21 Boron (ideal) 6.56 4.30 3.25
Experimental condition
BPA 250 ppm 5.79 3.74 2.81 BPA 500 ppm 5.80 3.75 2.82 BPA 750 ppm 5.79 3.75 2.81 BSH 125 ppm 4.09 2.65 1.99 BSH 250 ppm 4.05 2.62 1.97 BSH 375 ppm 4.02 2.60 1.96 without 10B 2.59 1.69 1.25
in the graphs, where CBE for the boron component were 3.8 and 2.5 for BPA and BSH, respectively, and RBE for both hydrogen and nitrogen components were 2.5. Note that JCDS was applied to the BNCT treatment planning of clinical trials conducted in Japan Atomic Energy Agency (JAEA).
he photon-isoefective dose is higher than RBE-weighted doses at lower kerma dose, whereas the reverse is true at higher kerma dose. he crossing point indicates the kerma dose to give 10% SF. he diference between the RBE-weighted and photon-isoefective doses becomes larger as the kerma dose increases. hus, the dose depend-ence of RBE and CBE should be taken into account in the BNCT treatment planning particularly for high dose irradiation, otherwise the therapeutic efect in comparison to photon therapy would be overestimated. his ten-dency conirms the conclusion previously obtained from other studies14,15, where the photon-isoefective doses derived from tumor control and normal tissue complication probabilities should be lower than the corresponding RBE-weighted doses, from the viewpoint of microdosimetry. he consideration of the synergetic efect enlarges both RBE-weighted and photon-isoefective doses because RBE for the experimental conditions is higher than CBE or RBE for each dose component, as shown in Table 1.
Figure 11. Calculated RBE for (A) 250 ppm BPA and (B) 125 ppm BSH considering the intercellular
heterogeneity in 10B distributions. he Gaussian distributions with the standard deviation σ were assumed in the
calculation. he corresponding experimental data including those for other 10B concentrations are also shown
in the graphs.
Conclusions
We have here developed a model for estimating the biological efectiveness of BNCT considering the intra- and intercellular heterogeneity in 10B distribution on the basis of the SMK model. he synergetic efect of mixed
radi-ation ields can also be taken into account in the model similarly to other cell inactivradi-ation models proposed for BNCT14. Four free parameters exist in the model, and in this study, their numerical values were determined from the LSq itting of the SF of tumor cells obtained from our previously reported in vivo/in vitro measurements using mice administrated with BPA or BSH. Our model can satisfactorily reproduce the measured SF as well as their associated RBE and CBE in various experimental conditions. Our model quantitatively veriied that the consider-ations of the synergetic efect and the dose dependence of RBE and CBE are very important in the estimate of the therapeutic efect of BNCT. he model is planned to be implemented into a research version of our developing treatment planning system, Tsukuba plan35, in the near future. For that purpose, the SMK model parameters not only for tumor but also for normal tissue cells must be evaluated because the estimate of normal tissue complica-tions is as important as that of the therapeutic efect in the treatment planning, particularly in the determination of irradiation time. Note that the applications of our model to the estimate of normal tissue complications are limited to those attributable to cell inactivation, such as acute skin reactions36.
A unique feature of our model is that it can predict the biological efectiveness of newly developed 10B
com-pounds based on their intra- and intercellular heterogeneity. For example, our model suggests that the realiza-tion of an ideal 10B compound that is homogeneously distributed in the whole cell would enlarge the biological
efectiveness by factors of approximately 1.2 and 1.8 in comparison to those of BPA and BSH, respectively. he intercellular homogeneity is also expected to be important to keep the higher therapeutic efect of high dose irra-diation, otherwise CBE suddenly drops with increasing dose. Owing to this feature, our model can play important roles not only in the treatment planning but also in developing new 10B compounds used for future BNCT. More
precise measurement of the intra- and intercellular 10B distributions is the key issue for applying our model to the
drug discovery research.
References
1. Kumada, H. et al. Veriication of the computational dosimetry system in JAERI (JCDS) for boron neutron capture therapy. Phys. Med. Biol.49, 3353–3365 (2004).
2. Hopewell, J. W., Morris, G. M., Schwint, A. & Coderre, J. A. he radiobiological principles of boron neutron capture therapy: A critical review. Appl. Radiat. Isotopes69, 1756–1759 (2011).
3. Bond, V. P., Varma, M. N., Sondhaus, C. A. & Feinendegen, L. E. An Alternative to Absorbed Dose, Quality, and RBE at Low Exposures. Radiat. Res.104, S52–S57 (1985).
4. Gabel, D., Foster, S. & Fairchild, R. G. he Monte-Carlo Simulation of the Biological Efect of the B-10(N,Alpha)Li-7 Reaction in Cells and Tissue and Its Implication for Boron Neutron-Capture herapy. Radiat. Res.111, 14–25 (1987).
5. van Vliet-Vroegindeweij, C., Wheeler, F., Stecher-Rasmussen, F., Moss, R. & Huiskamp, R. Microdosimetry model for boron neutron capture therapy: I. Determination of microscopic quantities of heavy particles on a cellular scale. Radiat. Res.155, 490–497 (2001). 6. Horiguchi, H., Sato, T., Kumada, H., Yamamoto, T. & Sakae, T. Estimation of relative biological efectiveness for boron neutron
capture therapy using the PHITS code coupled with a microdosimetric kinetic model. J. Radiat. Res.56, 382–390 (2015). 7. Hopewell, J. W., Morris, G. M., Schwint, A. E. & Coderre, J. A. Neutron Capture herapy, Principles and Applications, 17: Boron
Neutron Capture herapy: Application of Radiobiological Principles (Eds Sauerwein, W.A.G., Wittig, A., Moss, R., & Nakagawa, Y.), 329–358 (Springer, 2012).
8. Morris, G. M., Coderre, J. A., Hopewell, J. W., Micca, P. L. & Rezvani, M. Response of Rat Skin to Boron Neutron-Capture herapy with P-Boronophenylalanine or Borocaptate Sodium. Radiother. Oncol.32, 144–153 (1994).
9. Ono, K. An analysis of the structure of the compound biological efectiveness factor. J. Radiat. Res.57, I83–I89 (2016).
10. Santa Cruz, G. A. & Zamenhof, R. G. he microdosimetry of the B-10 reaction in boron neutron capture therapy: A new generalized theory. Radiat. Res.162, 702–710 (2004).
11. Sato, T. & Furusawa, Y. Cell Survival Fraction Estimation Based on the Probability Densities of Domain and Cell Nucleus Speciic Energies Using Improved Microdosimetric Kinetic Models. Radiat. Res.178, 341–356 (2012).
12. Zaider, M. & Rossi, H. H. he Synergistic Efects of Diferent Radiations. Radiat. Res.83, 732–739 (1980).
13. Phoenix, B. et al. Do the various radiations present in BNCT act synergistically? Cell survival experiments in mixed alpha-particle and gamma-ray ields. Appl. Radiat. Isotopes67, S318–S320 (2009).
14. González, S. J. & Santa Cruz, G. A. he Photon-Isoefective Dose in Boron Neutron Capture herapy. Radiat. Res.178, 609–621 (2012).
15. Gonzalez, S. J. et al. Photon iso-efective dose for cancer treatment with mixed ield radiation based on dose-response assessment from human and an animal model: clinical application to boron neutron capture therapy for head and neck cancer. Phys. Med. Biol.
62, 7938–7958 (2017).
16. Hawkins, R. B. A microdosimetric-kinetic model of cell death from exposure to ionizing radiation of any LET, with experimental and clinical applications. Int. J. Radiat. Biol.69, 739–755 (1996).
17. Sato, T., Watanabe, R. & Niita, K. Development of a calculation method for estimating speciic energy distribution in complex radiation ields. Radiat. Prot. Dosim.122, 41–45 (2006).
18. Sato, T., Kase, Y., Watanabe, R., Niita, K. & Sihver, L. Biological Dose Estimation for Charged-Particle herapy Using an Improved PHITS Code Coupled with a Microdosimetric Kinetic Model. Radiat. Res.171, 107–117 (2009).
19. Sato, T., Watanabe, R., Sihver, L. & Niita, K. Applications of the microdosimetric function implemented in the macroscopic particle transport simulation code PHITS. Int. J. Radiat. Biol.88, 143–150 (2012).
20. Sato, T. et al. Particle and Heavy Ion Transport code System, PHITS, version 2.52. J. Nucl. Sci. Technol.50, 913–923 (2013). 21. Yoshida, F. et al. Cell cycle dependence of boron uptake from two boron compounds used for clinical neutron capture therapy.
Cancer Lett.187, 135–141 (2002).
22. Masunaga, S. et al. he dependency of compound biological efectiveness factors on the type and the concentration of administered neutron capture agents in boron neutron capture therapy. Springerplus3, 128 (2014).
23. Kellerer, A. M. & Rossi, H. H. A generalized formation of dual radiation action. Radiat. Res.75, 471–488 (1978). 24. International Commission on Radiation Units and Measurements. Microdosimetry. ICRU Report 36, (1983).
25. Sato, T. & Hamada, N. Model Assembly for Estimating Cell Surviving Fraction for Both Targeted and Nontargeted Efects Based on Microdosimetric Probability Densities. PLOS ONE9, e0114056 (2014).
27. Inaniwa, T. et al. Efects of Dose-Delivery Time Structure on Biological Efectiveness for herapeutic Carbon-Ion Beams Evaluated with Microdosimetric Kinetic Model. Radiat. Res.180, 44–59 (2013).
28. Sato, T., Manabe, K. & Hamada, N. Microdosimetric Analysis Conirms Similar Biological Efectiveness of External Exposure to Gamma-rays and Internal Exposure to 137Cs, 134Cs, and 131I. PLOS ONE9, e99831 (2014).
29. Ono, K. et al. he combined efect of boronophenylalanine and borocaptate in boron neutron capture therapy for SCCVII tumors in mice. Int. J. Radiat. Oncol. Biol. Phys.43, 431–436 (1999).
30. Michiue, H. et al. he acceleration of boron neutron capture therapy using multi-linked mercaptoundecahydrododecaborate (BSH) fused cell-penetrating peptide. Biomaterials35, 3396–3405 (2014).
31. Capala, J., Makar, M. S. & Coderre, J. A. Accumulation of boron in malignant and normal cells incubated in vitro with boronophenylalanine, mercaptoborane or boric acid. Radiat. Res.146, 554–560 (1996).
32. Sakurai, Y. & Kobayashi, T. Characteristics of the KUR Heavy Water Neutron Irradiation Facility as a neutron irradiation ield with variable energy spectra. Nucl. Instrum. Meth. A453, 569–596 (2000).
33. Ogawa, T., Sato, T., Hashimoto, S. & Niita, K. Development of a reaction ejectile sampling algorithm to recover kinematic correlations from inclusive cross-section data in Monte-Carlo particle transport simulations. Nucl. Instrum. Meth. A763, 575–590 (2014).
34. Nakai, K. et al. Feasibility of boron neutron capture therapy for malignant spinal tumors. Appl. Radiat. Isotopes67, S43–S46 (2009). 35. Kumada, H. et al. Veriication of nuclear data for the Tsukuba plan, a newly developed treatment planning system for boron neutron
capture therapy. Appl. Radiat. Isotopes106, 111–115 (2015).
36. Foray, N., Bourguignon, M. & Hamada, N. Individual response to ionizing radiation. Mutat. Res.770, 369–386 (2016).
Author Contributions
T.S. designed the research and wrote the paper; T.S. conducted all calculations and analysis of data; T.S. and S.M. reevaluated the experimental data; S.M. and H.K. adjusted the model suitable for BNCT; N.H. made biological considerations on the calculation; all authors contributed to the manuscript.
Additional Information
Competing Interests: he authors declare that they have no competing interests.
Publisher's note: Springer Nature remains neutral with regard to jurisdictional claims in published maps and institutional ailiations.
Open Access This article is licensed under a Creative Commons Attribution 4.0 International License, which permits use, sharing, adaptation, distribution and reproduction in any medium or format, as long as you give appropriate credit to the original author(s) and the source, provide a link to the Cre-ative Commons license, and indicate if changes were made. he images or other third party material in this article are included in the article’s Creative Commons license, unless indicated otherwise in a credit line to the material. If material is not included in the article’s Creative Commons license and your intended use is not per-mitted by statutory regulation or exceeds the perper-mitted use, you will need to obtain permission directly from the copyright holder. To view a copy of this license, visit http://creativecommons.org/licenses/by/4.0/.