sustainability
ISSN 2071-1050 www.mdpi.com/journal/sustainability ArticleDevelopment of a Framework for the Evaluation of the
Environmental Benefits of Controlled Traffic Farming
Abdul Mounem Mouazen * and Martin Palmqvist
Cranfield Soil and AgriFood Institute, Cranfield University, Cranfield, MK43 OAL Bedford, UK; E-Mail: [email protected]
* Author to whom correspondence should be addressed; E-Mail: [email protected]; Tel.: +44-1234-750-111; Fax: +44-1234-752-971.
Academic Editor: Tiziano Gomiero
Received: 21 May 2015 / Accepted: 29 June 2015/ Published: 3 July 2015
Abstract: Although controlled traffic farming (CTF) is an environmentally friendly soil management system, no quantitative evaluation of environmental benefits is available. This paper aims at establishing a framework for quantitative evaluation of the environmental benefits of CTF, considering a list of environmental benefits, namely, reducing soil compaction, runoff/erosion, energy requirement and greenhouse gas emission (GHG), conserving organic matter, enhancing soil biodiversity and fertiliser use efficiency. Based on a comprehensive literature review and the European Commission Soil Framework Directive, the choice of and the weighting of the impact of each of the environmental benefits were made. The framework was validated using data from three selected farms. For Colworth farm (Unilever, UK), the framework predicted the largest overall environmental benefit of 59.3% of the theoretically maximum achievable benefits (100%), as compared to the other two farms in Scotland (52%) and Australia (47.3%). This overall benefit could be broken down into: reducing soil compaction (24%), tillage energy requirement (10%) and GHG emissions (3%), enhancing soil biodiversity (7%) and erosion control (6%), conserving organic matter (6%), and improving fertiliser use efficiency (3%). Similar evaluation can be performed for any farm worldwide, providing that data on soil properties, topography, machinery, and weather are available.
1. Introduction
The high demand on food has resulted in increasing the size and weight of agricultural machinery, which has led to higher risk to soil damage and more energy has to be dedicated to cure this damage. The soil damage by agricultural machinery contributes considerably to deepen soil environmental threats, namely, compaction, erosion, increase greenhouse gas (GHG) emission and others. Therefore, soil has to be managed properly to ameliorate the damage, either by mechanical forces e.g., tillage, optimising machine parameters, e.g., reduced tyre inflation pressure or by appropriate management of traffic over the soil. The latter has recently attracted the attention of researchers and farmers. An underestimation of the field area trafficked during one crop cycle is common due to the eradication of wheel tracks by the following tillage. Typically, under conventional tillage with random traffic (RT), almost all field area is trafficked by wheels at least once every year [1]. However, in the last decades, farmers have attempted to concentrate field traffic on temporary or permanent tramlines [2,3].
Controlled farming system (CTF) ensures the crop zone is permanently separated from the traffic zone year after year [4]. It aims at keeping field traffic in the same lanes on the field every year [5]. Thus, the larger bearing capacity of the compacted traffic lanes improves the ability to drive on and the crop zone tends to stay in favourable conditions for growth without the need for deep tillage [4]. There are different ways to implement CTF, consistent for all is the simple principle to not drive at random on the soil [6]. Different guidance systems have been used in CTF to keep the wheels exactly in the same positions from year to year, ranging from concrete tracks [7] to electrical wires and physical markers [8]. However, the recent development of cost effective global positioning systems (GPS) has made it easy to adopt a precise CTF system on farm scale [9,10]. Although CTF has been advocated a long time by scientists in a number of countries, adoption of the new system on large scale has been rare, with one possible exception in Central Queensland, Australia, were over 100,000 ha was converted to CTF over a five year period [10]. This might be attributed to lack of studies, which provide quantitative evaluation of economic and environmental benefits of CTF.
decrease in soil BD and PR when adopting CTF. Botta et al., 2007 [18] observed peak PR and BD under the third year of RT, reaching levels up to 3890 kPa and 1.72 Mg m−3, respectively, as compared to corresponding CTF peaks of 2556 kPa and 1.53 Mg m−3. As a result of compaction amelioration by the adoption of CTF, Meek et al.,1989 and 1990 [19,20] reported improvement of the infiltration rate in cotton production. No tillage combined with CTF retained the highest infiltration rates during the following cotton season, which was probably due to better preservation of macro pores [20]. Similarly, McHugh et al., 2003 [21] experienced a four-fold increase of hydraulic conductivity at 10 cm depth after 22 months of CTF practice in broad acre arable land in Australia. The effect of CTF on water erosion was examined in a number of studies mainly in Australia. Results ranged from a reduction in runoff reaching to 36.3%, which increased to 47.2% when CTF was combined with no tillage (Li et al.,2007), to almost no change in runoff at all [22]. Tullberg et al., 2001 [23] found 44% larger runoff from trafficked plots than from CTF plots. Concerning biodiversity, reports confirmed CTF to increase the number of macrofouna. Pangnakorn et al.,2003 [24] found the number of earthworms to be larger under CTF than under RT, with the highest number tending to occur under no tillage combined with CTF. Literature has not proved that CTF can alleviate soil organic matter (SOM) decline. Potter and Chichester (1993) [25] concluded that no tillage combined with CTF appears to be a longterm sustainable solution. They showed an increase in soil organic carbon when soil was not disturbed by primary tillage. Steadily greater nitrogen content in the CTF swards has resulted in more efficient use of fertiliser than in conventionally farmed plots. As proportion of the nitrogen fertiliser applied, the nitrogen content of the yield was 86% and 64%, for CTF and RT, respectively, nonetheless a reduced ground pressure treatment was almost as good as CTF with 81% of the nitrogen applied being harvested [26]. Soil compaction has a large influence on N2O emission, mainly due to increased anaerobic conditions [27,28]. However, the quantity of released gas is also related to crop and environmental conditions [29]. Vermeulen et al., 2007 [30] evaluated the impact of seasonal controlled traffic farming (SCTF) on GHG emission, adopting RT during harvest and primary tillage followed by all the other traffic in controlled traffic lanes. They concluded that SCTF resulted in reduction of both N2O and CH4 emission as compared to total RT farming.
Models to evaluate the impact of tillage and traffic on crop production are available. For instance the advanced PERFECT model was used by Li et al., 2008 [31,32] to predict runoff, plant available water, infiltration rate and yield. Using PERFECT, Li et al.,2008 [31,32] ranked the benefits of tillage systems to be in the following descending order: controlled traffic with zero tillage, controlled traffic with stubble mulch, wheeled with zero tillage, and wheeled with stubble mulch. However, this model does not include all environmental benefits and does not rank them among each other. Furthermore, no overall scoring model for the entire environmental benefits of CTF can be found in the literature. Hamza and Anderson (2005) [33] only listed a range of environmental benefits, without ranking them according to their weight. It can be concluded from the brief literature review that although reports support the environmental benefits of CTF, a quantification of the overall environmental benefits of CTF has not been reported so far.
2. Materials and Methods 2.1. Framework Weighting
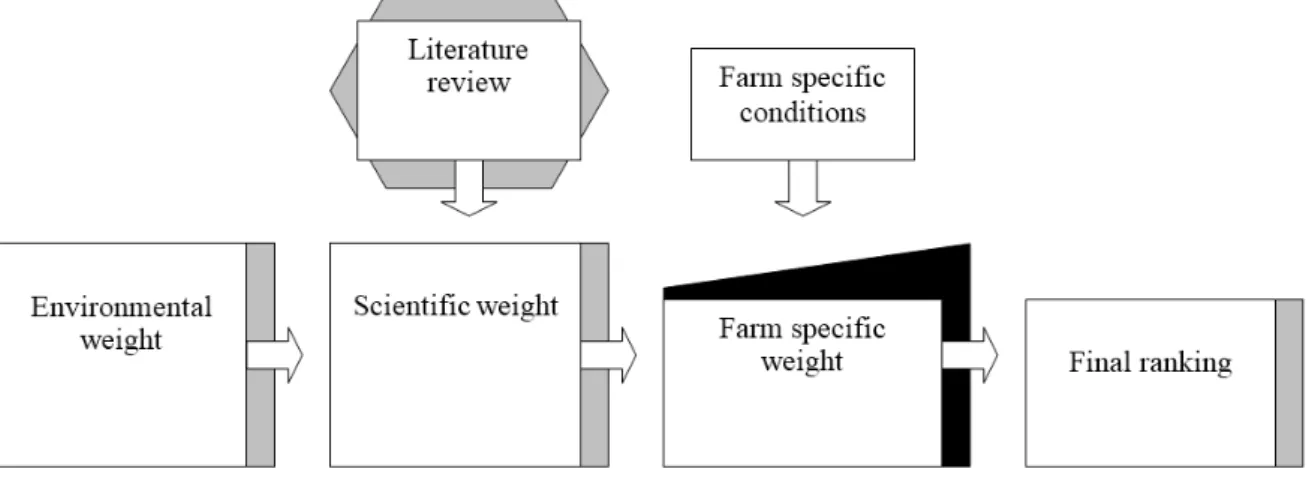
When establishing the prediction framework to rank the environmental benefits of CTF, several environmental threats were identified as key threats needed for the successful development of the matrix. The development of the prediction framework was based on three weighting systems, namely, environmental, scientific, and farm specific parameters (Figure 1). The framework was established based on a number of assumptions:
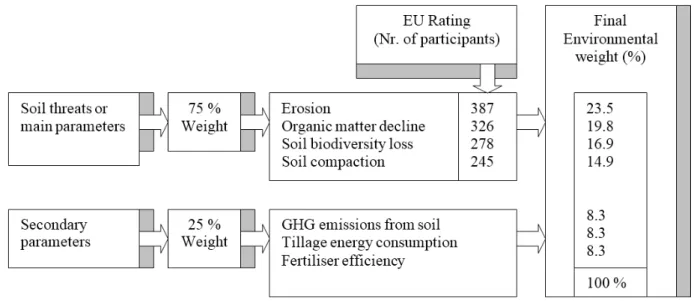
Environmental weight: Here 75% of weighting was assigned to soil threats and 25% for secondary issues. The importance of each of the soil threats was obtained from answers to a survey questionnaire carried out by the EU.
Scientific weight: Here also 75% of weighting was assigned to soil threats and 25% for secondary issues. The importance of each soil threat was evaluated based on the number of studies found in the literature confirming the positive or negative influence of the CTF relative to the random traffic. The magnitude of CTF benefit was calculated based on the % of benefit (e.g., in energy saving), as compared to random traffic.
Probability of occurrence and scale of problem is estimated by ten parameters, which are given two levels of internal weight/influence.
Figure 1. The general structure of the framework for the calculation of the environmental benefits of controlled traffic farming (CTF).
The framework was built using Microsoft Excel, to ensure that the framework was flexible and easily amendable, as a complex model is harder to develop, understand, and validate [34].
Furthermore, a critical requirement when developing scoring functions in functional models is to document why a particular value was chosen as baseline or threshold value. Therefore, a thorough search and documentation of farm specific parameters and their ranges to be considered in this framework was undertaken.
salinisation, soil biodiversity loss, sealing, landslides, and flooding. It was prepared after a web survey provided by soil scientists and research organisations. In this study, only environmental threats that are directly affected by implementing CTF were considered. These were ranked in the Framework Directive in dissenting order as; soil compaction, soil erosion, soil biodiversity loss, and soil organic matter decline. This ranking system was incorporated into the framework, and these soil threats were considered as the main environmental parameters.
Other parameters with indirect environmental benefits of CTF were identified as secondary environmental parameters, such as reduced GHG emissions from soil, reduced energy requirement of tillage, and increased fertiliser efficiency. However, these secondary parameters were not included in the EC Soil Framework Directive. The secondary parameters were assigned a weighting of 25% of the total environmental weighting to be divided equally among them, whereas the remaining 75% weighting was assigned to the main environmental parameters (soil threats). The structure of the environmental weighting part of the framework is illustrated in Figure 2.
Figure 2. Environmental weighing system of prediction framework of environmental benefits of controlled traffic farming (CTF).
Scientific Weighting. A comprehensive literature review on CTF has been carried out to evaluate the scientific weighting based on the number of studies reported with positive effect in reducing the level of any of the main or secondary environmental parameters. Many journal papers, reports, and books on CTF were closely examined. However, a much larger number of studies available on e.g., soil compaction under RT can be found in the literature, which was not included in the scientific weighting of the framework. The reader is referred to the Appendix for more details about the studies used to calculate the weighting factors.
75% of the total scientific weighting, whereas the secondary parameters were given a total weighting of 25%. The structure of the scientific weighting part of the framework is illustrated in Figure 3.
Figure 3. Scientific weighing system of prediction framework of environmental benefits of controlled traffic farming (CTF).
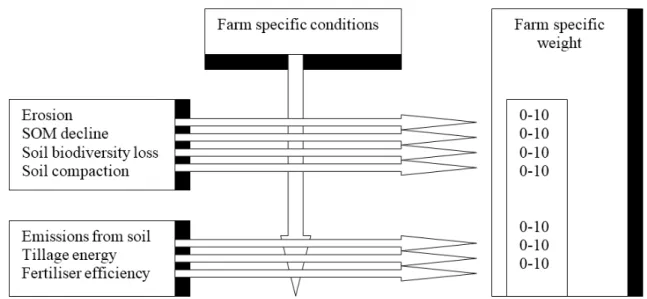
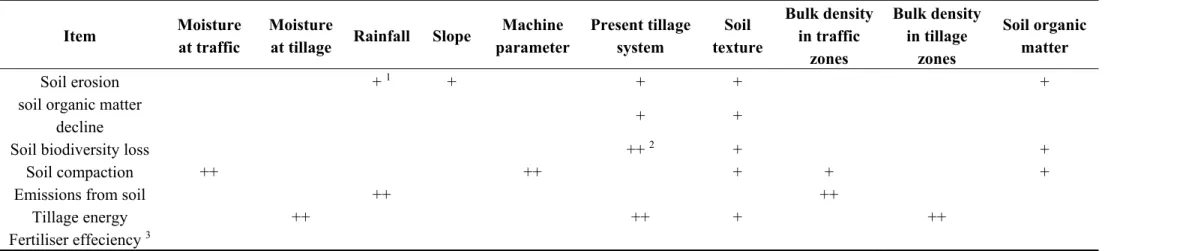
Weighting of Farm Specific Parameters. The parameters considered as farm specific parameters were those related to selected soil properties, climate conditions, topography, and existing machinery system in the farm. These were soil moisture content at traffic and at tillage, annual rainfall, slope length and steepness, machine parameters, present tillage system (no tillage, reduced tillage and conventional tillage), soil texture, BD at traffic and at tillage, and SOM content. Each parameter was given a weighting factor ranged between 0 and 10, which affects the final ranking of the environmental benefits. The structure of the farm specific part of the framework is illustrated in Figure 4. Each farm specific parameter was assigned one or two +, based on its impact on soil threats and on secondary parameters (Table 1).
Table 1. Impact of farm specific parameters.
Item Moisture
at traffic
Moisture
at tillage Rainfall Slope
Machine parameter
Present tillage system
Soil texture
Bulk density in traffic
zones
Bulk density in tillage
zones
Soil organic matter
Soil erosion + 1 + + + +
soil organic matter
decline + +
Soil biodiversity loss ++ 2 + +
Soil compaction ++ ++ + + +
Emissions from soil ++ ++
Tillage energy ++ ++ + ++
Fertiliser effeciency 3
A parameter having a major influence scored two +, whereas a parameter having minor influence scored one + only. This impact categorisation was based on information available in the literature concerning CTF, as described here below.
Moisture Content at Traffic and at Tillage. The effect of soil moisture content on compaction occurrence is difficult to predict, since this is also dependent on soil texture, BD, and organic matter content. Based on the Proctor test, literature has shown optimal moisture contents for compaction occurrence, which varies with soil texture [36]. For simplicity, gravimetric soil moisture content was classified, with a linear scale into four different categories. In general, the wetter the soil at traffic, the lower is the soil resistance to compaction occurrence. Also, the dryer the soil at tillage, the higher is the draught and energy requirement of tillage. Based on these four categories a simple classification system of the framework impact points for moisture content, similar to that proposed by Spoor et al., 2003 [37] was adopted (Table 2).
Table 2. Impact points of moisture content.
Wetness Condition Impact Points
Wet (close to field capacity) 10
Moist 7 Dry (approaching permanent wilting point) 4
Very dry 0
If the framework is to be more precise in defining the exact trend of compaction occurrence according to soil moisture content during traffic for different soil textures, a more complicated function that correlates soil compaction occurrence with moisture content has to be adopted based on experimental data. Nonetheless, both moisture contents at traffic and at tillage are classified according to Table 2, with the moisture content at traffic has a negative effect on soil compaction occurrence, whereas soil moisture content at tillage has a positive effect on energy consumption due to tillage operations.
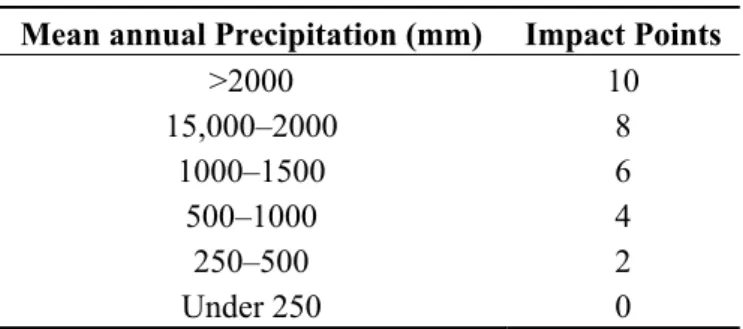
Rainfall. The mean annual precipitation was considered in the framework as the factor affecting erosion. High precipitation can also lead to increased soil moisture content, which in turn leads to increased GHG emission under anaerobic conditions. The scale of conversion proposed was linear with the exception of a smaller step at the lowest precipitation to distinguish the places with very low rainfall (Table 3).
Table 3. Impact points of rainfall.
Mean annual Precipitation (mm) Impact Points
>2000 10 15,000–2000 8
1000–1500 6 500–1000 4
Slope. The impact points for slope (SL) designated as slope factor (SF) were calculated in a similar way to that of the universal soil loss equation (USLE) method, by substituting the values of average slope steepness and length into Equation (1).
(SF) = (0.065 + 0.045S + 0.0065S2) × (L/22) n (1)
where: SF is slope factor, S is slope steepness (%), L is slope length (m) and n is a constant calculated according to the slope value (Table 4)
Table 4. Values of constant n for different values of slope.
Slope (%) <1 1 < Slope < 3 3 < Slope < 5 >5
n 0.2 0.3 0.4 0.5
The final weighting scale was transformed into a framework of impact points using SF values calculated from Equation (1), and reported in Table 5.
Table 5. Impact points of slope.
Slope Factor Impact Points
> 1.5 10
1.0–1.5 7 0.5–1.0 4
< 0.5 0
Machine Parameters. No precise relationship between axle load and soil compaction exists, probably because of the fact that there are many other factors affecting soil compaction occurrence. However, practical experience (thanks to the anonymous reviewer) showed a large axle load of 18 Mg to cause severe yield losses (at least 10%), whereas a 9 Mg load caused only short term damage to the soil and minor yield loss. Therefore, farms with light loads are less likely to benefit from CTF and less likely to adopt it regardless of environmental benefits.
The relative importance of tyre inflation pressure and axel load has been disputed for a long time [38]. The combination determines the compaction level, although the severity of compaction declines with depth. However, it is a challenge to create a simple model that can predict the actual level of compaction, as related to axle load and inflation pressure, since there is still an inter-correlation between those factors and other factors [38]. In the framework, the impact of the axle load and tyre inflation pressure during one crop cycle was considered.
The scale for this framework was based on a simple “rule of thumb” that the soil can withstand compaction damage from axle loads up to 6 Mg and 7.5 Mg at inflation pressure values of 150 kPa and 100 KPa, respectively [39]. From those two values, a linear regression was carried out to derive a matrix (not shown) about the impact of both tyre inflation pressure and axle load, which was used to derive the framework impact points.
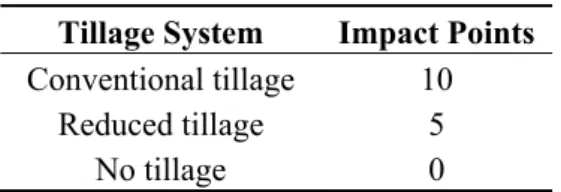
with at least three passages. Reduced tillage involves shallow tillage followed by drilling, whereas no tillage consists of only direct drilling of soil.
Texture. The classification of texture considered in this study was based on FAO standard triangle soil texture classification. A scale of soil vulnerability to compaction proposed by Spoor et al., 2003 [37] formed the basis to establish impact points of different textures (Table 7). For example, clay soils were considered less vulnerable to compaction when compared to sandy soils at a same moisture content level.
Table 6. Impact points of tillage system.
Tillage System Impact Points
Conventional tillage 10 Reduced tillage 5
No tillage 0
Table 7. Impact points of soil texture.
Texture (FAO–UNESCO) Impact Points
Light soils
Coarse Medium (<18% clay) Medium fine (<18% clay)
10
Medium soils Medium (>18% clay)
Medium fine (>18% clay) 5 Heavy soils Fine
Very fine 0
Bulk Density at Traffic and at Tillage. Soil BD is a measure of soil compaction, which unlike PR is independent on moisture content at sampling [40]. Therefore, BD was adopted, since it is a more reliable measurement for establishing the scale of impact points. Furthermore, soil texture had to be taken into account, since BD is a function of soil texture [41]. The impact points scale, provided in Table 8 was based on a guideline for seedbed compaction [42], where BD has a different impact depending on the soil type considered. The limiting BD for root growth generally ranges from 1.45 Mg m−3 for clay soils to 1.85 Mg m−3 for loamy sands [41], which proves that Table 8 is of the correct magnitude.
Table 8. Impact points of bulk density (BD).
Bulk Density (Mg m−3) Impact Points
Light (Sandy) Soils Medium (Loams) Heavy (Clay) Soils
> 1.8 10 - -
1.6–1.8 8 10 10
1.4–1.6 5 5 8
1.2–1.4 1 3 5
< 1.2 0 1 3
Table 9. Impact points of soil organic matter (SOM).
Soil Organic Matter Content (%) <0.5 0.5–1.5 1.5–2.5 2.5–3.5 3.5–4.5 4.5<
Impact points 10 8 6 4 2 0
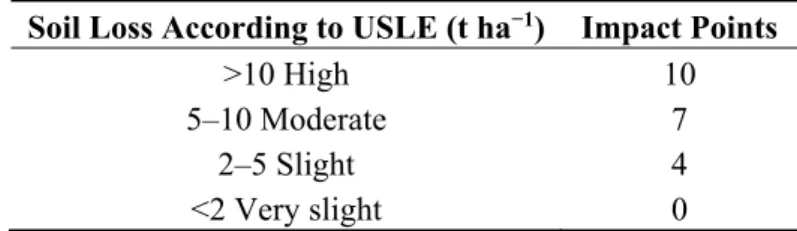
Erosion Factor Using USLE. The USLE is an empirical model to calculate soil erodability as a function of dimension and dimensionless factors. However, if metric units are used to obtain the rainfall erosivity factor, a metrical value of soil loss will be derived according to the following equation [44].
E = R × K × L × S × C × P (2)
where: E is the mean annual soil loss according to USLE (Mg ha−1), R is the rainfall erosivity factor (MJ ha−1 mm h−1), K is the soil erodibility factor, L × S is the slope factor, C is the crop management factor and P is the erosion control practice factor.
A USLE value estimating soil loss for a site or a field can be transformed into a framework point, as shown in Table 10, which was constructed after a classification proposed by Morgan (2005) [44]. When USLE is to be considered, the individual weight of the other factors involved in the calculation of the erosion factor has to be omitted from the matrix. This included rainfall, slope, soil organic matter and texture. In this case, the impact of moisture content at traffic and at tillage, machine parameters, present tillage system, bulk density at traffic and at tillage, and erosion factor using USLE were only considered.
Table 10. Impact points of universal soil loss equation (USLE).
Soil Loss According to USLE (t ha−1) Impact Points
>10 High 10 5–10 Moderate 7
2–5 Slight 4 <2 Very slight 0
2.2. Effect of Farm Specific Parameters on Environmental Threats and Secondary Parameters
Soil Organic Matter Decline. It is a challenge to find consistent data on factors affecting SOM decline. This is because some researchers suggested that no tillage systems might increase SOM content [45], whereas others stated that SOM is just relocated with depth [46,47]. However, the predominant result after a comprehensive evaluation of a large number of studies worldwide suggested that no tillage and reduced tillage systems, in descending order, increase SOM [48]. In conclusion, the present tillage system was regarded in the present study to have a minor influence (one +) on SOM decline. Even though, no literature about a high declining rate of SOM was found for any soil texture, texture was regarded as having a minor effect on SOM decline in the framework. This is because of the important water holding capacity and aggregate building capability and stability of SOM, which is particularly important for sandy soils. In fact, SOM decline is a larger problem on sandy than on clayey soils.
Soil Biodiversity. The incidence of occurrence of earthworms was studied by Pangnakorn et al., 2003 [24], who found that absence of tillage had a large positive effect on the occurrence. Also, fungal and bacterial biomasses were higher in surface soil when less disturbed by tillage [49]. Thus, the present tillage system was regarded as being a major influencing factor on soil biodiversity. In a model used by Fox et al., 2004 [50], the number of earthworms was positively correlated with increasing SOM and clay content. Consequently, soil biodiversity decline can be regarded as being a bigger problem in sandy soils with low organic matter. Therefore, texture and SOM were considered to have a minor influence on soil biodiversity in the framework.
Soil Compaction. The fact that soil compaction is, to a large extent, affected by the moisture content of the soil during traffic and by machine parameters (size, tyre inflation pressure, etc.) is well accepted and also supported by researchers [33]. Therefore, these parameters were regarded to have the major effect (two +) on soil compaction. Since SOM has marginal influence on compaction [33] it was considered to have only a minor effect in the framework. The vulnerability to soil compaction is also, to some extent, affected by soil texture [37,51]. However, texture was considered to have a minor effect in the framework. Initial BD at traffic also affects the degree of soil compaction occurrence. Furthermore, a low BD at traffic that occurs after tillage makes soil more vulnerable to compaction [52]. Therefore, BD at traffic was considered to have a minor influence (one +) in the framework. The same arguments apply to the present tillage system. The higher the intensity of tillage the higher is the soil vulnerability to compaction. However, it is not common to use these three tillage systems worldwide. For instance, Munkholm et al., 2003 [53] indicated the low adoption of reduced tillage systems and no tillage in Scandinavia, which was partly attributed to major problems associated with compaction of the topsoil. Therefore, no influence of the tillage system on soil compaction occurrence was assigned in the framework.
Greenhouse Gas (GHG) Emission from Soil. Since soil compaction and soil moisture content have a large effect on N2O emissions from soil [29], soil BD at traffic and annual rainfall were regarded as having a major influence (two +) on GHG emissions from soil. The relationship between emissions and tillage practices is not clear and rather complicated. The common idea is that a no tillage system sequesters carbon but this might be offset by a higher level of N2O emissions [29,54]. Therefore, no influence of the tillage system on GHG emission was assigned in the framework.
tillage requires higher energy. It has been demonstrated that a higher moisture content resulted in a lower draught [55,57]. Thus, soil moisture content at tillage was considered to be a major influencing factor. Since clay soils (heavy soils) require higher energy to break up during tillage than sandy soils (light soils) [43], soil texture was considered to have a minor effect on energy consumption by tillage.
Fertiliser Use Efficiency. The benefit of fertiliser use efficiency was given an average value of five, which means that the benefit of CTF is regarded equally high regardless of how the user specifies the other parameters.
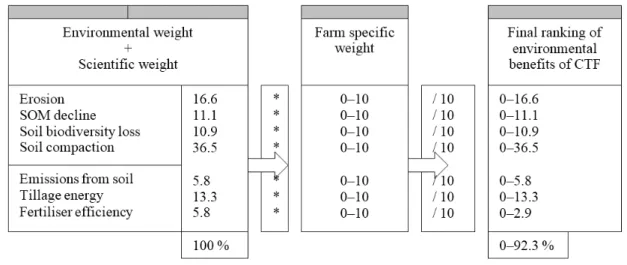
Construction of the Framework. The two different weighting parts, namely, environmental and scientific were combined in the excel-sheet framework, as shown in Figure 5. The percentage for each individual benefit was then multiplied by the weighting of the farm specific parameters (0–10). The sum of the individual values after dividing by 10 becomes 92.3%.
Figure 5. Calculation of the overall ranking of the framework.
This percentage was considered to be the maximum achievable environmental benefit at optimal soil and climate conditions, for topography and machinery systems for eliminating or reducing probability of occurrence of soil threats, and for secondary environmental parameters. For example, light rain, small slopes, small size agricultural machinery, stable aggregate soils and texture, etc. would result in reducing the probability of the occurrence of soil threats (e.g., soil erosion or compaction). However, the prevention of occurrence of soil threats is not practically possible and thus the maximum benefit level of 92.3% is not achievable. Therefore, this maximum benefit level was designated as “the theoretical maximum environmental benefit of CTF”.
The constant impact points assigned to the fertiliser efficiency (5), and the contradictory positive and negative impacts of soil moisture content during tillage and compaction is the reason for having a theoretical maximum of 92.3% instead of 100%. To overcome this issue, each individual benefit was rescaled in order to have the final evaluation presented to 100%, allowing the evaluation to range between 0 and 100%.
3. Sensitivity Analysis
(100%). Relatively large differences of contribution from each benefit were revealed e.g., impact of reduced soil compaction was 19.8%, controlling erosion was 9.0%, reduced tillage energy consumption was 7.2%, declining impede organic matter was 6.0%, enhanced soil biodiversity was 5.9%, improved fertiliser efficiency was 3.2%, and reduced GHG emissions was 3.2%. The sensitivity analysis revealed that the magnitude of weighting seems to have been correctly assumed. This is because of the fact that the results of the sensitivity analysis were in line with those reported in the literature. Generally, reduced soil compaction, reduced tillage energy requirement, and controlling soil erosion are, according to the literature, the top three environmental benefits expected from CTF.
4. Validation of the Framework
Validation of the framework was conducted using two data sets obtained from the literature. The first data set was reported by Dickson et al., 1992[58] and Dickson and Ritchie(1996 and 1996) [59,60], investigating the effect of no-traffic and reduced ground pressure traffic systems in an arable rotation in Scotland, whereas the second data set was reported by Li et al., 2007 [61], investigating the effect of wheel traffic and tillage on runoff and crop yield in Australia. A third validation data set was obtained from Colworth farm (Unilever, UK), where CTF trial fields to investigate the environmental and economic benefits of CTF were established.
4.1. Validation Study 1
When the farm specific parameters of Dickson et al.,1992 [58] and Dickson and Ritchie (1996 and 1996) [59,60] (Table 11), were substituted into the framework as shown in Table 12, the framework predicted an overall environmental benefit from CTF of 52.0% of the theoretical maximum, which is below the average environmental benefit of CTF of 54.2%.
Table 11. Farm specific parameters from Dickson et al., 1992 [58] and Dickson and Ritchie (1996 and 1996) [59,60].
Parameter Impact Point
Moisture content at traffic Moist (assumed) Moisture content at tillage Moist (assumed)
Annual rainfall (mm) 845 Average slope steepness (%) 6.7
Slope length (m) 100 (assumed) Highest axle load (Mg) 4.59 Tyre inflation pressure (kPa) 160
Present tillage system Conventional Soil type Clay loam (fine) Bulk density at traffic (Mg m−3) ~1.5 Bulk density at tillage (Mg m−3) ~1.5
Table 12. Framework impact points for validation study 1.
Parameter Impact Point
Moisture content at traffic 7 Moisture content at tillage 7 Annual rainfall (mm) 4 Slope factor 7 Machine parameters 3 Present tillage system 10
Soil type 0
Bulk density at traffic (Mg m−3) 8 Bulk density at tillage (Mg m−3) 8
Soil organic matter content (%) 2
This overall benefit is broken down into percentage units in descending order as: reduced soil compaction (13.6%), reduced tillage energy consumption (10.7%), controlling erosion (8.3%), enhanced soil biodiversity (6.5%), declining impeded organic matter (6.0%), reduced GHG emissions (3.8%) and improved fertiliser efficiency (3.2%).
4.2. Validation Study 2
When the farm specific parameters of Li et al., 2007 [61] of Table 13 were substituted into the framework as shown in Table 14, the framework predicted an overall environmental benefit from CTF of 47.3% of the theoretical maximum, which is also below the average environmental benefit of CTF of 54.2%. This overall benefit is broken down into percentage units in descending order as: reduced soil compaction (10.2%), reduced tillage energy consumption (9.5%), controlling erosion (8.3%), enhanced soil biodiversity (7.4%), declining impeded organic matter (6.0%), improved fertiliser efficiency (3.2%), and reduced GHG emissions (2.9%). Li et al., 2007 [61] did not examine all environmental benefits of CTF but only runoff, soil water, and crop production. They measured a reduced mean annual runoff of 36.3% with CTF, which increased to 47.2% when combined with no tillage practices. Therefore, the fact that the framework rates control erosion as the third most important environmental benefit may be argued. However, the benefit of controlling erosion contributed to a larger part of the overall benefit (8.3% of the total benefits of 47.3%), as compared to validation Study 1 (8.3% of the total benefits of 52.0%).
Table 13. Farm specific parameters [61].
Parameter Impact Point
Moisture content at traffic Dry (assumed) Moisture content at tillage Moist (assumed)
Annual rainfall (mm) 789 Average slope steepness (%) 7
Table 13. Cont.
Parameter Impact Point
Present tillage system Conventional Soil type Vertisol (fine)
Bulk density at traffic (Mg m−3) Assumed average due to lack of data Bulk density at tillage(Mg m−3) Assumed average due to lack of data Soil organic matter (%) Assumed average due to lack of data
Table 14. Framework impact points for validation study 2.
Parameter Impact Point
Moisture content at traffic 4 Moisture content at tillage 7 Annual rainfall (mm) 4 Slope factor 4 Machine parameters 0 Present tillage system 10
Soil type 0
Bulk density at traffic (Mg m−3) 5 Bulk density at tillage (Mg m−3) 5 Soil organic matter content (%) 5
4.3. Validation Study 3
When the farm specific parameters of Colworth farm (Unilever, UK) shown in (Table 15) were substituted into the framework as described in Table 16, the framework predicted an overall environmental benefit from CTF of 59.3% of the theoretical maximum, which was higher than the average environmental benefit of CTF of 54.2%. This overall benefit is broken down into percentage units in descending order as: reduced soil compaction (24.3%), reduced tillage energy consumption (9.5%), enhanced soil biodiversity (7.1%), controlling erosion (6.5%), declining impeded organic matter (6.0%), improved fertiliser efficiency (3.2%), and reduced GHG emissions (2.9%). Alternatively, if the erosion factor of USLE soil loss value is used for weighting controlling erosion instead, an increase of benefit of control erosion by 0.7% is expected. This would raise the overall score of controlling erosion to 7.2%, overtaking soil biodiversity but leaving the remaining ranking of all other benefits unchanged.
Table 15. Farm specific parameters of Colworth farm (Unilever, UK).
Parameter Impact Point
Moisture content at traffic Moist Moisture content at tillage Moist Annual rainfall (mm) 611 Average slope steepness (%) 2
Table 15. Cont.
Parameter Impact Point
Present tillage system Conventional Soil type Fine, very fine Bulk density at traffic (Mg m−3) 1.2–1.4 Bulk density at tillage (Mg m−3) 1.2–1.4
Soil organic matter (%) 2.5–3.5
Soil loss according to USLE is 2–5 Mg ha−1, which represents an erosion factor 4.
Table 16. Framework impact points for Colworth farm.
Moisture Content at Traffic Impact Point
Moisture content at traffic 7 Moisture content at tillage 7 Annual rainfall (mm) 4 Slope factor 0 Machine parameters 10 Present tillage system 10 Soil type 0
Bulk density at traffic (Mg m−3) 5 Bulk density at tillage (Mg m−3) 5
Soil organic matter content (%) 4
The two largest benefits of CTF at Colworth farm (Unilever, UK), namely, reduced soil compaction and tillage energy consumption were also the highest ranked benefits in the framework due to their higher environmental and scientific weightings. Furthermore, the current research available in the literature confirms that these two benefits are of the highest importance. In fact, the reduction of soil compaction is interlinked with all other benefits, which also highlights the complexity of ranking the framework.
Among the three data sets, it is clear that the highest environmental benefit is expected at Colworth farm. The datasets used for the validation, based on Dickson et al., 1992 [58] and Dickson and Ritchie (1996) [59,60] and Li et al., 2007 [61] were generated in Scotland and Australia, respectively, representing two different farming, weather, topography, and soil conditions. This makes direct comparison between the two data sets very difficult. However, one factor that clearly differentiates these two conditions from those of Colworth farm was the high maximum axle load of machinery used under random traffic at Colworth farm. Consequently, the higher benefit of reduced compaction by CTF at Colworth farm as compared to the other two data sets with smaller axial load machinery is justified.
5. Conclusions
The evaluation of the overall environmental benefit of adopting CTF was successfully carried out based on a framework developed. The study confirms the following conclusions:
(1) There is a substantial evidence in the literature of environmental benefits associated with CTF, which justifies the adoption of CTF, recognizing that even small benefits might add up to a significant sum of environmental benefits.
(2) A framework for predicting the environmental benefits for farm converting to CTF is feasible to construct and implement. The framework is flexible and can be further modified responding to changes in local and/or national agricultural practices.
(3) Literature is in line with the frameworks result, confirming that, reducing compaction, reducing tillage energy consumption and controlling soil erosion are the most pronounced environmental benefits of CTF.
(4) The new framework introduced in this work can be implemented in practice today. Farmers wishing to implement CTF can in advance evaluate the environmental benefits of adopting CTF in their farms with specific practical and environmental conditions. Policy makers can also benefit from this framework by convincing farmers of the environmental benefits that they would expect if they were to adopt CTF.
Further research might be needed to determine the exact impact range of different environmental benefits of CTF subjected to availability of experimental data. This would make it possible to refine the framework, and convince farmers to convert to CTF, when economical benefits are also proved. Acknowledgments
The authors acknowledge the financial support from Unilever. The authors wish to thank Christof Walter and Tim Chamen for the useful discussion and for providing the data of the Unilever farm. Author Contributions
The research in the current work was carried out by master student Martin Palmqvist with supervision of Abdul Mouazen. Palmqvist performed the literature review and data analysis, while the paper was written by Mouazen, based on the master thesis of Palmqvist. Both authors have read and approved the manuscript.
Conflicts of Interest
Appendix
Table A1. Weighting factor calculated for soil compaction comparing trafficked with un-trafficked practices. Compaction indicators included bulk density, penetration resistance and infiltration rate.
Measurement Results % of Relative
Improvement Study
Bulk density CTF positive 90 Botta et al., 2007 [18] CTF positive 83–91 Campbell et al., 1986 [62] CTF positive 81–100 Chamen and Longstaff, 1995 [16]
CTF positive 93 * Unger, 1996 [63] CTF positive 90 Dickson and Ritchie, 1996 [60] CTF positive 91 McHugh et al., 2003 [21]
CTF positive 83 * Raper and Reeves, 2007 [64] CTF positive 96 Dickson et al., 1992 [58]
CTF positive 85 * Bauder et al., 1985 [65] CTF positive 84 * Gerik et al., 1987 [66] CTF positive 88 Voorhees et al., 1984 [67]
CTF positive 87 * Wagger and Denton, 1989 [68] CTF positive 97 * Liebig et al., 1993 [69] CTF positive 85 Sedaghatpour et al., 1995 [17] CTF positive 90 Douglas et al., 1992 [26]
CTF positive 80 Braunack and McGarry, 2006 [70] No difference 100 Braunack et al., 1995 [71] CTF negative - Potter and Chichester, 1993 [25] Penetration resistance CTF positive - Sommer and Zach, 1992 [72]
CTF positive 50 * Radcliffe et al., 1989 [73] CTF positive 57 Carter et al., 1991 [74]
CTF positive - Willcocks, 1981 [75] CTF positive - Raper et al., 1994 [76] Infiltration rate CTF positive 170 Meek et al., 1989 [19] CTF positive 128 Meek et al., 1990 [20]
* Studies comparing trafficked and un-trafficked row under ridge and furrow farming.
Table A2. Weighting factor calculated for soil erosion, comparing trafficked with un-trafficked practices.
Measurement Results % of Relative
Improvement Study
Runoff CTF positive 64 Li et al., 2007 [61] CTF positive 50 Li et al., 2001 [77] CTF positive - Sedaghatpour et al., 1995 [17] CTF positive 70 Tullberg et al., 2001 [23] No difference 0 Reyes et al., 2005 [22]
Table A3. Weighting factor calculated for soil biodiversity, comparing trafficked with un-trafficked practices.
Measurement Results % of Relative Improvement Study
Earthworms CTF positive 125 Pangnakorn et al., 2003 [24] Herbicide use CTF positive - Kurstjens, 2007 [79]
Table A4. Weighting factor calculated for soil organic matter content, comparing trafficked with un-trafficked practices.
Measurement Results % of Relative Improvement Study
Organic carbon CTF positive - Potter and Chichester, 1993 [25]
Table A5. Weighting factor calculated for energy requirement, comparing trafficked with un-trafficked practices.
Measurement Results % of Relative
Improvement Study
Energy requirements CTF positive 50–80 Chamen et al., 1992 [80] CTF positive - McPhee et al., 1995 [56] CTF positive 75 Lamers et al., 1986 [80]
CTF positive 85 Dickson and Campbell, 1990 [81] CTF positive 85 Vermeulen and Klooster, 1992 [82]
CTF positive - Chamen and Cavalli, 1994 [83] CTF positive 70 Chamen and Longstaff, 1995 [16] CTF positive 57 Dickson and Ritchie, 1996 [59] CTF positive - Willcocks, 1981 [75] CTF positive 50–68 Dickson et al., 1992 [58] CTF positive - Chamen et al., 1994 [84]
Table A6. Weighting factor calculated for fertiliser use efficiency, comparing trafficked with un-trafficked practices.
Measurement Result % of Relative Improvement Study
Fertiliser use CTF positive 70–80 Dickson and Ritchie, 1996b [60] CTF positive - Douglas et al., 1992 [26]
Table A.7 Weighting factor calculated for GHG emission from soils, comparing trafficked with un-trafficked practices.
Measurement Result % of Relative Improvement Study
N2O-emissions CTF positive - Ball et al., 1999 [85]
CTF positive - Vermeulen et al., 2007 [30] CO2- and H2O-emissions No difference - Reicosky et al., 1999 [54]
References
2. McPhee, J.E.; Aird, P.L.; Hardie, M.A.; Corkrey, S.R. The effect of controlled traffic on soil physical properties and tillage requirements for vegetable production. Soil Tillage Res. 2015, 149, 33–45.
3. Chamen, W.C.T.; Moxey, A.P.; Towers, W.; Balana, B.; Hallett, P.D. Mitigating arable soil compaction: A review and analysis of available cost and benefit data. Soil Tillage Res. 2015, 146, 10–25.
4. Taylor, J.H. Benefits of permanent traffic lanes in a controlled traffic crop production system. Soil Tillage Res. 1983, 3, 385–395.
5. Spoor, G. Benefits from traffic control. Landwards 1997, 52, 2–5.
6. Chamen, W.C.T. “Controlled traffic” Farming: Literature Review and Appraisal of Potential Use in the U.K. In Research Review No. 59; HGCA: London, UK, 2006.
7. Pollard, F.; Elliott, J.G. The effect of soil compaction and method of fertilizer placement on the growth of barley using a concrete track technique. J. Agric. Eng. Res. 1978, 23, 203–216.
8. Lamers, J.G.; Perdok, U.D.; Lumkes, L.M.; Klooster, J.J. Controlled traffic farming systems in the Netherlands. Soil Tillage Res. 1986, 8, 65–76.
9. Raper, R.L. Agricultural traffic impacts on soil. J. Terramech. 2005, 42, 259–280.
10. Tullberg, J.N.; Yule, D.F.; McGarry, D. Controlled traffic farming––From research to adoption in Australia. Soil Tillage Res. 2007, 97, 272–281.
11. Palmqvist, M. Evaluation of the Environmental Benefits of Controlled Traffic Farming. Master’s Thesis, The Cranfield University, Cranfield, UK, 2008.
12. Houšková, B.; Montanarella, L. The natural susceptibility of european soils to compaction. In JRC Scientific and Technical Report on Threats to Soil Quality in Europe; Tóth, G., Montanarella, L., Rusco, E., Eds.; European Commission Joint Research Centre Institute for Environment and Sustainability: Ispra, Italy, 2008; pp. 23–33.
13. Hakansson, I. A method for characterizing the state of compactness of the plough layer. Soil Tillage Res. 1990, 16, 105–120.
14. Franzen, H.; Lal, R.; Ehlers, W. Tillage and mulching effects on physical properties of a tropical Alfisol. Soil Tillage Res. 1994, 28, 329–346.
15. Presbitero, A.L.; Rose, C.W.; Yu, B.; Ciesiolka, C.A.A.; Coughlan, K.J.; Fentie, B. Investigation of soil erosion from bare steep slopes of the humid tropic in Philippines. Earth Interact. 2005, 9, 1–30.
16. Chamen, W.C.T.; Longstaff, D.J. Traffic and tillage effects on soil conditions and crop growth on a swelling clay soil. Soil Use Manag. 1995, 11, 168–176.
17. Sedaghatpour, S.; Ellis, T.; Hignett, C.; Bellotti, B. Six Years of Controlled Traffic Cropping Research on a Red Brown Earth at Roseworthy in South Australia. In Proceedings of the National Controlled Traffic Conference, Rockhampton, Australia, 13–14 September 1995; pp. 69–75. 18. Botta, G.F.; Pozzolo, O.; Bomben, M.; Rosatto, H.; Rivero, D.; Ressia, M.; Tourn, M.; Soza, E.;
Vazquez, J. Traffic alternatives for harvesting soybean (Glycine max L.): Effect on yields and soil under a direct sowing system. Soil Tillage Res. 2007, 96, 145–154.
20. Meek, B.D.; DeTar, W.R.; Rolph, D.; Rechel, E.R.; Carter, L.M. Infiltration rate as affected by an alfalfa and no-till cropping system. Soil Sci. Soc. Am. J. 1990, 54, 505–508.
21. McHugh, A.; Tullberg, J.; Freebairn, D. Effects of field traffic removal on hydraulic conductivity, plant available water and water capacity. In Proceedings of the International Soil Tillage Research Organisation 16th Triennial conference, Brisbane, Australia, 13–18 July 2003; pp. 717–723. 22. Reyes, M.R.; Raczkowski, C.W.; Reddy, G.B.; Gayle, G.A. Effect of wheel traffic compaction on
runoff and soil erosion in no-till. Appl. Eng. Agric. 2005, 21, 427–433.
23. Tullberg, J.N.; Ziebarth, P.J.; Li, Y.X. Tillage and traffic effects on runoff. Aust. J. Soil Res. 2001, 39, 249–257.
24. Pangnakorn, U.; George, D.L.; Tullberg, J.N.; Gupta, M.L. Effect of tillage and traffic on earthworm populations in a vertosol in South-East Queensland. In Proceedings of the International Soil Tillage Research Organisation 16th Triennial Conference, Brisbane, Australia, 13–18 July 2003; pp. 881–885.
25. Potter, K.N.; Chichester, F.W. Physical and chemical properties of a vertisol with continuous controlled-traffic, no-till management. Trans. Am. Soc. Agric. Eng. 1993, 36, 95–99.
26. Douglas, J.T.; Campbell, D.J.; Crawford, C.E. Soil and crop responses to conventional, reduced ground pressure and zero traffic systems for grass silage production. Soil Tillage Res. 1992, 24, 421–439.
27. Machefert, S.E.; Dise, N.B.; Goulding, K.W.T.; Whitehead, P.G. Nitrous oxide emission from a range of land uses across Europe. Hydrol. Earth Syst. Sci. 2002, 6, 325–337.
28. Smith, K.A.; Conen, F. Impacts of land management on fluxes of trace greenhouse gases. Soil Use Manag. 2004, 20, 255–263.
29. Ball, B.C.; Parker, J.P.; Scott, A. Soil and residue management effects on cropping conditions and nitrous oxide fluxes under controlled traffic in Scotland 2. Nitrous oxide, soil N status and weather. Soil Tillage Res. 1999, 52, 191–201.
30. Vermeulen, G.D.; Mosquera, J.; van der Wel, C.; van der Klooster, A.; Steenhuizen, J.W. Potential of Controlled Traffic Farming with Automatic Guidance on an Organic Farm in the Netherlands. In Precision Agriculture ’07; Stafford, J.V., Ed.; Wageningen Academic Publishers: Wageningen, The Netherlands, 2007; pp. 473–481.
31. Li, Y.X.; Tullberg, J.N.; Freebairn, D.M.; McLaughlin, N.B.; Li, H.W. Effects of tillage and traffic on crop production in dryland farming systems: I. Evaluation of PERFECT soil-crop simulation model. Soil Tillage Res. 2008, 100, 15–24.
32. Li, Y.X.; Tullberg, J.N.; Freebairn, D.M.; McLaughlin, N.B.; Li, H.W. Effects of tillage and traffic on crop production in dryland farming systems: II. Long-term simulation of crop production using the PERFECT model. Soil Tillage Res. 2008, 100, 25–33.
33. Hamza, M.A.; Anderson, W.K. Soil compaction in cropping systems a review of the nature, causes and possible solutions. Soil Tillage Res. 2005, 82, 121–145.
34. O’Sullivan, M.F.; Simota, C. Modelling the environmental impacts of soil compaction: A review. Soil Tillage Res. 1995, 35, 69–84.
36. Abramson, L.W.; Lee, T.S.; Sharma, S.; Boyce, G.M. Slope Stability and Stabilization Methods, 2nd ed.; John Wiley and Sons: New York, NY, USA, 2002.
37. Spoor, G.; Tijink, F.G.J.; Weisskopf, P. Subsoil compaction: Risk, avoidance, identification and alleviation. Soil Tillage Res. 2003, 73, 175–182.
38. Arvidsson, J.; Keller, T. Soil stress as affected by wheel load and tyre inflation pressure. Soil Tillage Res. 2007, 96, 284–291.
39. Nordström, T.; Rydberg, T.; Törner, L. Miljönyckeltal: Kväve, Fosfor, Kadmium, Energi och Markpackning, 2001. Available online: http://www2.slu.se/forskning/fakta/faktajordbruk/pdf01/Jo 01–07.pdf (accessed on 21 May 2008).
40. Mouazen, A.M.; Ramon, H. Expanding implementation of an on-line measurement system of topsoil compaction in loamy sand, loam, silt loam and silt soils. Soil Tillage Res. 2009, 103, 98–104. 41. Brady, N.C.; Weil, R.R. The Nature and Properties of Soils, 14th ed.; Pearson: Upper Saddle
River, NJ, USA, 2008.
42. Biskupska, M.; Llewellyn, C. Soil Tillage and Management Laboratory Workbook; Cranfield University: Cranfield, UK, 2007.
43. Watts, C.W.; Clark, L.J.; Poulton, P.R.; Powlson, D.S.; Whitmore, A.P. The role of clay, organic carbon and long-term management on mouldboard plough draught measured on the Broadbalk wheat experiment at Rothamsted. Soil Use Manag. 2006, 22, 334–341.
44. Morgan, R.P.C. Soil Erosion and Conservation, 3rd ed.; Blackwell Publishing: Oxford, UK, 2005. 45. Rice, C.W. Organic Matter and Nutrient Dynamics, Encyclopedia of Soil Science, 2nd ed.;
Taylor & Francis: New York, USA, 2006; pp. 1180–1183.
46. Hermle, S.; Anken, T.; Leifeld, J.; Weisskopf, P. The effect of the tillage system on soil organic carbon content under moist, cold-temperate conditions. Soil Tillage Res. 2008, 98, 94–105.
47. Yang, X.M.; Drury, C.F.; Reynolds, W.D.; Tan, C.S. Impacts of long-term and recently imposed tillage practices on the vertical distribution of soil organic carbon. Soil Tillage Res. 2008, 100, 120–124.
48. Ogle, S.M.; Breidt, F.J.; Paustian, K. Agricultural management impacts on soil organic carbon storage under moist and dry climatic conditions of temperate and tropical regions. Biogeochemistry 2005, 72, 87–121
49. Cookson, W.R.; Murphy, D.V.; Roper, M.M. Characterizing the relationships between soil organic matter components and microbial function and composition along a tillage disturbance gradient. Soil Biol. Biochem. 2008, 40, 763–777.
50. Fox, C.A.; Jarvis, I.; Behan-Pelletier, V.; Dalpé, Y.; Clapperton, J.; Prévost, D.; Joschko, M.; Lentzsch, P. Progress towards developing a soil biodiversity indicator for Canada. In Agricultural Impacts on Soil Erosion and Soil Biodiversity: Developing Indicators for Policy Analysis, In Proceedings of the OECD Expert Meeting, Rome, Italy, 25–28 March 2003; pp. 439–451.
51. Chan, K.Y.; Oates, A.; Swan, A.D.; Hayes, R.C.; Dear, B.S.; Peoples, M.B. Agronomic consequences of tractor wheel compaction on a clay soil. Soil Tillage Res. 2006, 89, 13–21.
52. Botta, G.F.; Jorajuria, D.; Draghi, L.M. Influence of the axle load, tyre size and configuration on the compaction of a freshly tilled clayey soil. J. Terramech. 2002, 39, 47–54.
54. Reicosky, D.C.; Reeves, D.W.; Prior, S.A.; Runion, G.B.; Rogers, H.H.; Raper, R.L. Effects of residue management and controlled traffic on carbon dioxide and water loss. Soil Tillage Res. 1999, 52, 153–165.
55. Mouazen, A.M.; Ramon, H. A numerical-statistical hybrid modelling scheme for evaluation of draught requirements of a subsoiler cutting a sandy loam soil, as affected by moisture content, bulk density and depth. Soil Tillage Res. 2002, 63, 155–165.
56. McPhee, J.E.; Braunack, M.V.; Garside, A.L.; Reid, D.J.; Hilton, D.J. Controlled traffic for irrigated double cropping in a semi-arid tropical environment: Part 2, Tillage operations and energy use. J. Agric. Eng. Res. 1995, 60, 183–189.
57. Arvidsson, J.; Keller, T.; Gustafsson, K. Specific draught for mouldboard plough, chisel plough and disc harrow at different water contents. Soil Tillage Res. 2004, 79, 221–231.
58. Dickson, J.W.; Campbell, D.J.; Ritchie, R.M. Zero and conventional traffic systems for potatoes in Scotland, 1987–1989. Soil Tillage Res. 1992, 24, 397–419.
59. Dickson, J.W.; Ritchie, R.M. Zero and reduced ground pressure traffic systems in an arable rotation 1. Cultivation power requirement. Soil Tillage Res. 1996, 38, 71–88.
60. Dickson, J.W.; Ritchie, R.M. Zero and reduced ground pressure traffic systems in an arable rotation 2. Soil and crop responses. Soil Tillage Res. 1996, 38, 89–113.
61. Li, Y.X.; Tullberg, J.N.; Freebairn, D.M. Wheel traffic and tillage effects on runoff and crop yield. Soil Tillage Res. 2007, 97, 282–292.
62. Campbell, D.J.; Dickson, J.W.; Ball, B.C.; Hunter, R. Controlled seedbed traffic after ploughing or direct drilling under winter barley in Scotland, 1980–1984. Soil Tillage Res. 1996, 8, 3–28. 63. Unger, P.W. Soil bulk density, penetration resistance, and hydraulic conductivity under controlled
traffic conditions. Soil Tillage Res. 1996, 37, 67–75.
64. Raper, R.L.; Reeves, D.W. In-row subsoiling and controlled traffic effects on coastal plain soils. Trans. Am. Soc. Agric. Eng. 2007, 50, 1109–1115.
65. Bauder, J.W.; Randall, G.W.; Schuler, R.T. Effects of tillage with controlled wheel traffic on soil properties and root growth of corn. J. Soil Water Conserv. 1985, 40, 382–385.
66. Gerik, T.J.; Morrison, J.E., Jr.; Chichester, F.W. Effects of controlled-traffic on soil physical properties and crop rooting. Agron. J. 1987, 79, 434–438.
67. Voorhees, W.B.; Lindstrom, M.J. Long-term effects of tillage method and soil tilth independent of wheel traffic compaction. Soil Sci. Soc. Am. J. 1984, 48, 152–156.
68. Wagger, M.G.; Denton, H.P. Influence of cover crop and wheel traffic on soil physical properties in continuous no-till corn. Soil Sci. Soc. Am. J. 1989, 53, 1206–1210.
69. Liebig, M.A.; Jones, A.J.; Mielke, L.N.; Doran, J.W. Controlled wheel traffic effects on soil properties in ridge tillage. Soil Sci. Soc. Am. J. 1993, 57, 1061–1066.
70. Braunack, M.V.; McGarry, D. Traffic control and tillage strategies for harvesting and planting of sugarcane (Saccharum officinarum) in Australia. Soil Tillage Res. 2006, 89, 86–102.
71. Braunack, M.V.; McPhee, J.E.; Reid, D.J. Controlled traffic to increase productivity of irrigated row crops in the semi-arid tropics. Aust. J. Exp. Agric. 1995, 35, 503–513.
73. Radcliffe, D.E.; Manor, G.; Clark, R.L.; West, L.T.; Langdale, G.W.; Bruce, R.R. Effect of traffic and in-row chiselling on mechanical impedance. Soil Sci. Soc. Am. J. 1989, 53, 1197–1201.
74. Carter, L.M.; Meek, B.D.; Rechel, E.A. Zone production system for cotton: Soil response. Trans. ASAE 1991, 34, 354–360.
75. Willcocks, T.J. Tillage of clod-forming sandy loam soils in the semi-arid climate of Botswana. Soil Tillage Res. 1981, 1, 323–350.
76. Raper, R.L.; Reeves, D.W.; Burt, E.C.; Torbert, H.A. Conservation tillage and traffic effects on soil condition. Trans. ASAE 1994, 37, 763–768.
77. Li, Y.X.; Tullberg, J.N.; Freebairn, D.M. Traffic and residue cover effects on infiltration. Aust. J. Soil Res. 2001, 39, 239–247.
78. Rohde, K.; Yule, D. Soil compaction and controlled traffic farming research in Central Queensland. In Proceedings of the International Soil Tillage Research Organisation 16th Triennial Conference, Brisbane, Australia, 13–18 July 2003; pp. 1020–1027.
79. Kurstjens, D.A.G. Precise tillage systems for enhanced non-chemical weed management. Soil Tillage Res. 2007, 97, 293–305.
80. Chamen, W.C.T.; Watts, C.W.; Leede, P.R.; Longstaff, D.J. Assessment of a wide span vehicle (gantry), and soil and cereal crop responses to its use in a zero traffic regime. Soil Tillage Res. 1992, 24, 359–380.
81. Dickson, J.W.; Campbell, D.J. Soil and crop responses to zero- and conventional-traffic systems for winter barley in Scotland, 1982–1986. Soil Tillage Res. 1990, 18, 1–26.
82. Vermeulen, G.D.; Klooster, J.J. The potential of a low ground pressure traffic system to reduce soil compaction on a clayey loam soil. Soil Tillage Res. 1992, 24, 337–358.
83. Chamen, W.C.T; Cavalli, R. The effect of soil compaction on mole plough draught. Soil Tillage Res. 1994, 32, 303–311.
84. Chamen, W.C.T.; Dowler, D.; Leede, P.R.; Longstaff, D.J. Design, operation and performance of a gantry system: Experience in arable cropping. J. Agric. Eng. Res. 1994, 59, 45–60.
85. Ball, B.C.; Scott, A.; Parker, J.P. Field N2O, CO2 and CH4 fluxes in relation to tillage, compaction and soil quality in Scotland. Soil Tillage Res. 1999, 53, 29–39.
![Table 11. Farm specific parameters from Dickson et al., 1992 [58] and Dickson and Ritchie (1996 and 1996) [59,60]](https://thumb-ap.123doks.com/thumbv2/123deta/6871306.246548/14.892.244.663.801.1096/table-farm-specific-parameters-dickson-et-dickson-ritchie.webp)
![Table 13. Farm specific parameters [61].](https://thumb-ap.123doks.com/thumbv2/123deta/6871306.246548/15.892.194.706.964.1150/table-farm-specific-parameters.webp)
